Churn Rate Formula: How to Calculate Churn in 2026
The churn rate formula looks simple until you try to apply it to real revenue data. Here's how to calculate customer and revenue churn correctly in 2026.
Churn Rate Formula: How to Calculate Churn in 2026
TL;DR
- The basic churn rate formula is
(customers lost ÷ customers at start of period) × 100— but that single number hides more than it reveals. - Customer churn and revenue churn answer different questions. You need both, and they rarely match.
- Net revenue churn can go negative when expansion outpaces losses — the strongest signal in SaaS.
- The most common churn math mistakes come from messy denominators: mid-period signups, blended segments, and dirty CRM data.
- Accurate churn starts with accurate contact and account records. Garbage in, garbage churn rate.
Churn rate is the percentage of customers — or revenue — you lose over a set period. Get the formula right and it becomes the most honest mirror your business owns. Get it wrong and you'll celebrate a "5% churn" that's actually bleeding you dry. This guide walks the exact math, the variants that matter, worked examples, benchmarks, and the data-quality traps that quietly corrupt the number.
What is the churn rate formula?#
The conclusion first: the core churn rate formula is dead simple.
Churn rate = (Customers lost during period ÷ Customers at start of period) × 100If you started the month with 1,000 customers and 40 cancelled, your monthly churn rate is (40 ÷ 1,000) × 100 = 4%.
Think of churn like a leaky bucket. Acquisition is the tap pouring water in; churn is the hole in the bottom. You can pour faster and faster, but if the hole is wide enough, the bucket never fills. The churn rate measures how wide that hole is, expressed as a percentage of what was in the bucket when the period began.
The subtlety is in the word "lost" and the words "at start of period." Both are easier to define on a whiteboard than in your actual data, and that's where most teams quietly go wrong.
Replace the image syntax mentally — that meme sits here on purpose: a documented formula beats a number someone "feels good about" in a board meeting.
How do you calculate customer churn vs revenue churn?#
You calculate them with two different numerators, and they tell two different stories.
Customer churn counts logos. It treats a $50/month account and a $50,000/month account as one unit each. It answers: are people leaving?
Revenue churn counts dollars. It weights every cancellation by how much money walked out the door. It answers: is the money leaving?
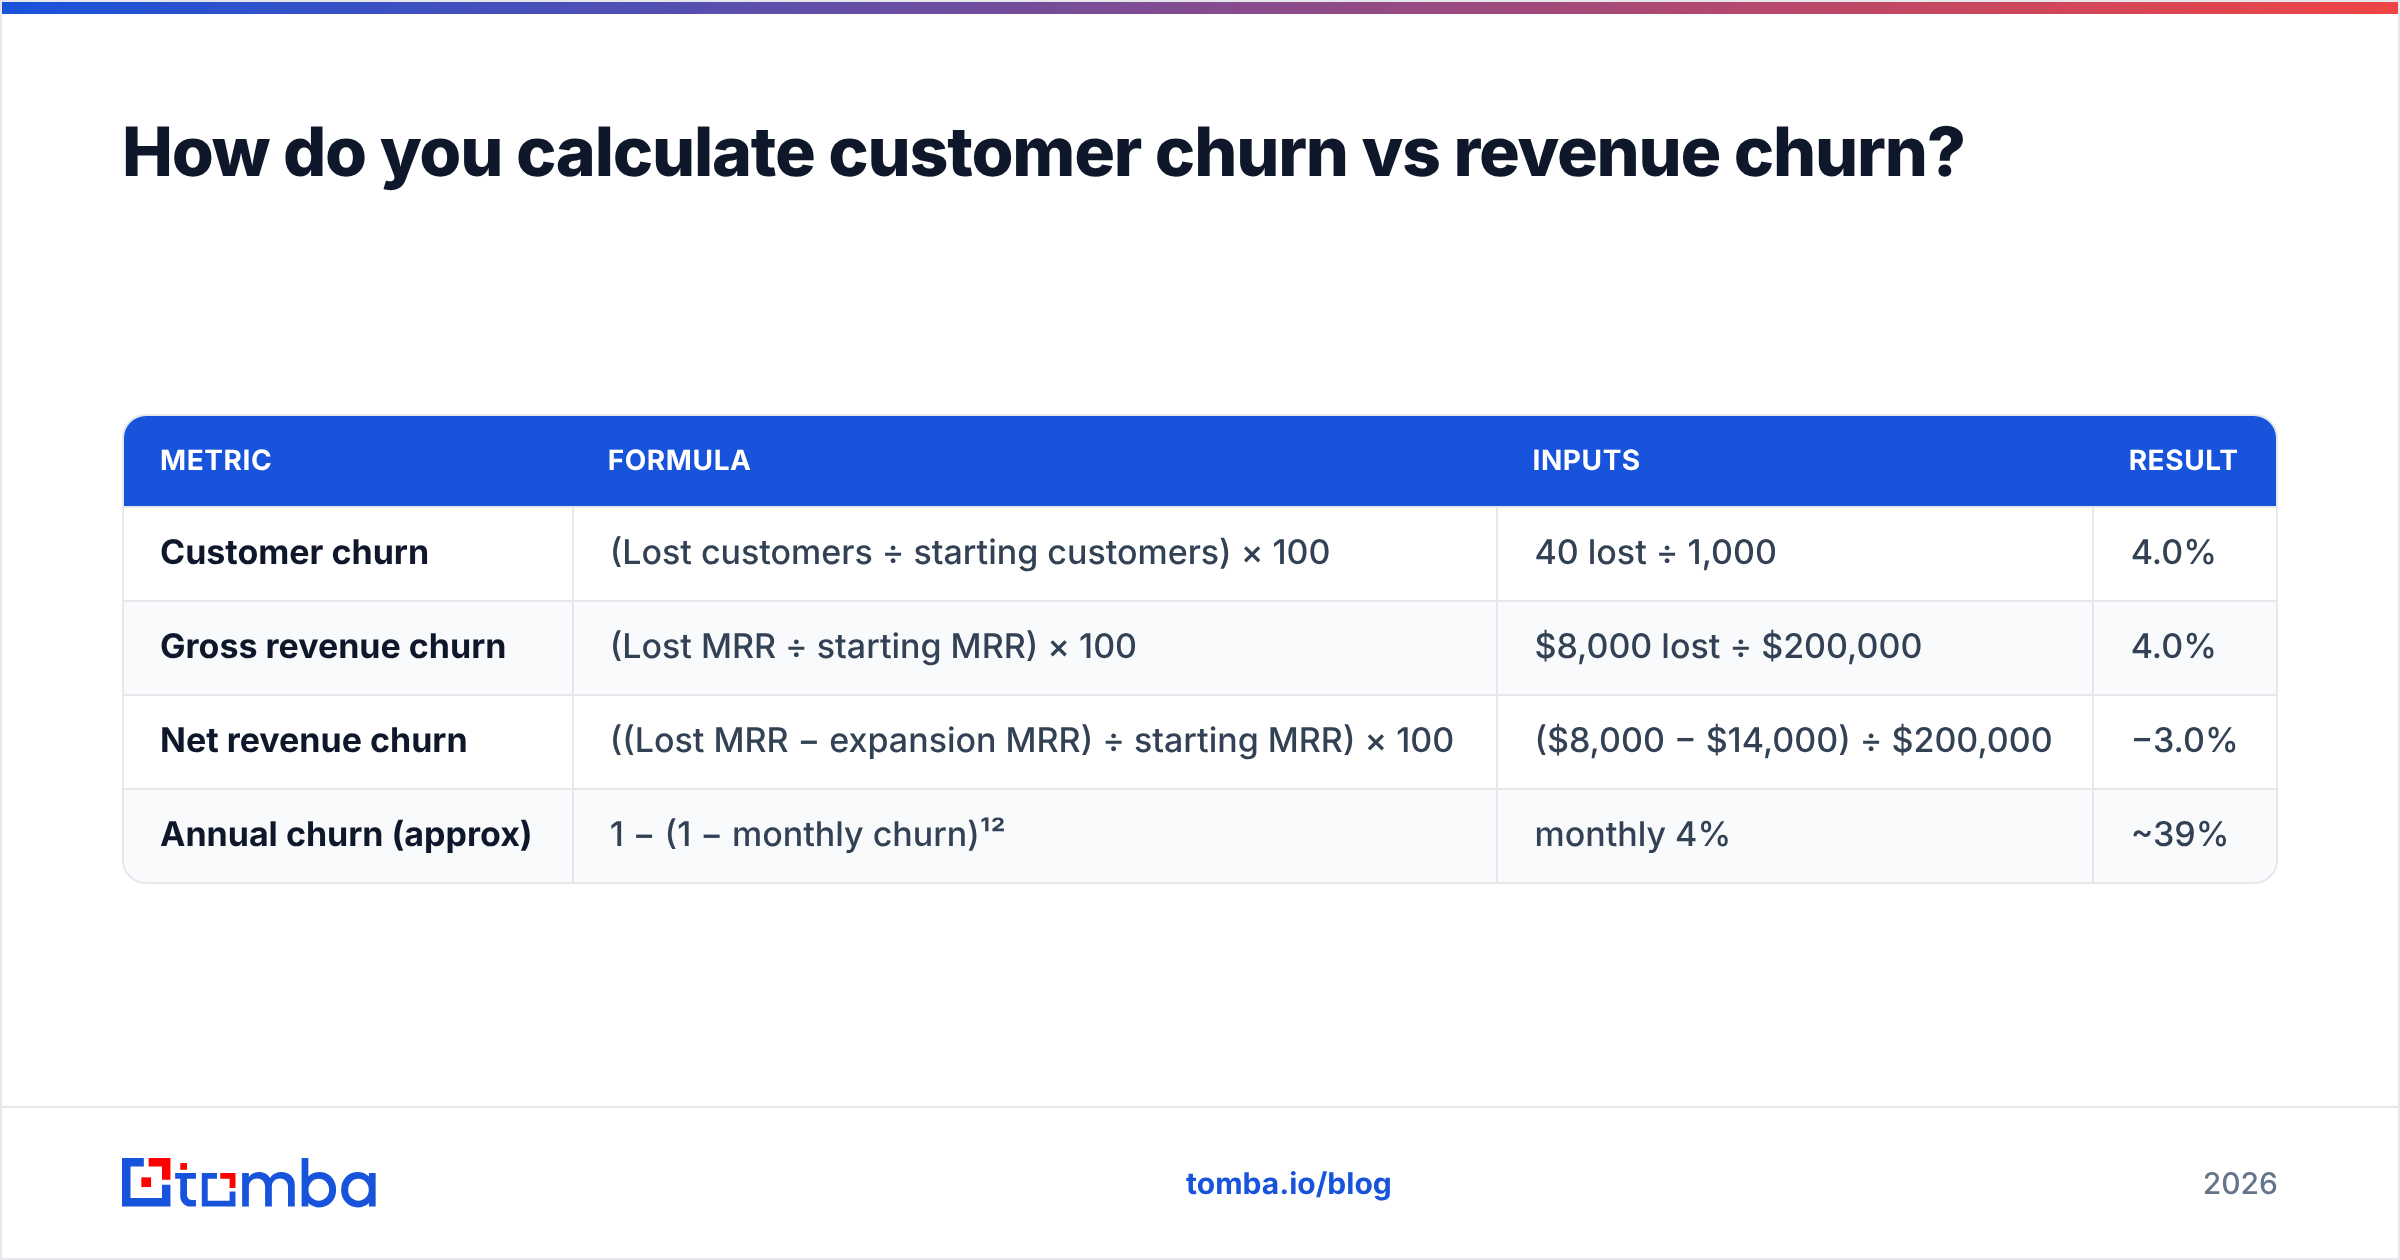
Here is the same business viewed both ways in a single month:
| Metric | Formula | Inputs | Result |
|---|---|---|---|
| Customer churn | (Lost customers ÷ starting customers) × 100 | 40 lost ÷ 1,000 | 4.0% |
| Gross revenue churn | (Lost MRR ÷ starting MRR) × 100 | $8,000 lost ÷ $200,000 | 4.0% |
| Net revenue churn | ((Lost MRR − expansion MRR) ÷ starting MRR) × 100 | ($8,000 − $14,000) ÷ $200,000 | −3.0% |
| Annual churn (approx) | 1 − (1 − monthly churn)¹² | monthly 4% | ~39% |
Notice the last two rows. Gross revenue churn can never go below zero — you can't lose less than nothing. Net revenue churn subtracts expansion revenue (upgrades, seat additions, upsells) from the losses, and when your existing customers grow faster than others leave, the number turns negative. Negative net churn means your current book of business grows even if you never sign another new logo. That's the holy grail metric investors look for, and you can read more about how it ties into broader revenue operations discipline.
The four metrics above form your churn dashboard. Track them as a set:
- Customer churn — the early-warning signal for product or onboarding problems.
- Gross revenue churn — the unvarnished size of the leak in dollars.
- Net revenue churn — whether expansion is patching the leak.
- Annualized churn — the long-horizon view for forecasting and valuation.
Why does the denominator break your churn rate?#
Because "customers at the start of the period" is ambiguous the moment customers join or leave mid-period.
Say you start the month with 1,000 customers, add 200 during the month, and lose 50. Which denominator is correct?
50 ÷ 1,000 = 5.0%— counts only customers who could have churned from day one.50 ÷ 1,200 = 4.2%— dilutes the rate with brand-new customers who barely had time to cancel.50 ÷ 1,100 = 4.5%— uses the average of start and end counts.
The first is the defensible default for most SaaS reporting: you measure churn against the cohort that was actually exposed to the full period. Including same-month signups in the denominator artificially flatters your number, because a customer who joined on the 28th had almost no chance to leave. HubSpot's churn guidance makes the same point — be ruthlessly consistent about which cohort you measure, period over period, or your trend line becomes fiction.
The rule: pick one denominator definition and never change it. A churn rate is only useful as a comparison to your own past churn rate. Switch the math and you lose the comparison.
What is a good churn rate in 2026?#
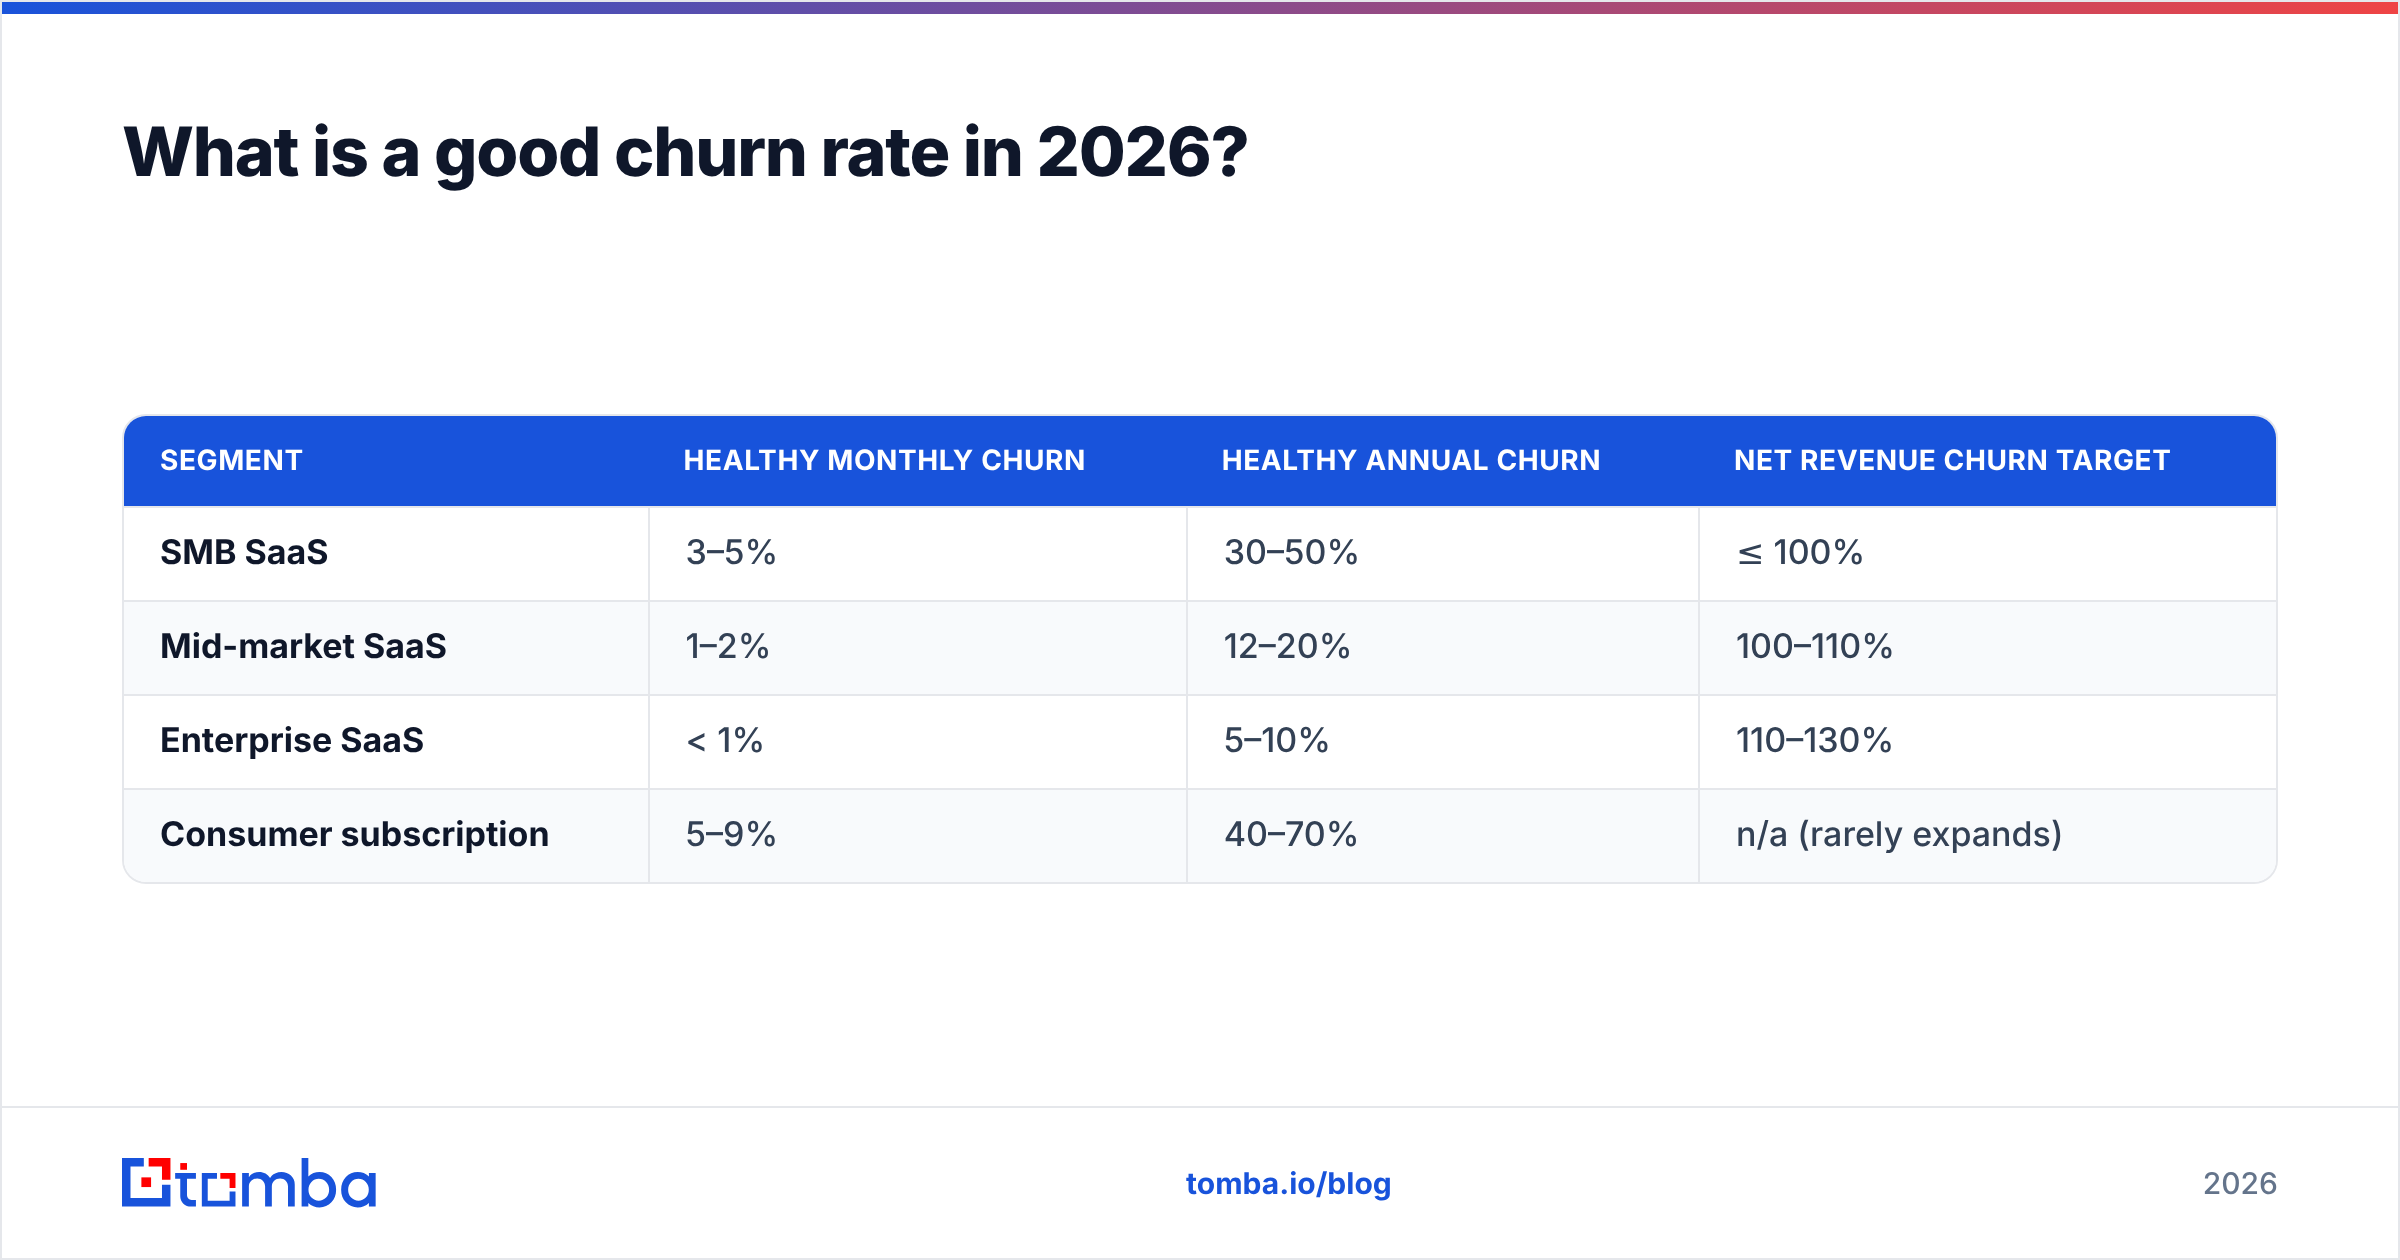
Short answer: it depends on who you sell to, but here are working benchmarks.
| Segment | Healthy monthly churn | Healthy annual churn | Net revenue churn target |
|---|---|---|---|
| SMB SaaS | 3–5% | 30–50% | ≤ 100% |
| Mid-market SaaS | 1–2% | 12–20% | 100–110% |
| Enterprise SaaS | < 1% | 5–10% | 110–130% |
| Consumer subscription | 5–9% | 40–70% | n/a (rarely expands) |
SMB churn runs high because small businesses fail, switch tools casually, and buy on tight budgets. Enterprise churn runs low because contracts are annual, switching costs are brutal, and procurement is slow in both directions. If you sell to SMBs and someone benchmarks you against an enterprise vendor's 0.8%, the comparison is meaningless.
For deeper context on how analysts frame retention economics, Gartner's research on customer retention is a reasonable starting reference, and the Wikipedia entry on churn rate covers the formula variants across industries beyond SaaS.
How does data quality wreck your churn number?#
Directly, and more often than anyone admits. Your churn rate is only as trustworthy as the customer records feeding it.
Here's how dirty data corrupts the math:
- Duplicate accounts inflate your starting count, shrinking the denominator's honesty. One customer logged twice looks like two — and when they leave, your churn looks artificially small relative to a padded base.
- Stale contacts mean you flag an account as "active" when the champion left six months ago and nobody renewed the relationship. You discover the churn only at renewal, too late to save it.
- Misattributed cancellations — when a customer downgrades but your CRM marks it as a full cancel — push gross churn up and hide expansion revenue that should be offsetting it.
- Unverified emails break your save-the-customer outreach. You can calculate a perfect churn rate and still be unable to reach the at-risk accounts because half your contact emails bounce.
The fix is upstream. Before you trust any churn report, your account and contact data needs to be deduplicated, current, and verified. That's where keeping records clean with ongoing data enrichment earns its keep — enriched, fresh firmographic and contact data means the customer list you're dividing by is real, and the people you're trying to retain are actually reachable. Pair that with an email verifier pass so your churn-prevention emails land instead of bouncing.
It's worth saying plainly: a beautiful churn formula on top of a rotten CRM produces a confident, precise, wrong answer.
How do you reduce churn once you can measure it?#
You attack the reasons behind the number, not the number itself. Lowering churn is an operational program, not a math trick. A practical sequence:
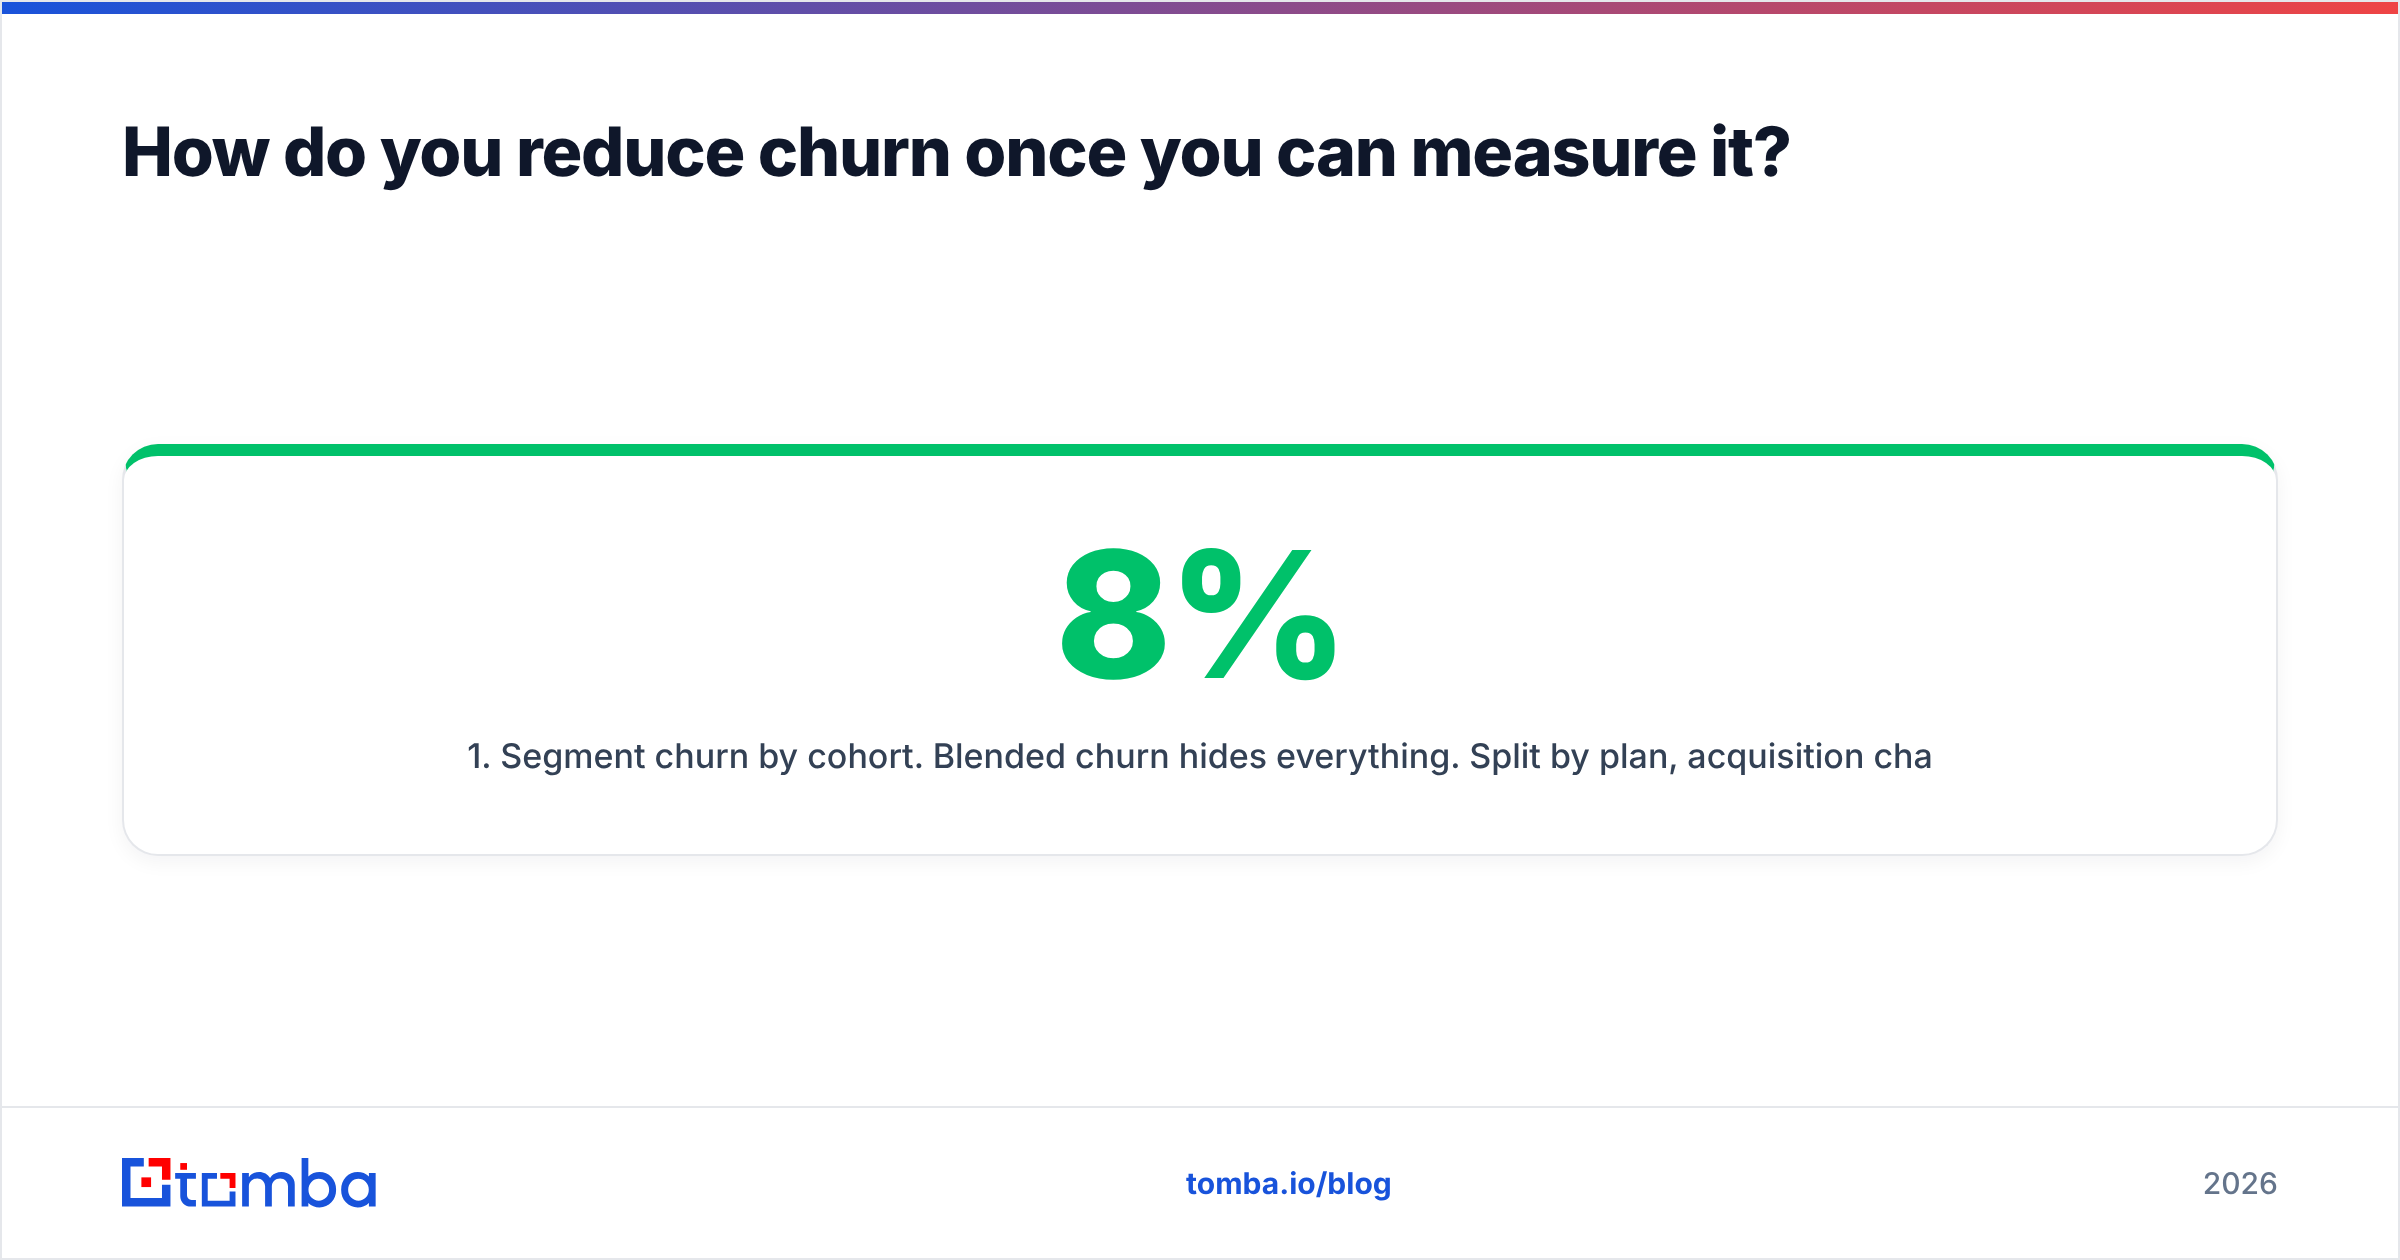
- Segment churn by cohort. Blended churn hides everything. Split by plan, acquisition channel, company size, and signup month. The 8% blended rate is often a 2% enterprise rate dragging behind a 20% free-trial-conversion disaster.
- Find the leading indicators. Logins, feature adoption, support ticket volume, and time-to-first-value usually predict churn weeks before the cancellation. Instrument them.
- Build a save play. When an account trips a risk threshold, a human or automated outreach needs to reach the right person fast — which again requires accurate contact data and reachable emails.
- Fix onboarding first. Most SMB churn happens in the first 90 days. The cheapest churn to prevent is the churn that never happens because the customer hit value quickly.
- Re-measure monthly. Treat each intervention as an experiment and watch the cohort churn rate move. If it doesn't move, the intervention didn't work — kill it.
The teams that win at retention treat the churn rate formula as a starting gun, not a finish line. The formula tells you the bucket is leaking. The work is finding and patching the holes.
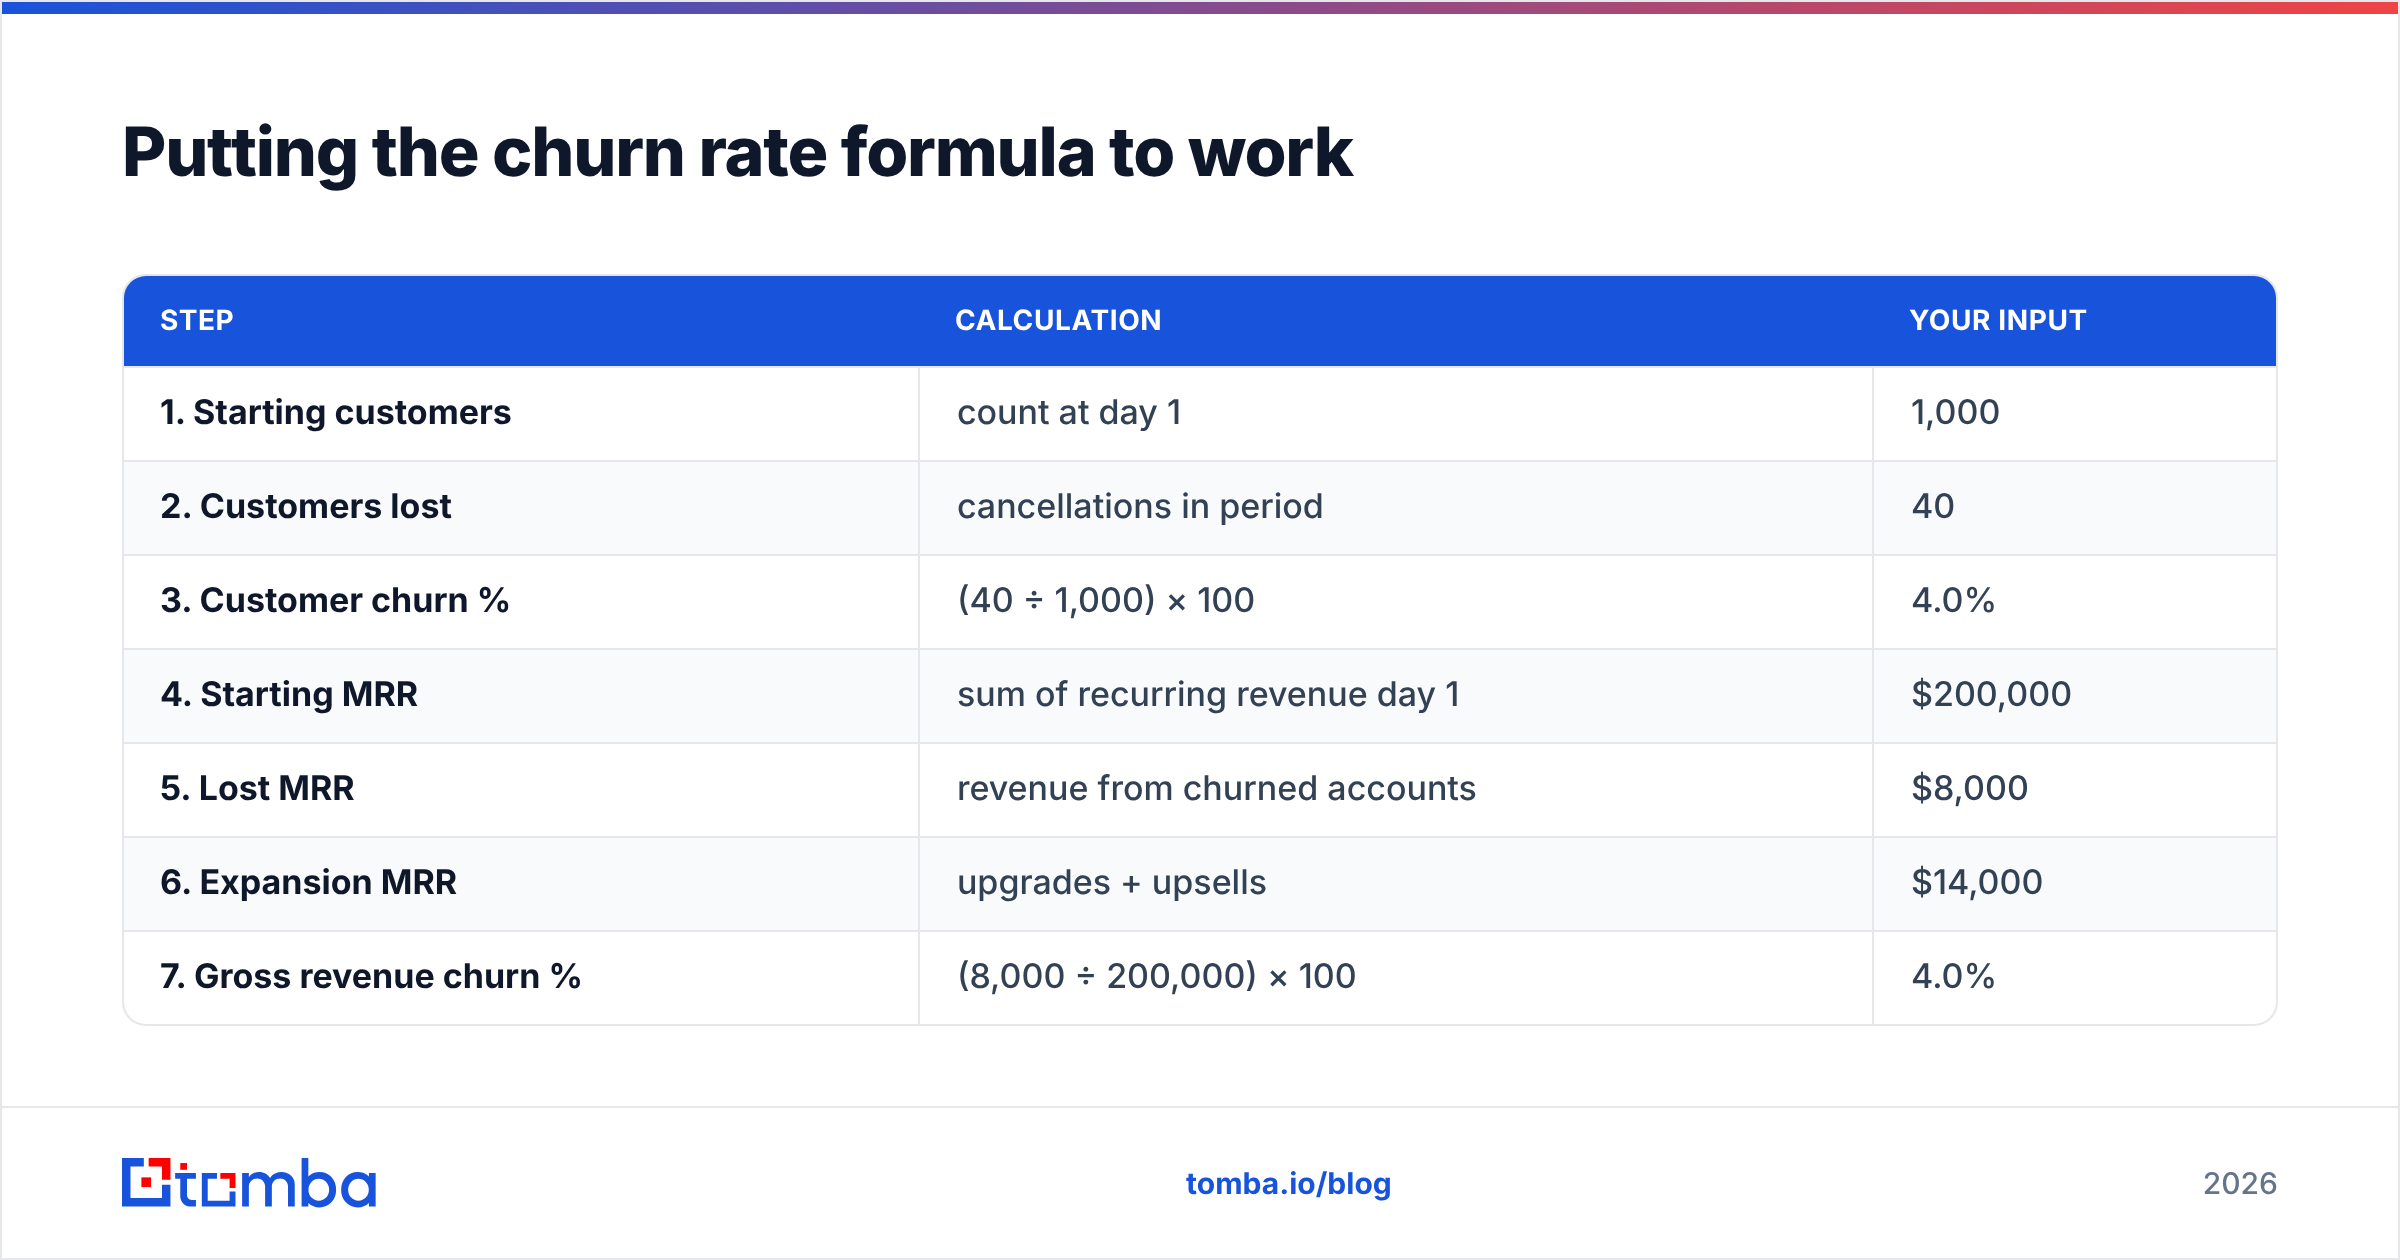
Putting the churn rate formula to work#
Here's the full worked example one more time, end to end, so you can drop your own numbers in:
| Step | Calculation | Your input |
|---|---|---|
| 1. Starting customers | count at day 1 | 1,000 |
| 2. Customers lost | cancellations in period | 40 |
| 3. Customer churn % | (40 ÷ 1,000) × 100 | 4.0% |
| 4. Starting MRR | sum of recurring revenue day 1 | $200,000 |
| 5. Lost MRR | revenue from churned accounts | $8,000 |
| 6. Expansion MRR | upgrades + upsells | $14,000 |
| 7. Gross revenue churn % | (8,000 ÷ 200,000) × 100 | 4.0% |
| 8. Net revenue churn % | ((8,000 − 14,000) ÷ 200,000) × 100 | −3.0% |
That negative net churn in step 8 is the difference between a business that has to sprint on acquisition forever and one that compounds quietly on its own base. Both started from the "same" 4% churn headline. The formula you choose decides which story you tell.
Frequently asked questions#
Is churn rate calculated monthly or annually? Both. Calculate it monthly for operational tightness and annualize it for forecasting. Don't simply multiply monthly by 12 — use 1 − (1 − monthly rate)¹² to account for compounding, or your annual figure will be overstated.
What's the difference between gross and net revenue churn? Gross revenue churn counts only lost revenue and can never be negative. Net revenue churn subtracts expansion revenue from losses and can go negative when upsells outpace cancellations.
Should free trial users count in churn? Usually no. Mixing free-trial drop-off with paying-customer cancellations produces a number that means nothing. Track trial-to-paid conversion separately.
Get the data your churn rate depends on#
Your churn rate is a division problem, and both halves of that fraction live in your customer data. If the accounts are duplicated, the contacts are stale, and the emails bounce, no formula will save the number. Start by making the underlying records accurate and reachable. The Tomba Email Finder helps you keep verified, current contact data on every account — so when an account trips a churn-risk signal, you can actually reach the decision-maker in time to save it, and the customer list you're measuring against is real. Clean data first, honest churn rate second, lower churn third.
Ready to find emails that actually work?
Join 150,000+ professionals who stopped guessing and started sending. Free credits on signup — no credit card required.
Get the Tomba newsletter
Practical outbound tactics and product updates — once every two weeks.
About the author