Click to Open Rate vs Click Through Rate: 2026 Guide
CTOR and CTR sound interchangeable but they measure two very different things. Here's how to read each metric, when to trust it, and how to lift both in 2026.
Most email reports put click rate front and center and bury the metric that actually tells you whether your message landed. If you only watch one number, you will optimize the wrong half of your funnel. Click to open rate vs click through rate is not a trivia question — it decides whether you fix your subject lines or your copy.
TL;DR#
- Click through rate (CTR) = clicks ÷ emails delivered. It blends deliverability, subject-line strength, and copy into one blunt number.
- Click to open rate (CTOR) = clicks ÷ unique opens. It isolates how persuasive the message was for the people who actually saw it.
- A high CTR with a low CTOR means your subject line is carrying a weak email. A low CTR with a high CTOR means almost nobody is opening, so fix deliverability and subject lines first.
- Apple Mail Privacy Protection has inflated open counts since 2021, so treat CTOR as directional, not absolute — and lean on click-based and reply-based signals.
- Clean data underpins both metrics: bounces and spam traps suppress delivery and skew every rate. Verify your list before you trust any benchmark.
What is the difference between click to open rate and click through rate?#
The short answer: CTR measures your whole campaign, CTOR measures only the email itself.
Think of an email campaign like a retail store. CTR is total sales divided by everyone who walked past the window — it bundles foot traffic, the window display, and the in-store experience into one figure. CTOR is sales divided by the people who actually walked through the door. The first tells you how the campaign performed overall; the second tells you whether your store layout converts the visitors you earned.
Technically, both are click metrics with different denominators:
- Click through rate (CTR) —
(unique clicks ÷ emails delivered) × 100. If 10,000 emails land and 200 people click, your CTR is 2%. - Click to open rate (CTOR) —
(unique clicks ÷ unique opens) × 100. If 2,000 of those 10,000 recipients opened and 200 clicked, your CTOR is 10%. - Open rate —
(unique opens ÷ emails delivered) × 100. The bridge metric that connects the two above. - Delivered — sends minus hard and soft bounces. This is the denominator CTR depends on, which is why list hygiene quietly controls the number.
Same 200 clicks, two completely different stories: a 2% CTR sounds mediocre, while a 10% CTOR is healthy. Neither is wrong — they answer different questions.
How do you calculate CTOR and CTR correctly?#
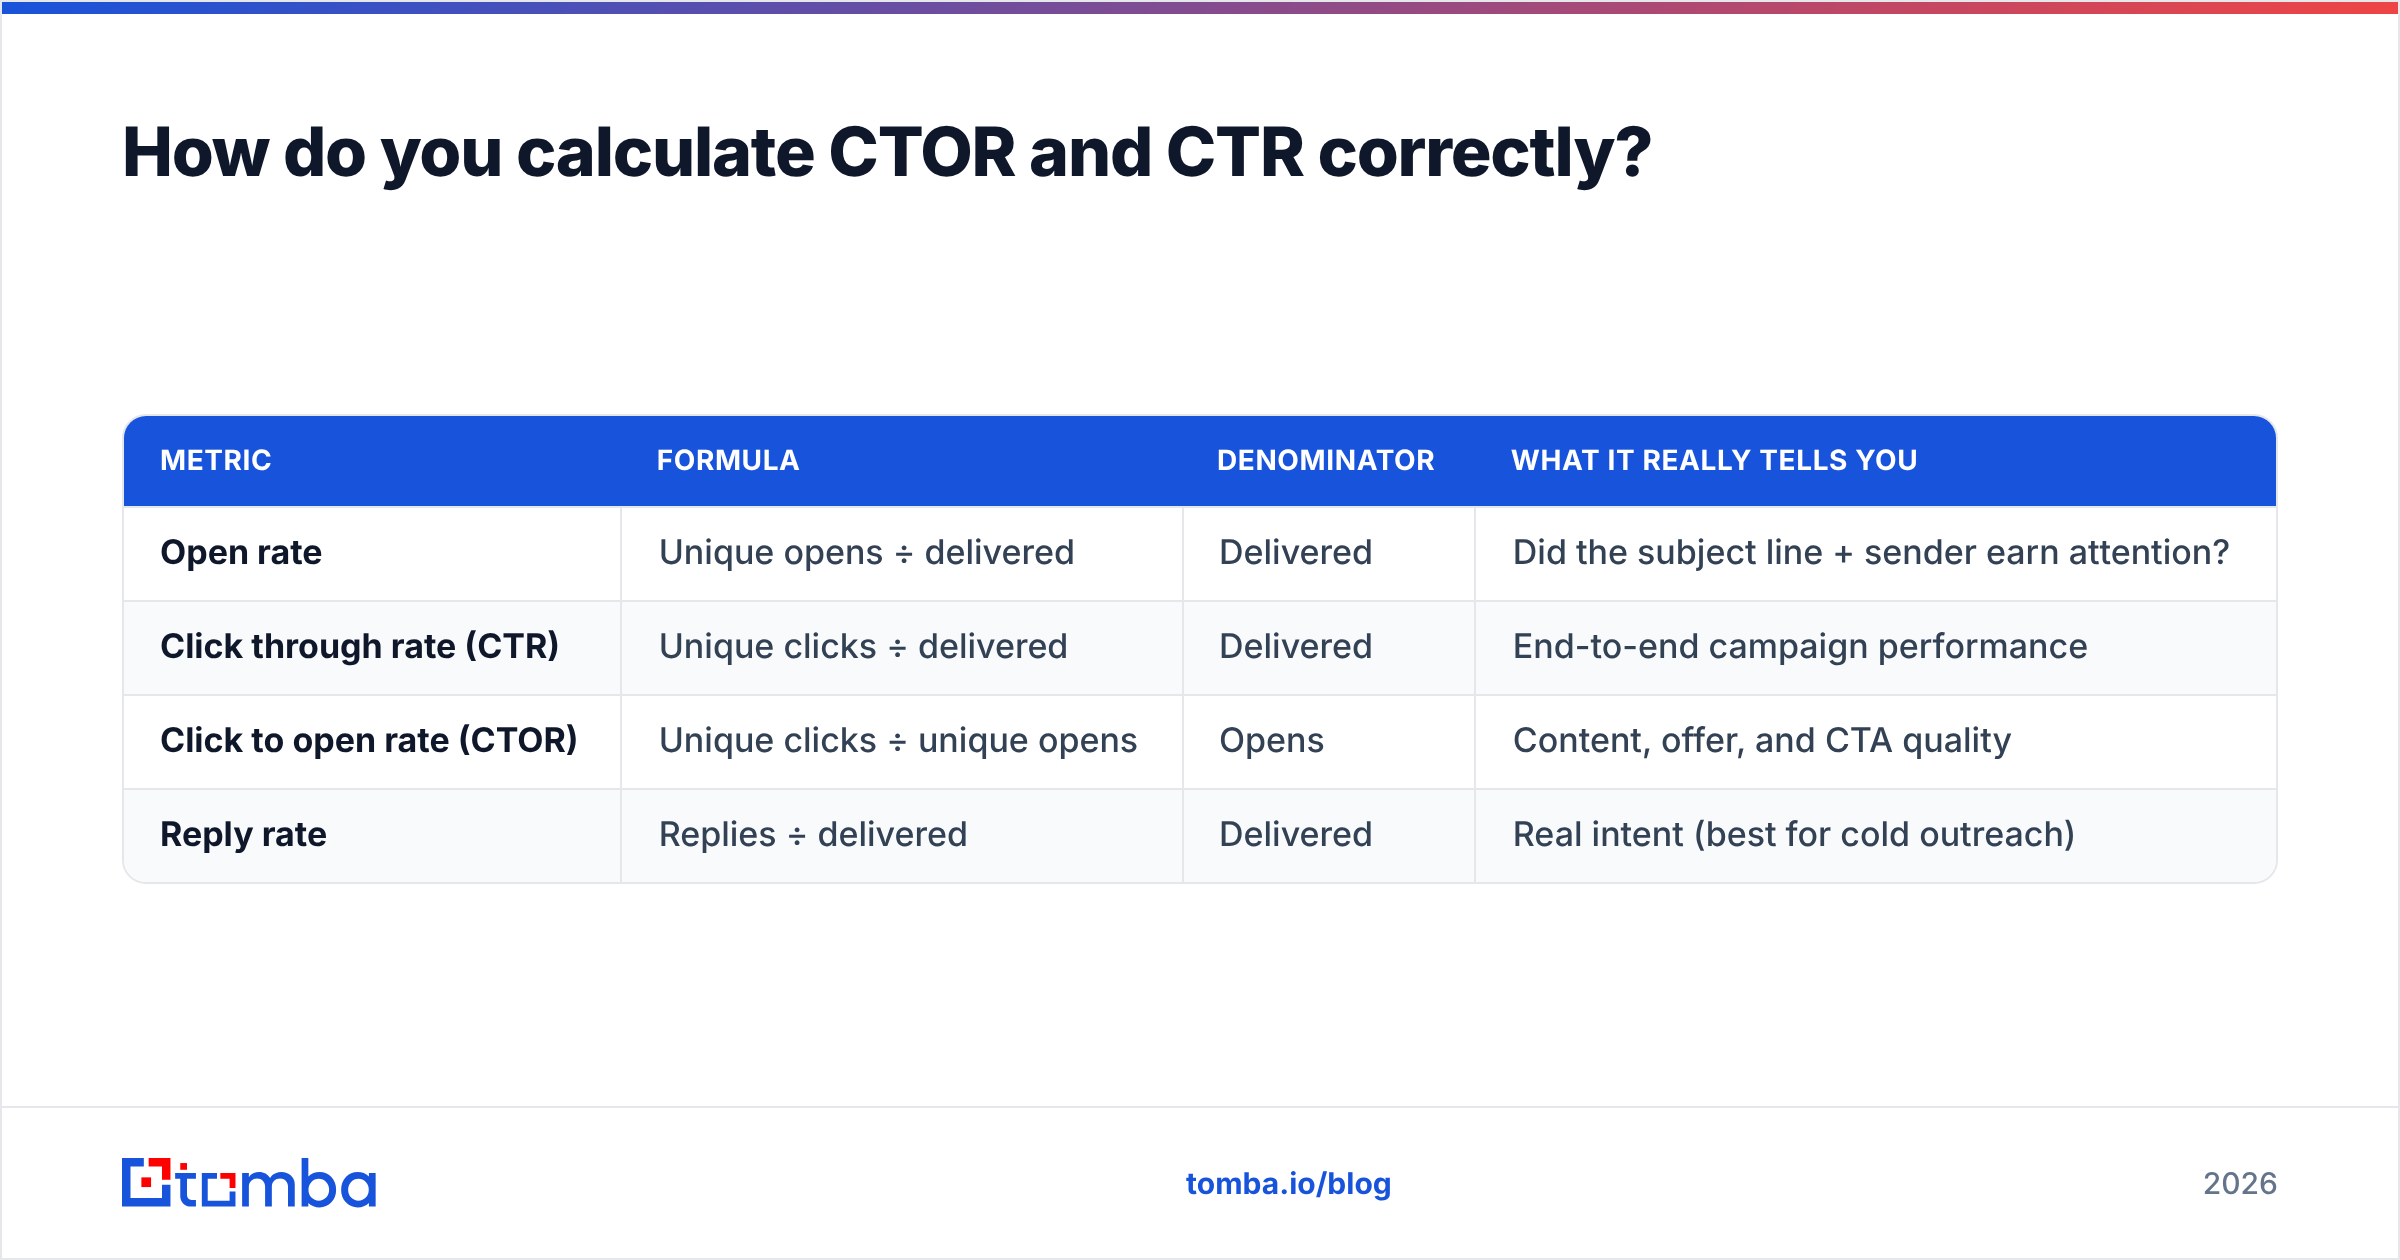
Get the denominators right and the rest follows. The most common mistake is mixing "sent" with "delivered." Always divide by delivered, because emails that bounced never had a chance to be opened or clicked.
| Metric | Formula | Denominator | What it really tells you |
|---|---|---|---|
| Open rate | Unique opens ÷ delivered | Delivered | Did the subject line + sender earn attention? |
| Click through rate (CTR) | Unique clicks ÷ delivered | Delivered | End-to-end campaign performance |
| Click to open rate (CTOR) | Unique clicks ÷ unique opens | Opens | Content, offer, and CTA quality |
| Reply rate | Replies ÷ delivered | Delivered | Real intent (best for cold outreach) |
Use unique opens and unique clicks, not total events. A single recipient who clicks five times should count once, or your rates inflate and you make decisions on noise. Most platforms default to unique counts, but exported raw logs often do not — check before you build a dashboard on top of them.
One more nuance for 2026: Apple's Mail Privacy Protection (MPP) pre-loads images, which fires an "open" even when nobody read anything. That inflates your open denominator, which pushes CTOR artificially down. So a falling CTOR may reflect privacy tooling, not weaker copy. This is why mature teams cross-check CTOR against click-only and reply-only metrics rather than trusting it in isolation. HubSpot's email marketing benchmarks and the broader click-through rate literature both flag the same measurement drift.
Click to open rate vs click through rate: which should you optimize first?#
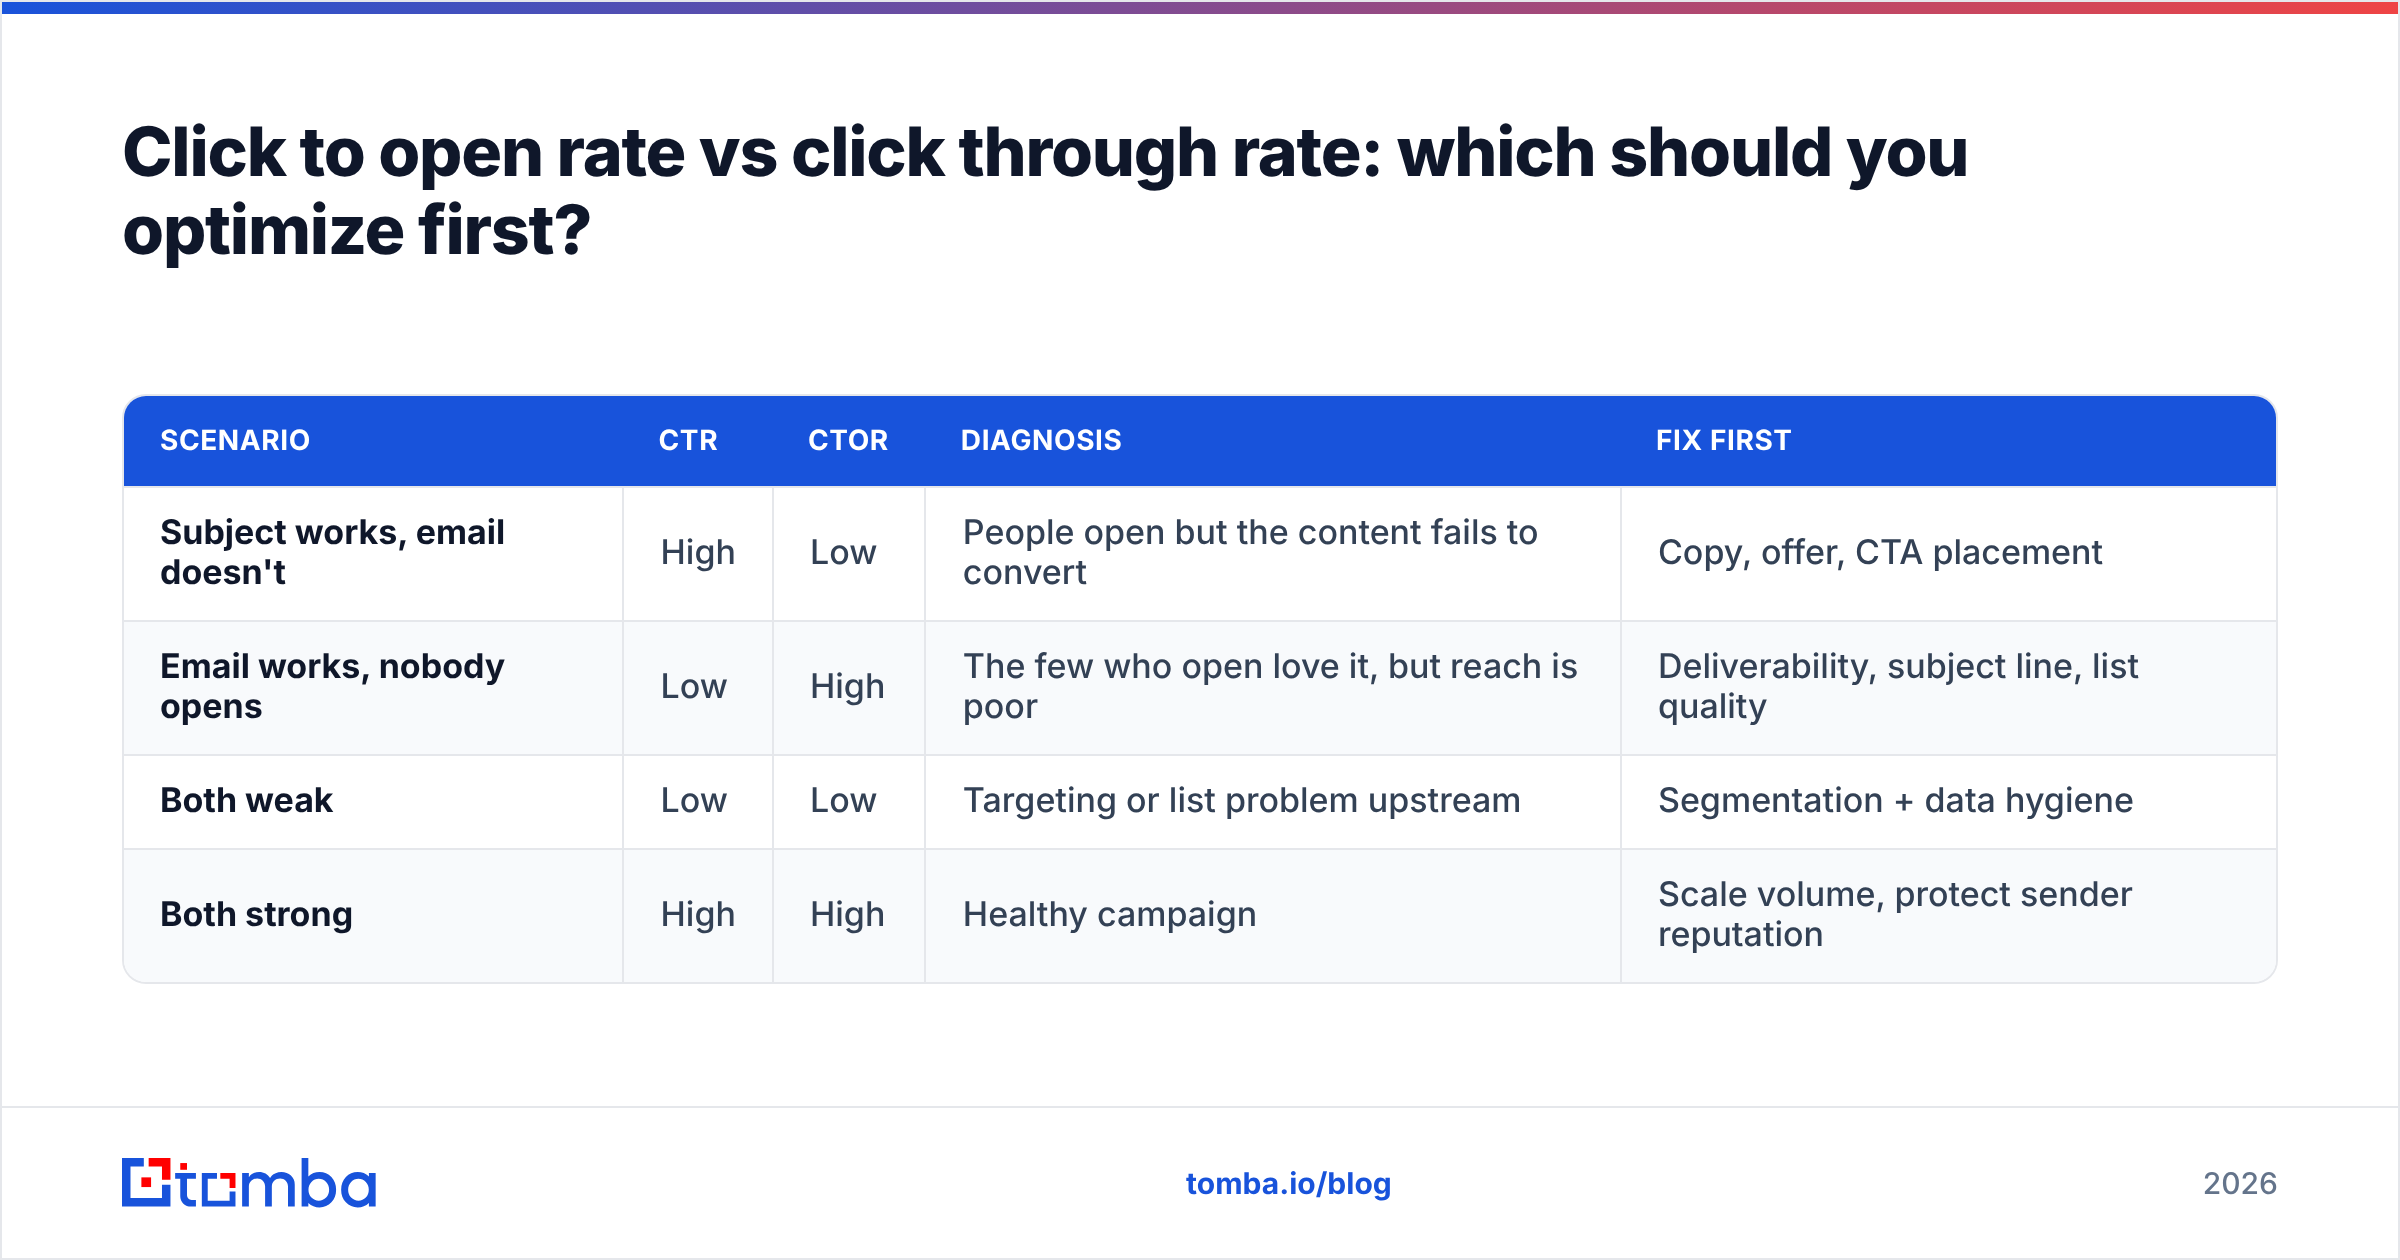
Optimize the metric that matches your bottleneck — and the two rates together tell you where the bottleneck is.
| Scenario | CTR | CTOR | Diagnosis | Fix first |
|---|---|---|---|---|
| Subject works, email doesn't | High | Low | People open but the content fails to convert | Copy, offer, CTA placement |
| Email works, nobody opens | Low | High | The few who open love it, but reach is poor | Deliverability, subject line, list quality |
| Both weak | Low | Low | Targeting or list problem upstream | Segmentation + data hygiene |
| Both strong | High | High | Healthy campaign | Scale volume, protect sender reputation |
Read the table as a decision tree. If your CTOR is strong but CTR is weak, you do not have a copy problem — you have a reach problem. Spending another week A/B testing button colors is wasted effort when the real issue is that only 12% of your list opened. Go fix email deliverability, tighten your subject lines, and prune dead addresses.
If your CTR looks fine but CTOR is low, your subject line is writing checks your body copy can't cash. You are buying opens with curiosity and losing them inside the email. That is a content and offer problem, full stop.
This diagnostic split is the entire reason to track both. A single blended number hides which lever to pull.
What are good CTOR and CTR benchmarks in 2026?#
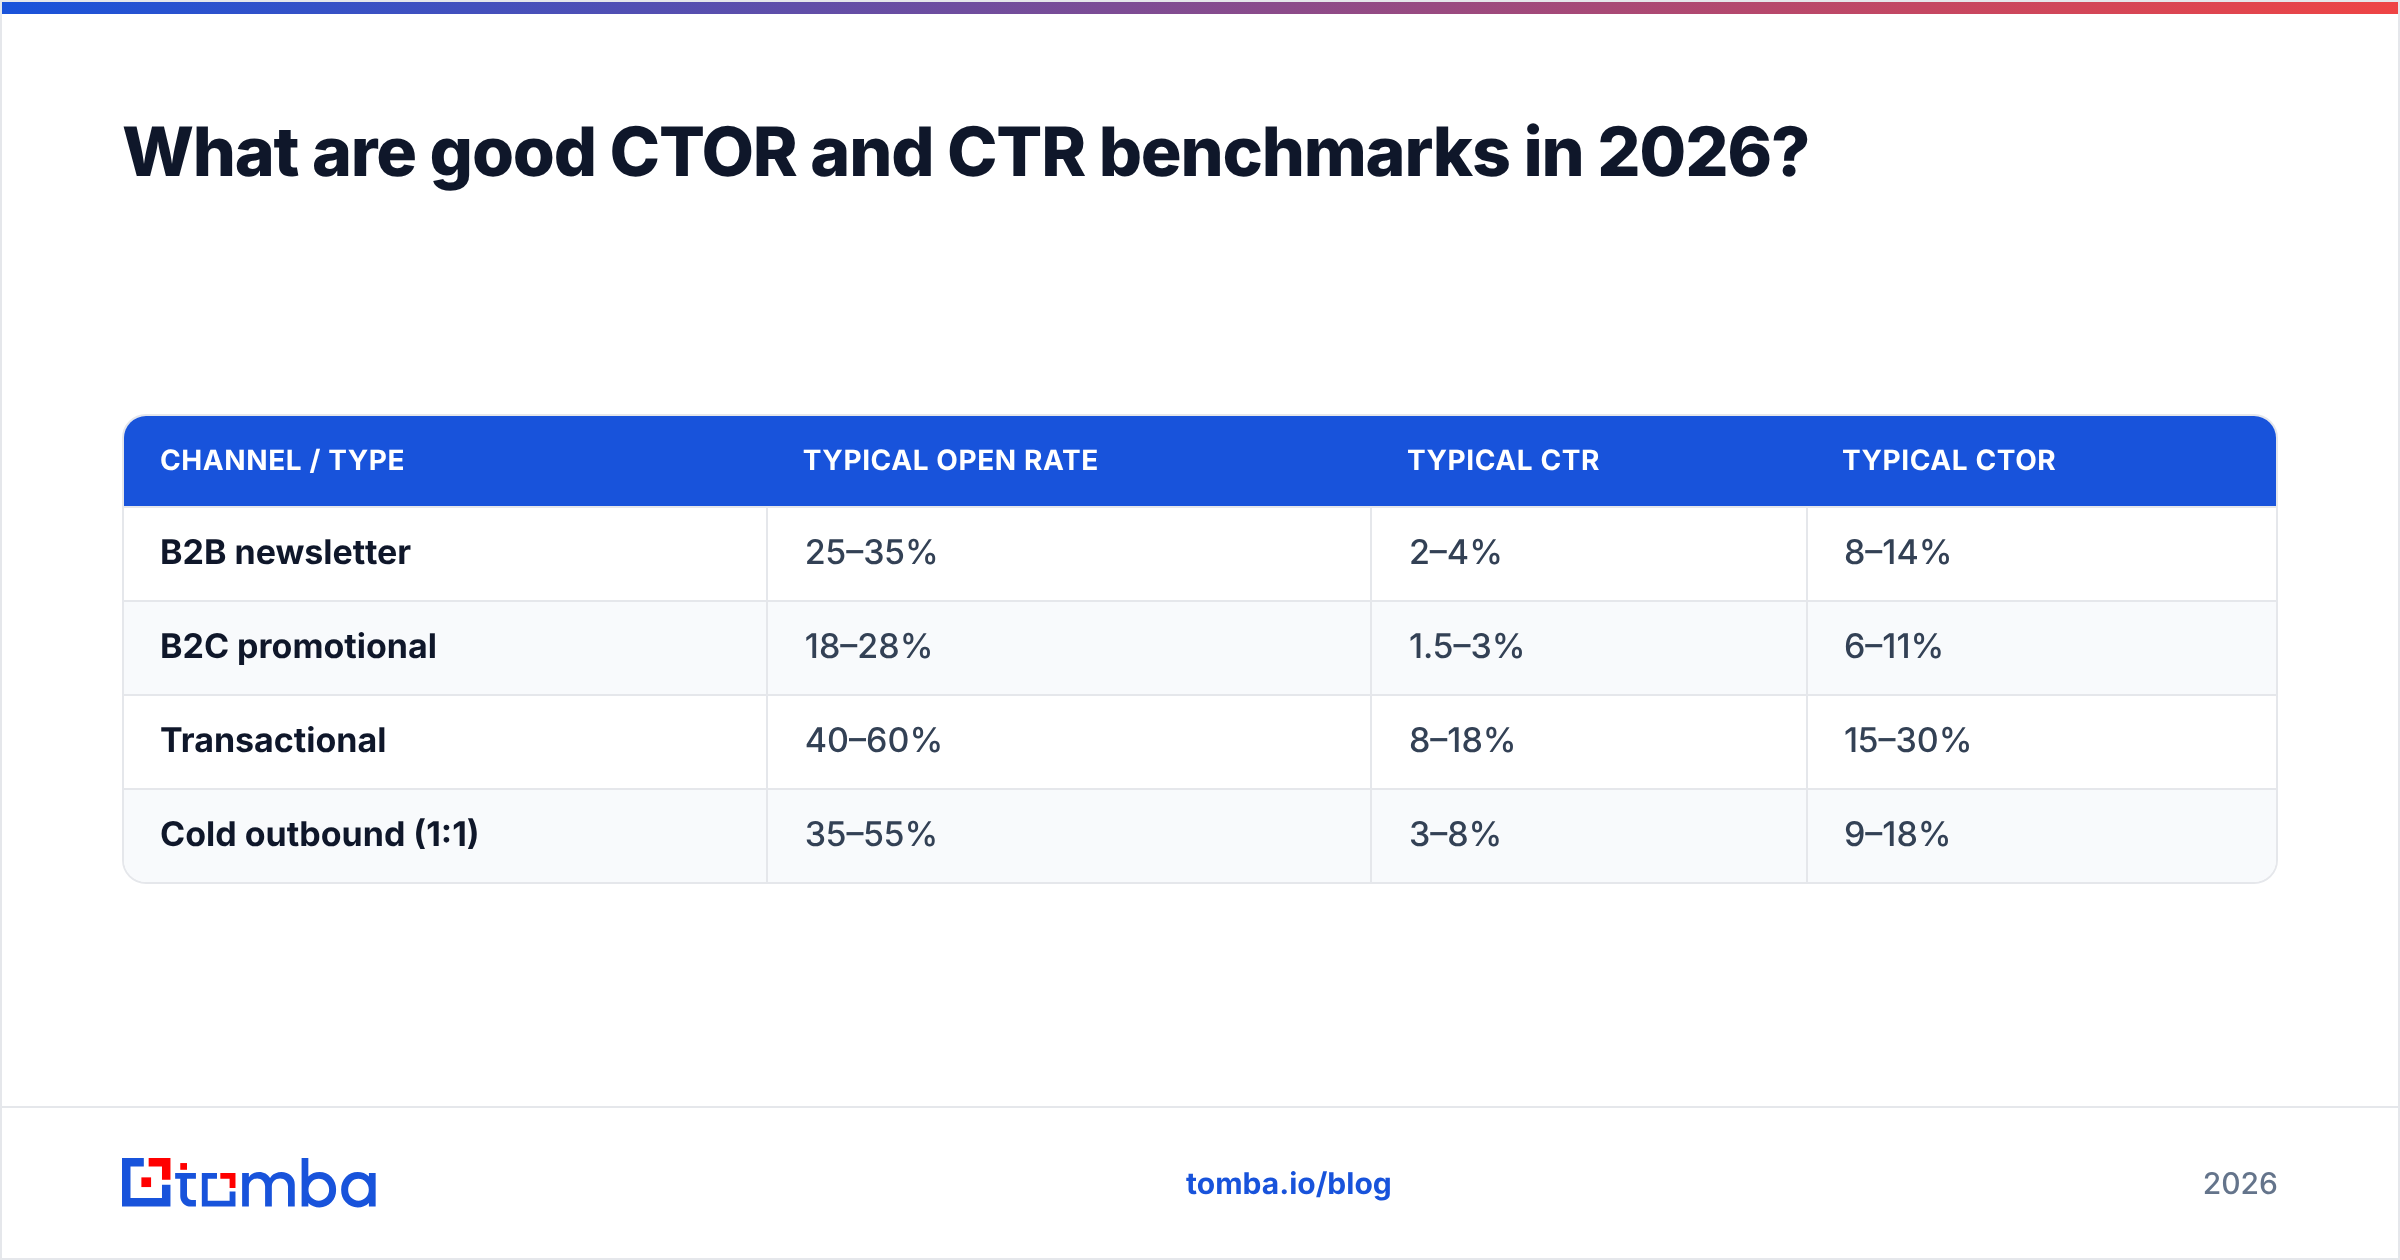
Benchmarks vary wildly by industry, list type, and whether you are sending marketing newsletters or one-to-one outbound. Use these as rough goalposts, not targets carved in stone.
| Channel / type | Typical open rate | Typical CTR | Typical CTOR |
|---|---|---|---|
| B2B newsletter | 25–35% | 2–4% | 8–14% |
| B2C promotional | 18–28% | 1.5–3% | 6–11% |
| Transactional | 40–60% | 8–18% | 15–30% |
| Cold outbound (1:1) | 35–55% | 3–8% | 9–18% |
Two warnings. First, post-MPP open rates are inflated, so the "open" columns above run higher than the genuine human-read rate — which mechanically depresses reported CTOR. Second, cold outbound should weight reply rate above CTR, because a click without a reply rarely advances a deal. For newsletters and nurture, clicks are the conversion event; for outbound, the reply is. Mailchimp publishes regularly updated email benchmarks by industry if you want a finer-grained comparison for your vertical.
How do you improve click to open rate?#
CTOR rewards the message, so every fix here happens inside the email after the open.
- Match the body to the subject's promise. The fastest CTOR killer is a bait-and-switch subject line. If the subject teases a benchmark report, the first sentence should deliver it, not warm up for three paragraphs.
- One primary call to action. Competing CTAs split attention and lower clicks. Lead with a single, obvious action; demote everything else to a text link.
- Put the CTA above the fold. Many readers skim on mobile and never scroll. A button in the first screen-height consistently outperforms one buried at the bottom.
- Write for skimmers. Short paragraphs, bold leads, and one clear benefit per block. Walls of text suppress clicks even when the offer is strong.
- Segment by intent. A relevant offer to a tight segment beats a generic blast. Personalization that reflects role, industry, or past behavior raises CTOR more than any button-color test.
If your CTOR is healthy but you are not reaching enough of the right people, the constraint is upstream in your list. That is where contact data quality starts to dominate the numbers.
How does data quality change both metrics?#
Bad data quietly distorts every rate you report. Bounces shrink your delivered count, spam traps wreck sender reputation, and stale contacts never open — dragging both CTR and CTOR toward the floor regardless of how good your copy is.
Here is the chain reaction:
- Invalid addresses bounce, which lowers delivered volume and signals to mailbox providers that you are not maintaining your list.
- Damaged sender reputation routes more of your good mail to spam, suppressing opens — so even your engaged segment looks unengaged.
- Suppressed opens deflate CTR (fewer of the delivered actually see the email) and distort CTOR (the opener pool is no longer representative).
The fix is unglamorous but decisive: verify before you send. Run new contacts through an email verifier to drop hard bounces and risky addresses before they ever touch your reputation. When you are building lists from scratch, sourcing accurate addresses with an email finder means fewer guesses, fewer bounces, and a delivered count you can actually trust. Catch-all domains are their own trap — a catch-all verifier tells you which "valid" addresses are really just accept-all servers that hide bounces until after you send.
Clean data does not directly write better copy, but it removes the noise that makes your CTOR and CTR meaningless. You cannot diagnose a content problem on a list that is 30% dead. The teams that win on both metrics treat verification as step zero, not an afterthought — and the difference in reported rates is not subtle. If you are weighing tooling, the Tomba pricing page lays out where verification and finding sit across the Free, Starter, Growth, and Pro tiers.
CTOR vs CTR vs conversion rate: where does each fit?#
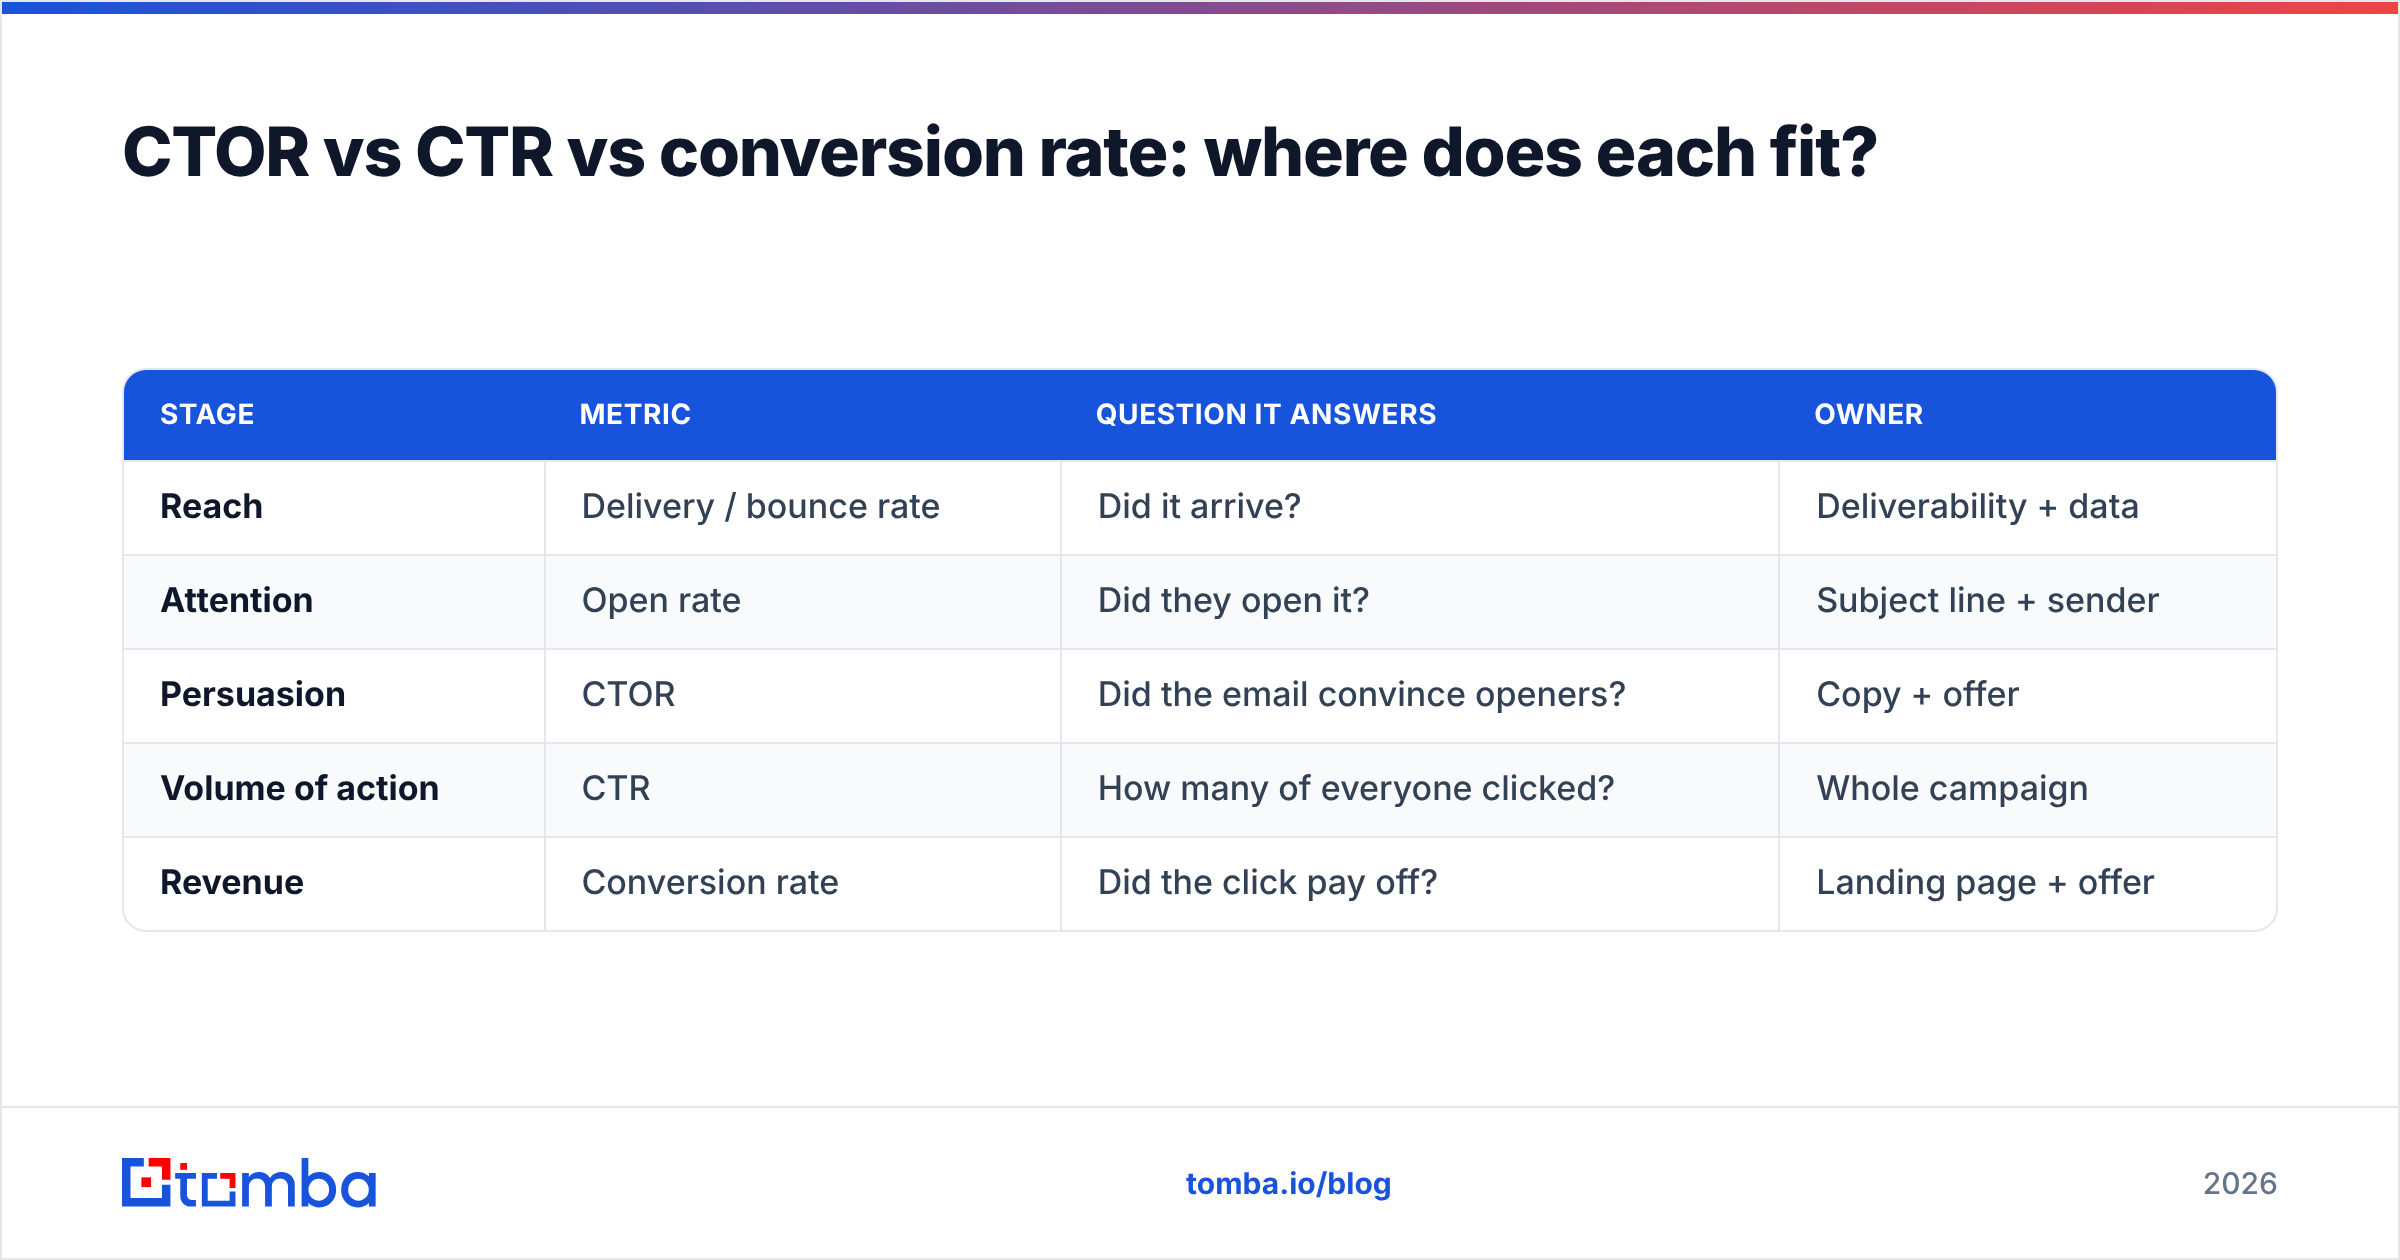
Each metric owns one stage of the funnel. Stacking them gives you a clean read on exactly where engagement leaks.
| Stage | Metric | Question it answers | Owner |
|---|---|---|---|
| Reach | Delivery / bounce rate | Did it arrive? | Deliverability + data |
| Attention | Open rate | Did they open it? | Subject line + sender |
| Persuasion | CTOR | Did the email convince openers? | Copy + offer |
| Volume of action | CTR | How many of everyone clicked? | Whole campaign |
| Revenue | Conversion rate | Did the click pay off? | Landing page + offer |
Notice CTOR and CTR sit side by side but answer different questions. CTOR is your quality signal; CTR is your scale signal. Conversion rate then tells you whether the click was worth anything. A campaign can ace CTOR and CTR yet convert poorly if the landing page breaks the promise — which is why you never read email metrics in a vacuum. Pair them with downstream response rate and pipeline data to see the full picture.
For cold outbound specifically, the hierarchy inverts: reply rate and meetings booked outrank clicks, because a click is a weak proxy for intent when you are trying to start a conversation rather than drive a purchase.
How do you build a reporting view that uses both?#
Stop reporting a single headline number. Build a five-column view — delivered, open rate, CTR, CTOR, and a downstream action (replies or conversions) — and read it left to right. The column where the number drops off a cliff is your bottleneck for the week.
A practical cadence:
- Weekly: scan CTR and CTOR side by side per campaign. Divergence between them is your assignment list.
- Monthly: trend both against your own baseline, not industry averages — your list and offer are unique, so your past self is the fairest benchmark.
- Per send: confirm delivered volume hasn't dropped. A sudden delivery dip almost always traces back to data hygiene or a reputation hit, and it will silently corrupt every rate above it.
The goal is not to chase one perfect number. It is to know, at a glance, whether this week's problem lives in your data, your subject line, your copy, or your landing page — and to fix the right one.
The bottom line#
CTR tells you how the whole campaign did; CTOR tells you how the email did. You need both because they point you to different fixes — reach and deliverability on one side, copy and offer on the other. And both rest on a foundation of clean, deliverable contact data, because every rate you compute divides by a number that bad data quietly corrupts.
Before you spend another sprint optimizing copy, make sure the list underneath it is real. Start with the Tomba Email Finder to source accurate, verified business addresses, pair it with the verifier to strip out bounces, and watch your delivered count — and every metric built on top of it — finally tell the truth. The Free tier gives you 25 searches a month to test it against your own list before you commit.
Ready to find emails that actually work?
Join 150,000+ professionals who stopped guessing and started sending. Free credits on signup — no credit card required.
Get the Tomba newsletter
Practical outbound tactics and product updates — once every two weeks.
About the author