How to Measure Sales Coaching Effectiveness in 2026
Most sales coaching programs are measured by activity, not outcomes. Here are seven metrics, a 90-day measurement framework, and the coaching math that actually predicts quota attainment.
TL;DR — Here is how to measure sales coaching effectiveness without fooling yourself.
- Coaching hours logged is an input metric, not an effectiveness metric. It tells you a manager showed up. It does not tell you a rep improved.
- Measure effectiveness with a paired cohort: coached reps vs. a matched control group. Track win rate, ramp time, and stage conversion over 90 days.
- Four metric layers matter: behavior change (did the rep do the thing?), skill scores (did they do it well?), pipeline mechanics (did deals move?), and revenue outcomes (did quota attainment shift?).
- Lagging revenue metrics take 2-3 sales cycles to respond. Behavior and stage-conversion metrics respond in 2-4 weeks. Use those as your early-read signals.
- Bad data poisons the whole exercise. If your CRM contact records are stale, conversion metrics reflect list quality, not coaching quality.
Why Is It So Hard to Measure Sales Coaching Effectiveness?#
Because coaching is an indirect input to a noisy outcome. A rep closes a deal for a dozen reasons: territory, product fit, a competitor's outage, an inbound referral, luck. Coaching is one of those reasons. It is also the only one with no timestamp.
Think of it like a gym trainer. You can log every session, every set, every correction on form. But if you only measure body weight, you will conclude nothing worked. Weight is a lagging number. It also moves with sleep, diet, and water. You need to track the lift itself, the form quality, and the recovery rate. Only then does the scale tell you anything useful.
Sales coaching has the same shape. Most teams skip straight to the scale.
The problem is not theoretical. Gartner research on sales enablement finds that companies struggle to link enablement spend to revenue. The chain from cause to result is long, and the tracking is thin. Managers spend the hours. Nobody can prove the hours paid.
Here is what changes that. Stop asking "did coaching work?" Start asking a sharper question. Which behavior changed, in which reps, by how much, and against a similar group that got no coaching?
What Are the Four Layers of Sales Coaching Metrics?#
Every coaching metric sits in one of four layers. Mixing them is where measurement programs fall apart. A manager reports "12 coaching sessions this month" next to "win rate up 3 points" and implies a link that is not there.
- Layer 1 — Coaching inputs. Session count, session length, coverage ratio (share of reps coached this cycle), call reviews completed. These prove the program is running. They prove nothing about outcomes. Track them for compliance, not for ROI.
- Layer 2 — Behavior change. Did the rep actually change what they do? Measure discovery questions per call, talk-to-listen ratio, multithreading rate (contacts engaged per opportunity), and follow-up cadence. These move within 2-4 weeks. They are your earliest honest signal.
The next two layers are the ones leadership asks about. They are also the slowest to move.
- Layer 3 — Pipeline mechanics. Stage-to-stage conversion rate, average deal cycle length, pipeline coverage ratio, slipped-deal share. These respond within one sales cycle. They connect behavior to deal movement.
- Layer 4 — Revenue outcomes. Win rate, quota attainment, average contract value, ramp time to first closed deal, rep retention. Leadership cares about these. They also lag coaching by 2-3 full sales cycles.
- Layer 5 — Durability. Does the gain hold 90 days after the coaching stops? A skill that fades the moment the manager looks away was compliance, not capability.
The discipline is simple. Read Layer 2 weekly, Layer 3 monthly, Layer 4 quarterly. If Layer 2 never moves, stop waiting for Layer 4. The coaching is not landing.
Which Sales Coaching Metrics Actually Predict Quota Attainment?#
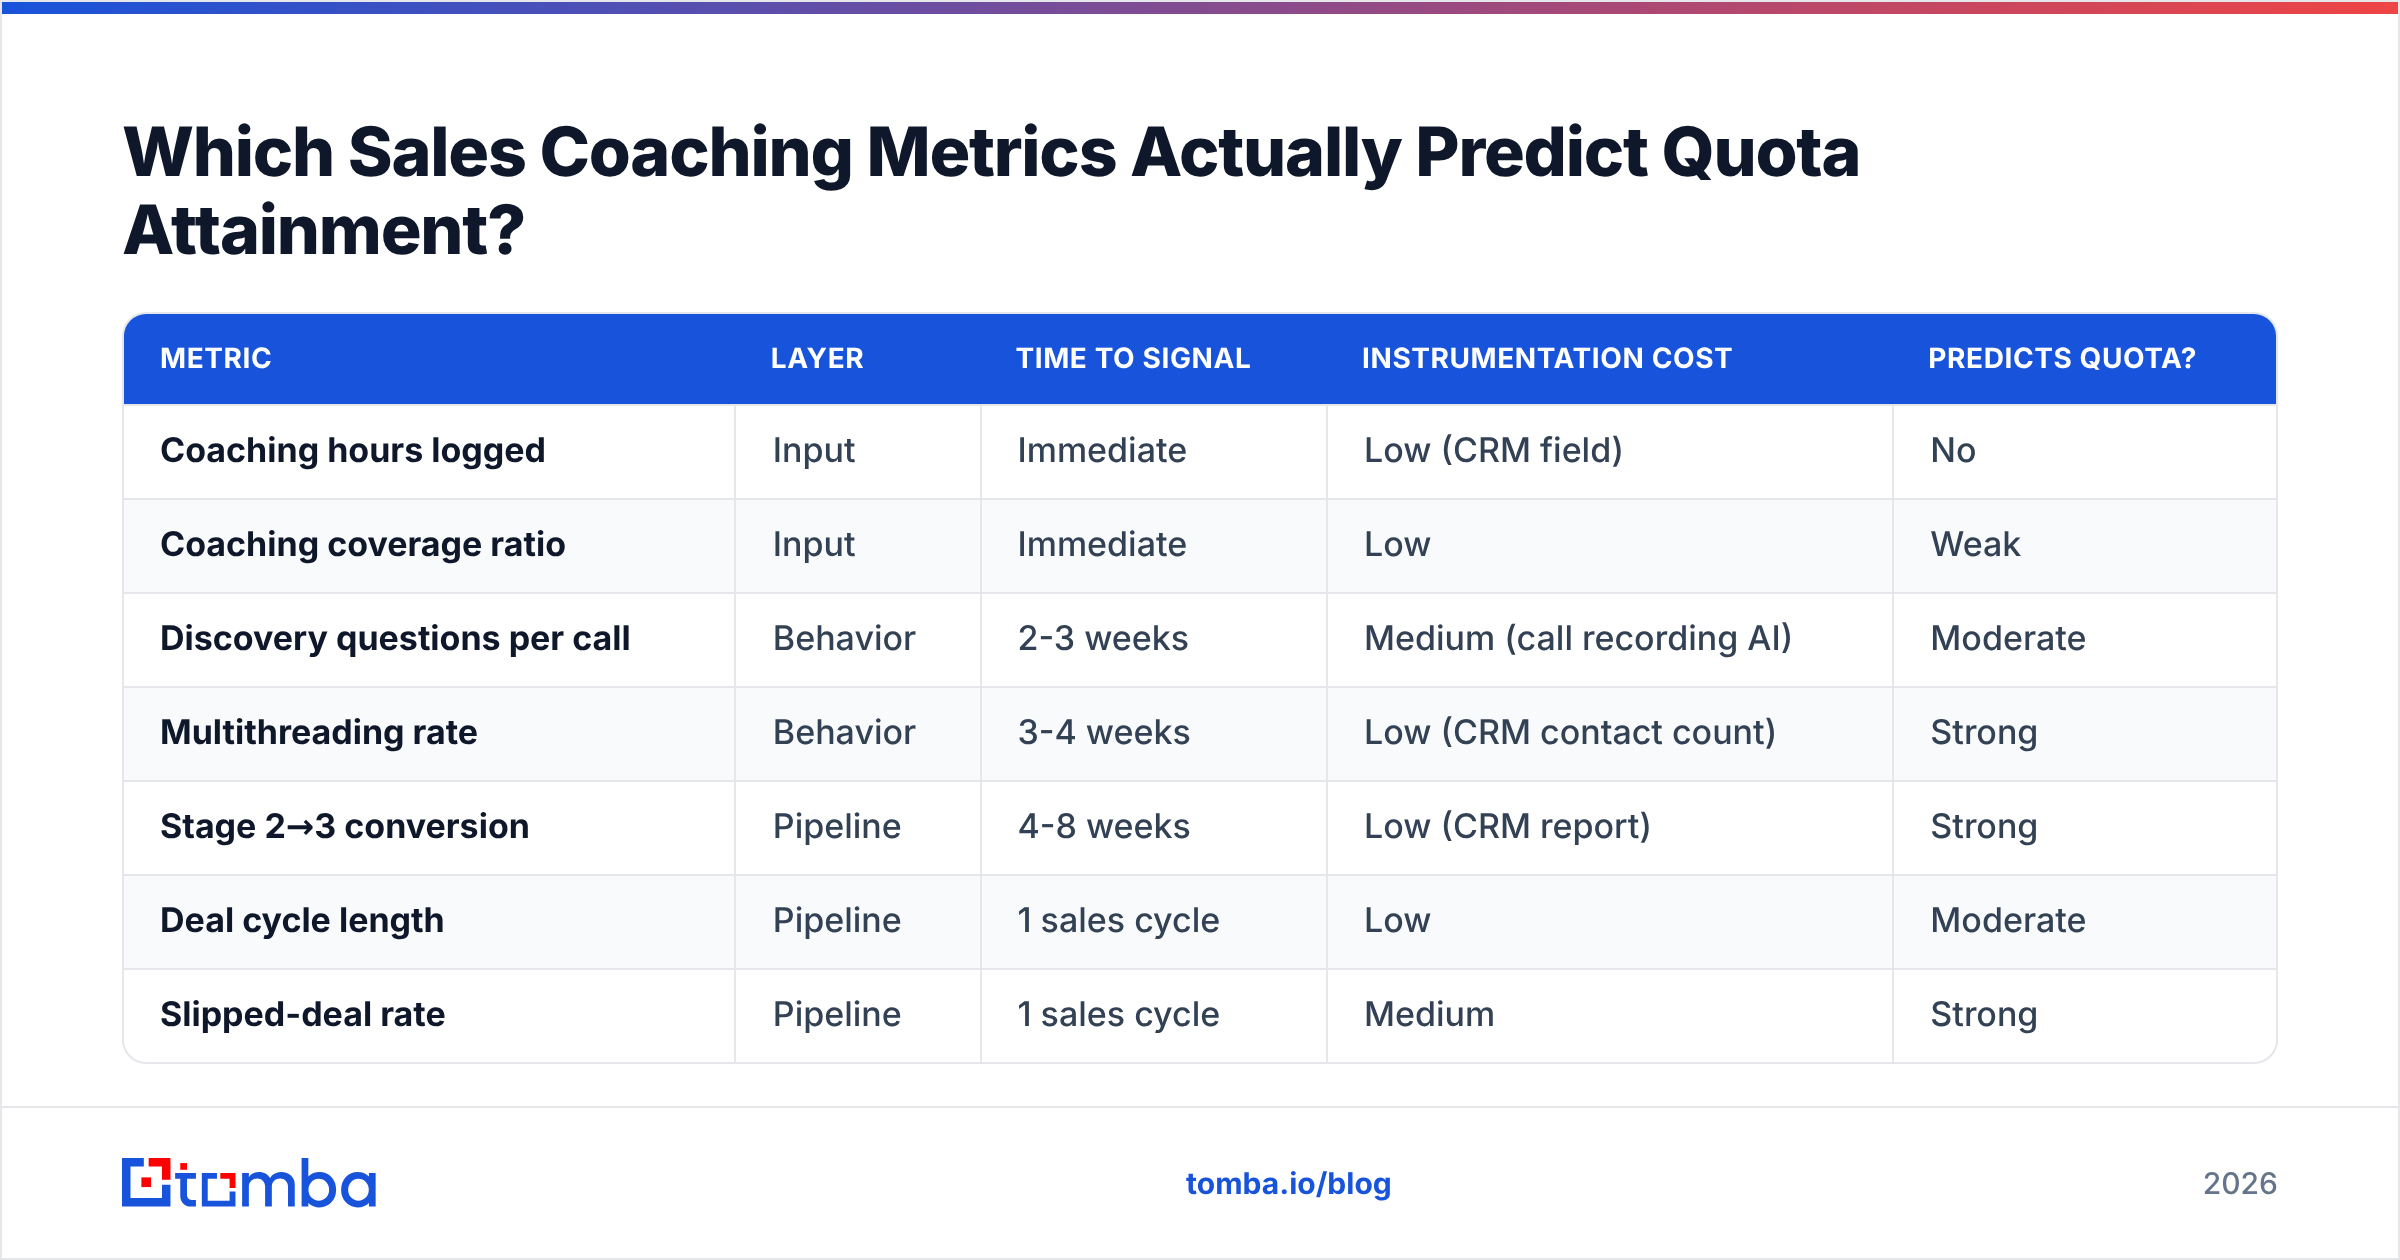
Not all metrics carry the same weight. Here is how the common ones compare on setup cost and on what they really tell you.
| Metric | Layer | Time to signal | Instrumentation cost | Predicts quota? |
|---|---|---|---|---|
| Coaching hours logged | Input | Immediate | Low (CRM field) | No |
| Coaching coverage ratio | Input | Immediate | Low | Weak |
| Discovery questions per call | Behavior | 2-3 weeks | Medium (call recording AI) | Moderate |
| Multithreading rate | Behavior | 3-4 weeks | Low (CRM contact count) | Strong |
| Stage 2→3 conversion | Pipeline | 4-8 weeks | Low (CRM report) | Strong |
| Deal cycle length | Pipeline | 1 sales cycle | Low | Moderate |
| Slipped-deal rate | Pipeline | 1 sales cycle | Medium | Strong |
| Win rate delta vs. control | Revenue | 2-3 cycles | Medium | Direct |
| Ramp time to first close | Revenue | 1-2 quarters | Medium | Direct |
| 90-day skill retention score | Durability | 2 quarters | High (re-scoring) | Strong |
Two rows deserve a closer look.
Multithreading rate is the count of distinct contacts a rep engages per opportunity. It is the highest-leverage, lowest-cost behavior metric most teams ignore, and it is a simple count in your CRM.
Coaching that lifts multithreading from 1.4 to 2.8 contacts per deal tends to show up in win rate one cycle later. Single-threaded deals die when the champion leaves. And if your reps cannot find the other stakeholders, the coaching conversation is moot. That is a data problem. A domain search across the account fixes it faster than any role-play.
Slipped-deal rate counts deals that push their close date at least once. It is the best early warning that coaching on qualification is not landing. It moves fast, and it is brutally honest.
How Do You Set Up a Control Group for Coaching Measurement?#
This step separates real measurement from storytelling. Without a comparison group, every gain gets credited to coaching and every dip gets blamed on the market.
The paired-cohort method — setup:
- Match on baseline, not on preference. Pick pairs of reps with similar trailing-two-quarter quota attainment, similar tenure, and similar territory quality. Do not let managers volunteer their favorites into the coached group. That is selection bias, and it will inflate your results by double digits.
- Coach cohort A, hold cohort B on standard management. Cohort B still gets normal pipeline reviews and deal help. They just do not get the structured coaching program. Nobody loses support here. You are staggering a rollout, not withholding help.
- Freeze the coaching content. If the program changes mid-measurement, you are measuring noise. Lock the curriculum for one full window.
And then the run:
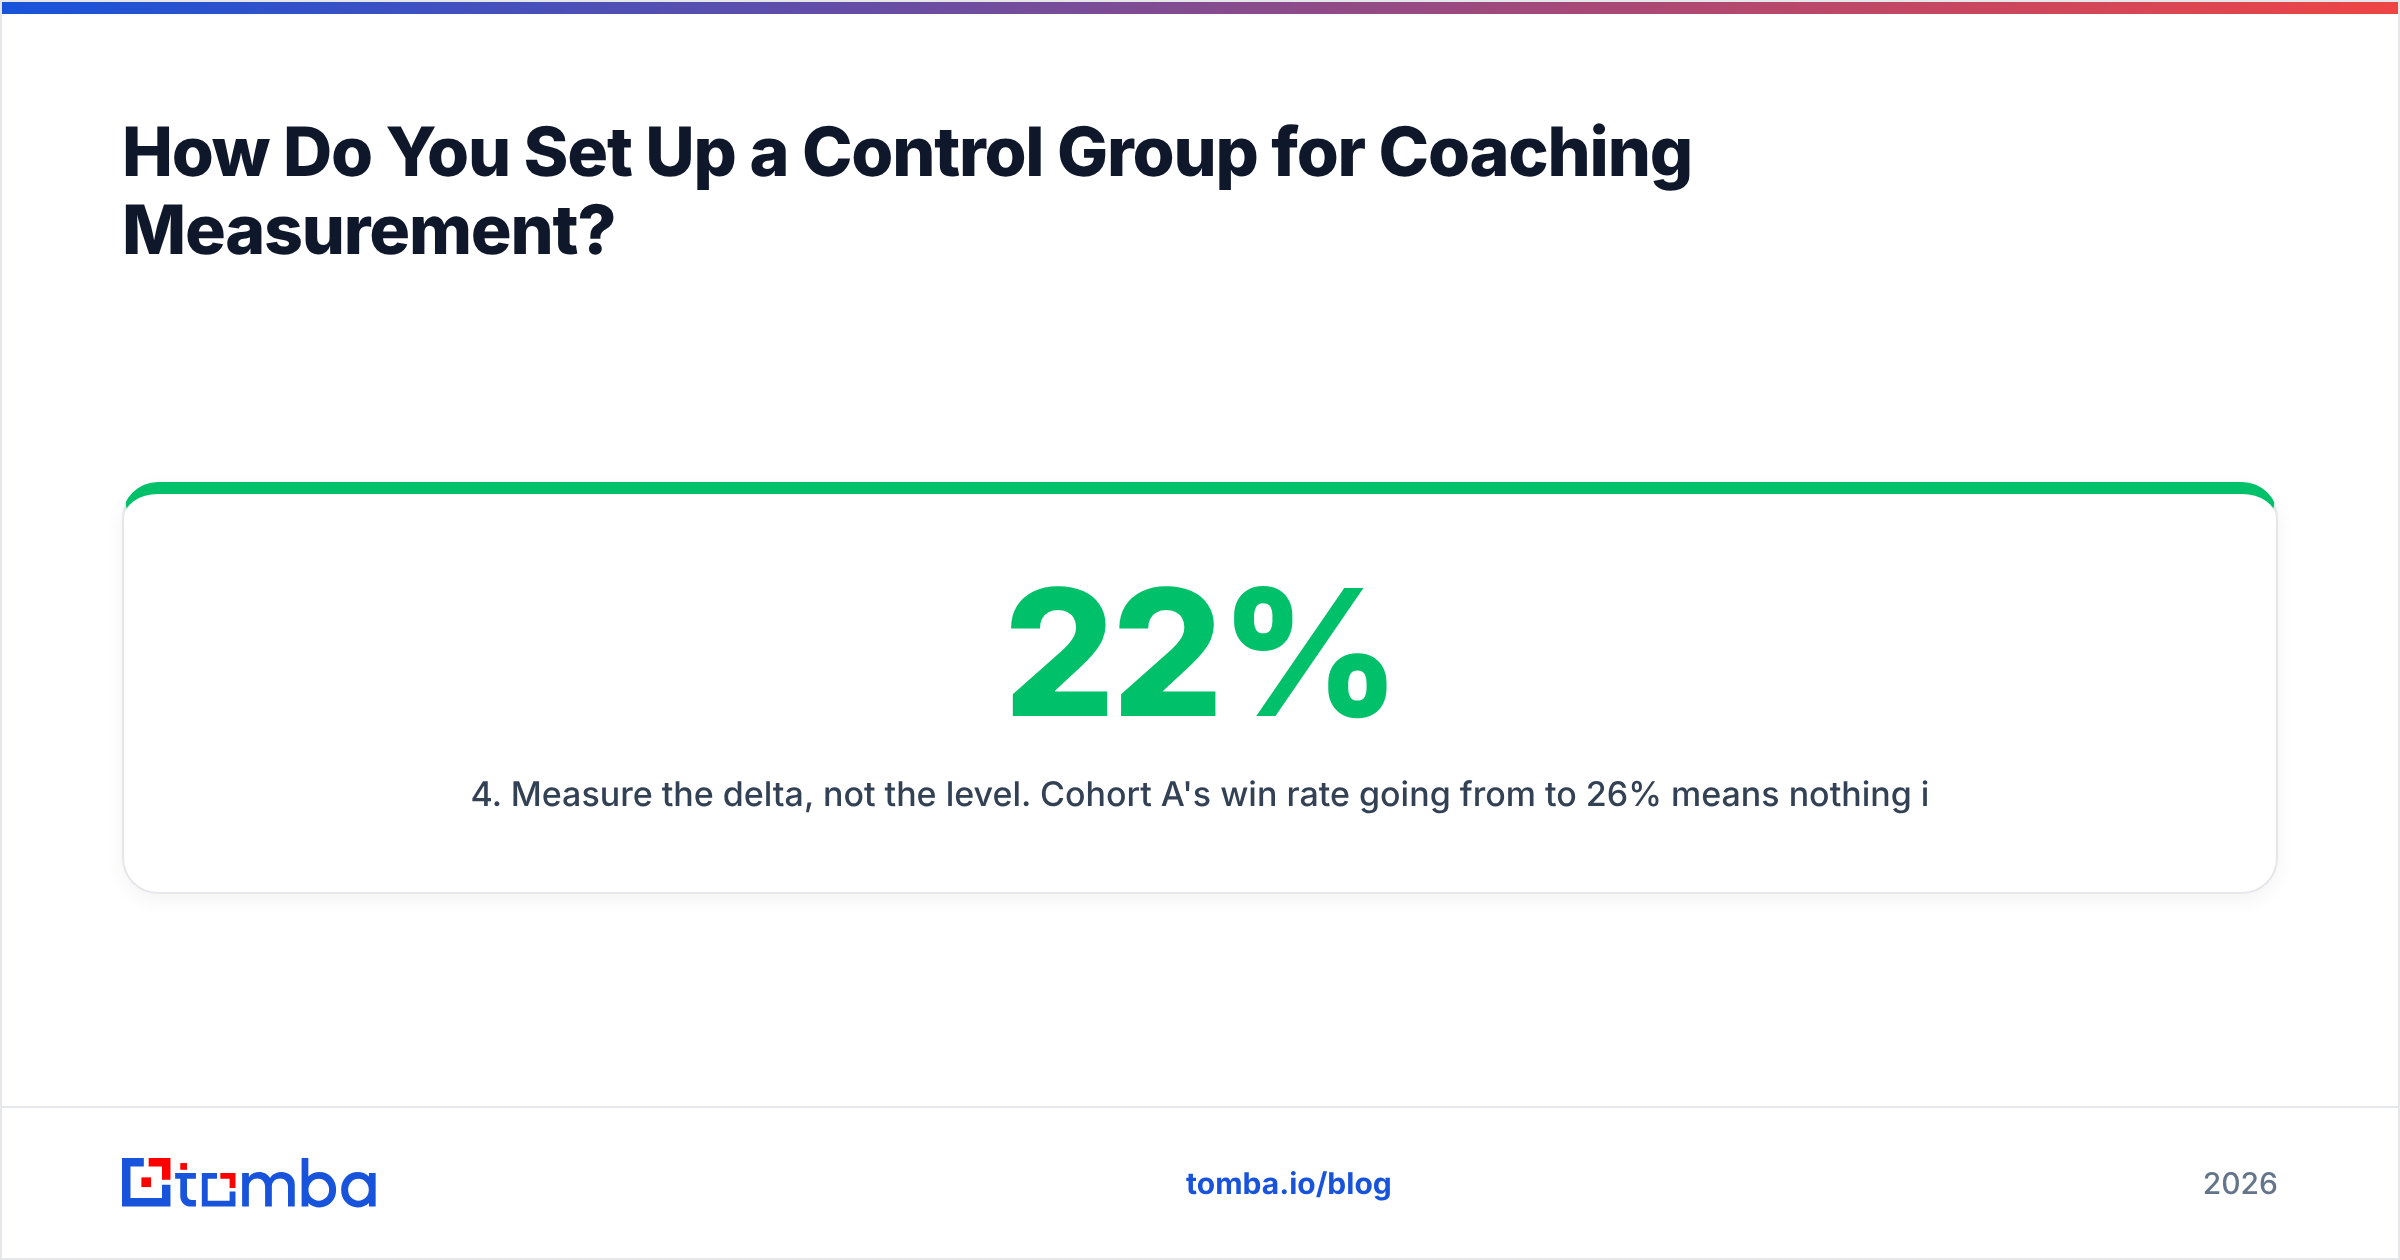
- Measure the delta, not the level. Cohort A's win rate going from 22% to 26% means nothing if cohort B went from 21% to 25%. That is a market tailwind, not coaching. The number you report is the difference in differences: +4 points minus +4 points equals zero coaching effect.
- Run for at least two sales cycles. One cycle sits inside the noise band for most B2B teams under 40 reps.
- Swap the cohorts and re-run. If the effect flips when you swap who gets coached, your first result was a territory artifact.
The difference-in-differences math is the whole game. Most coaching ROI decks report cohort A's raw improvement and stop there. That number is almost always wrong, and almost always flattering.
What Does a 90-Day Coaching Measurement Framework Look Like?#
Here is a concrete sequence you can run next quarter.
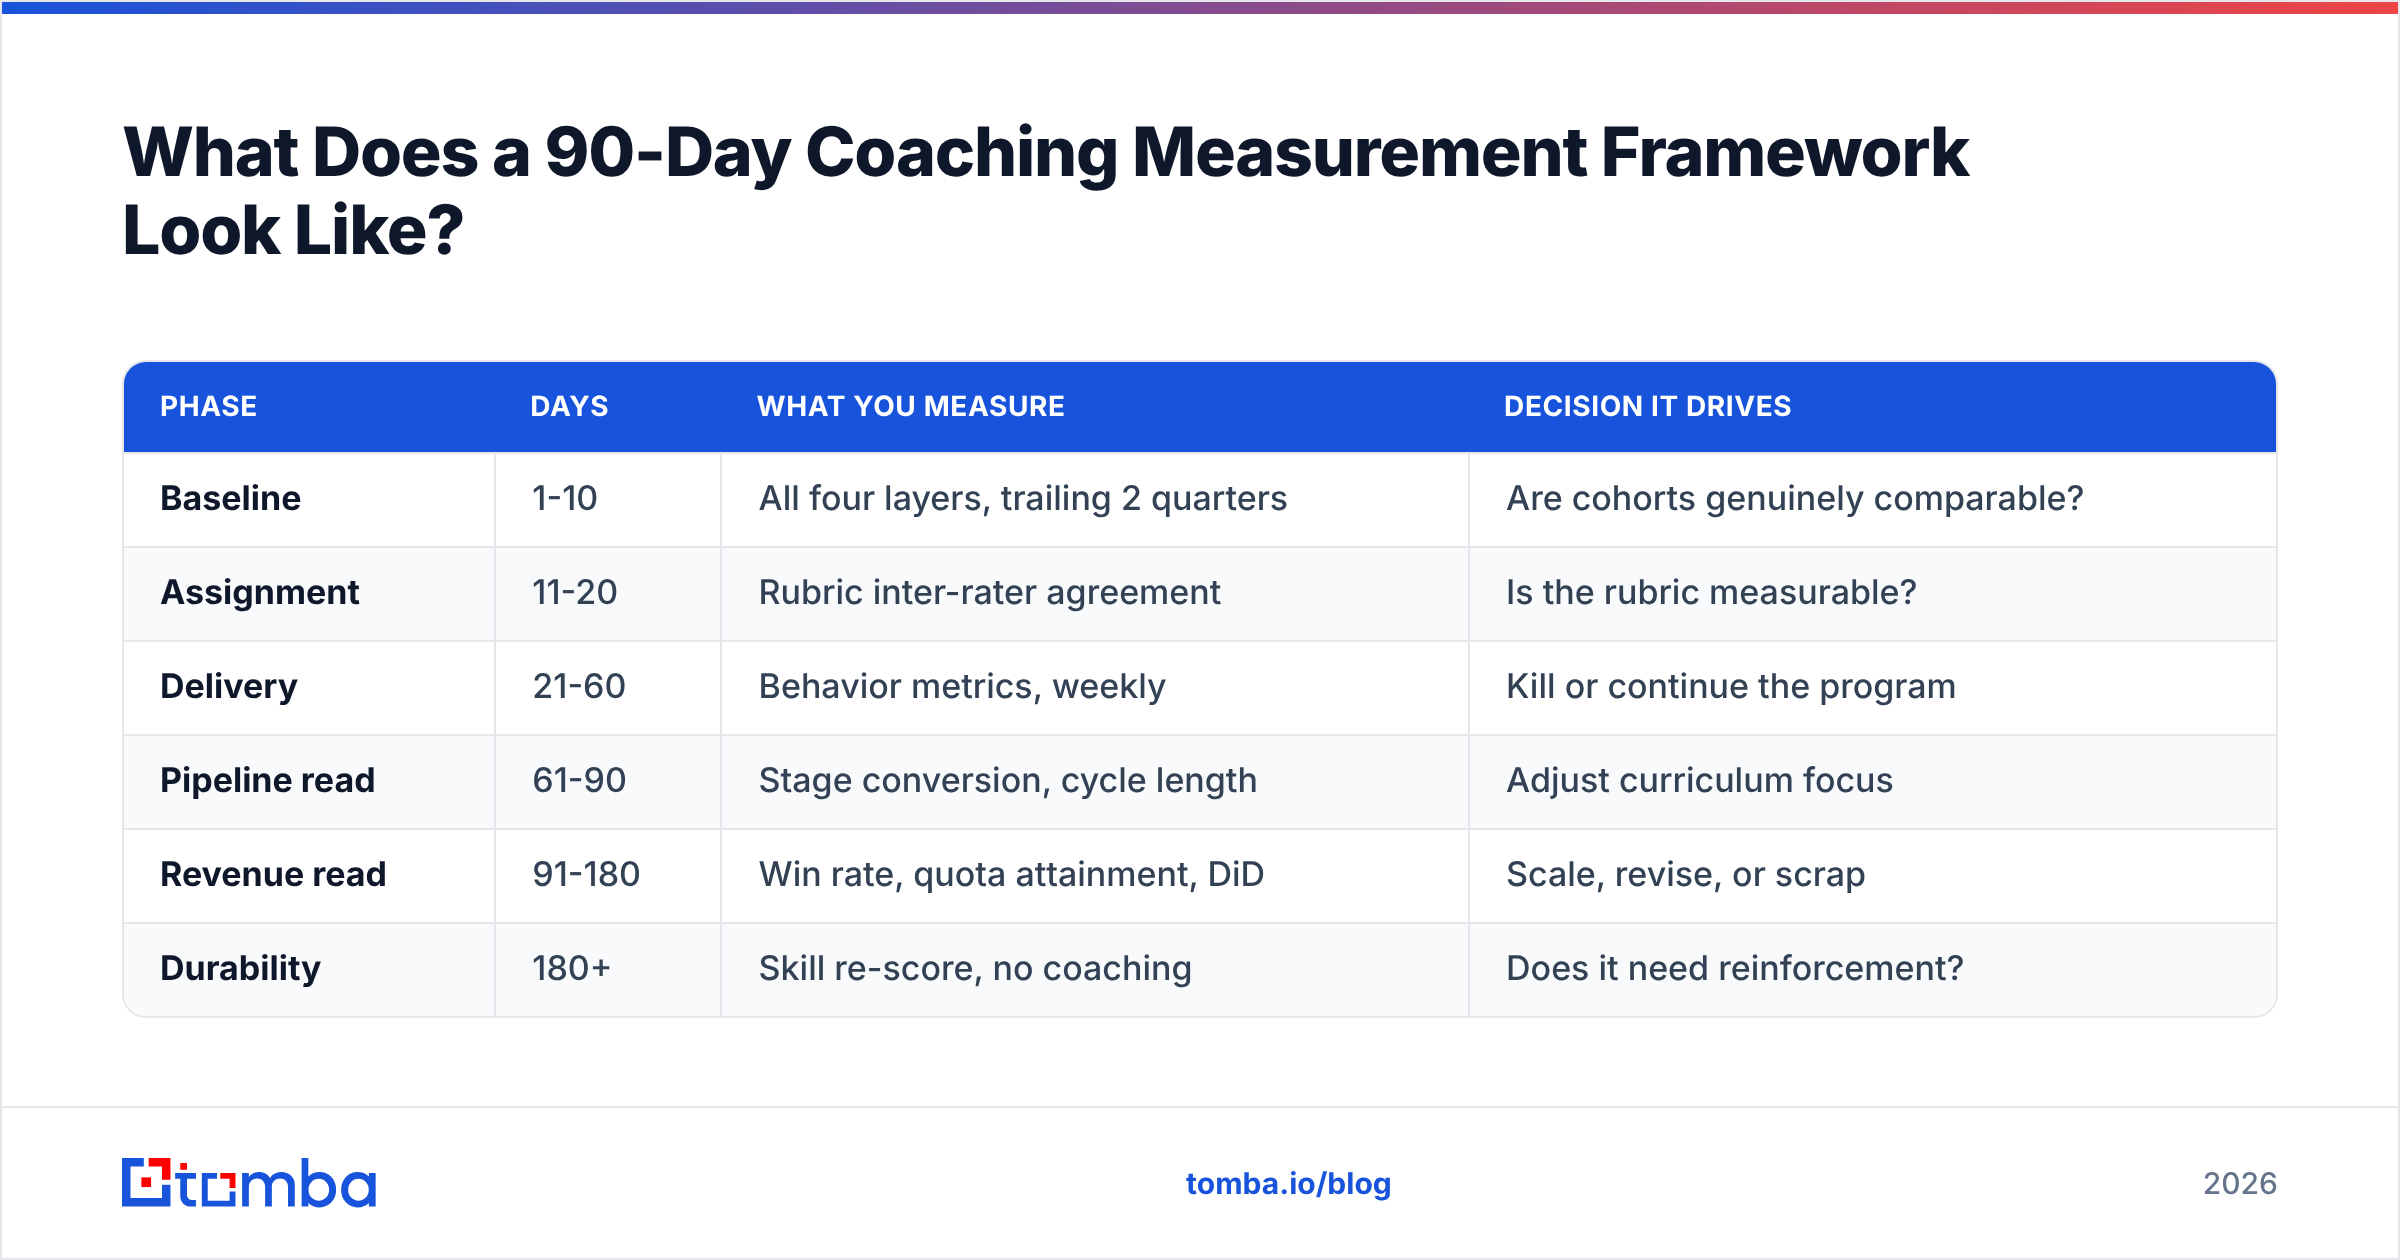
Days 1-10 — Baseline capture. Pull trailing two quarters for every rep: win rate, cycle length, stage conversion, activity volume, multithreading rate, quota attainment. Then score every rep on the skill you are about to coach. Use a fixed rubric and at least three scorers, so no single manager skews the result. Record how often the scorers agree. If they disagree more than 20% of the time, your rubric is too vague to measure anything.
Days 11-20 — Cohort assignment and rubric lock. Pair and split. Write down the pairing logic, so nobody reopens the debate in week nine. Lock the rubric and the curriculum.
Days 21-60 — Coaching delivery with weekly behavior reads. Run the program. Every Friday, pull the Layer 2 behavior metrics only. You want a behavior gap opening between cohorts by week four. Say discovery-question count and multithreading rate are flat in both cohorts by day 45. Then the coaching is not changing behavior, and no amount of patience will produce revenue change.
Days 61-90 — Pipeline read and mid-point skill re-score. Now pull Layer 3. Stage conversion and slipped-deal rate should be splitting apart if Layer 2 did. Re-score both cohorts on the rubric with the same scorers.
Days 91-180 — Revenue read and durability check. Layer 4 metrics become readable. Re-score skills again at day 180 with no coaching in between. That is your durability number.
| Phase | Days | What you measure | Decision it drives |
|---|---|---|---|
| Baseline | 1-10 | All four layers, trailing 2 quarters | Are cohorts genuinely comparable? |
| Assignment | 11-20 | Rubric inter-rater agreement | Is the rubric measurable? |
| Delivery | 21-60 | Behavior metrics, weekly | Kill or continue the program |
| Pipeline read | 61-90 | Stage conversion, cycle length | Adjust curriculum focus |
| Revenue read | 91-180 | Win rate, quota attainment, DiD | Scale, revise, or scrap |
| Durability | 180+ | Skill re-score, no coaching | Does it need reinforcement? |
The kill decision at day 60 is the most valuable part of this framework. Most teams run a failing coaching program for four quarters. They are waiting on revenue metrics that were never going to move.
How Does Data Quality Distort Your Coaching Metrics?#
This is the hidden variable almost nobody controls for. It can flip your conclusion entirely.
Suppose cohort A gets coaching on discovery and multithreading. Their multithreading rate jumps from 1.3 to 2.6. Win rate improves 5 points. You declare victory.
Except cohort A was also working a fresh account list with verified contact data. Cohort B was working a list that was 18 months stale, with a 22% bounce rate. What you measured was list hygiene, not coaching.
Apply three data controls before you measure sales coaching effectiveness:
- Normalize contact data freshness across cohorts. Both groups should work lists refreshed on the same schedule. Run an email verifier pass across both lists at baseline and record the valid rate per cohort. If cohort A starts at 94% deliverable and cohort B at 71%, your comparison is broken before day one.
- Normalize account tier and territory density. A rep with 40 enterprise accounts and a rep with 400 SMB accounts are not comparable on cycle length, coaching or no coaching.
- Log the data-sourcing method per rep. One rep builds lists with a proper email finder. Another scrapes LinkedIn by hand. They will post different conversion rates from identical coaching. Control for the tool, or the tool becomes your result.
The same logic applies to sender reputation. If one cohort's outbound lands in spam because their domain is burned, no coaching metric you collect can be read straight.
Which Tools Should You Use to Instrument Coaching Measurement?#
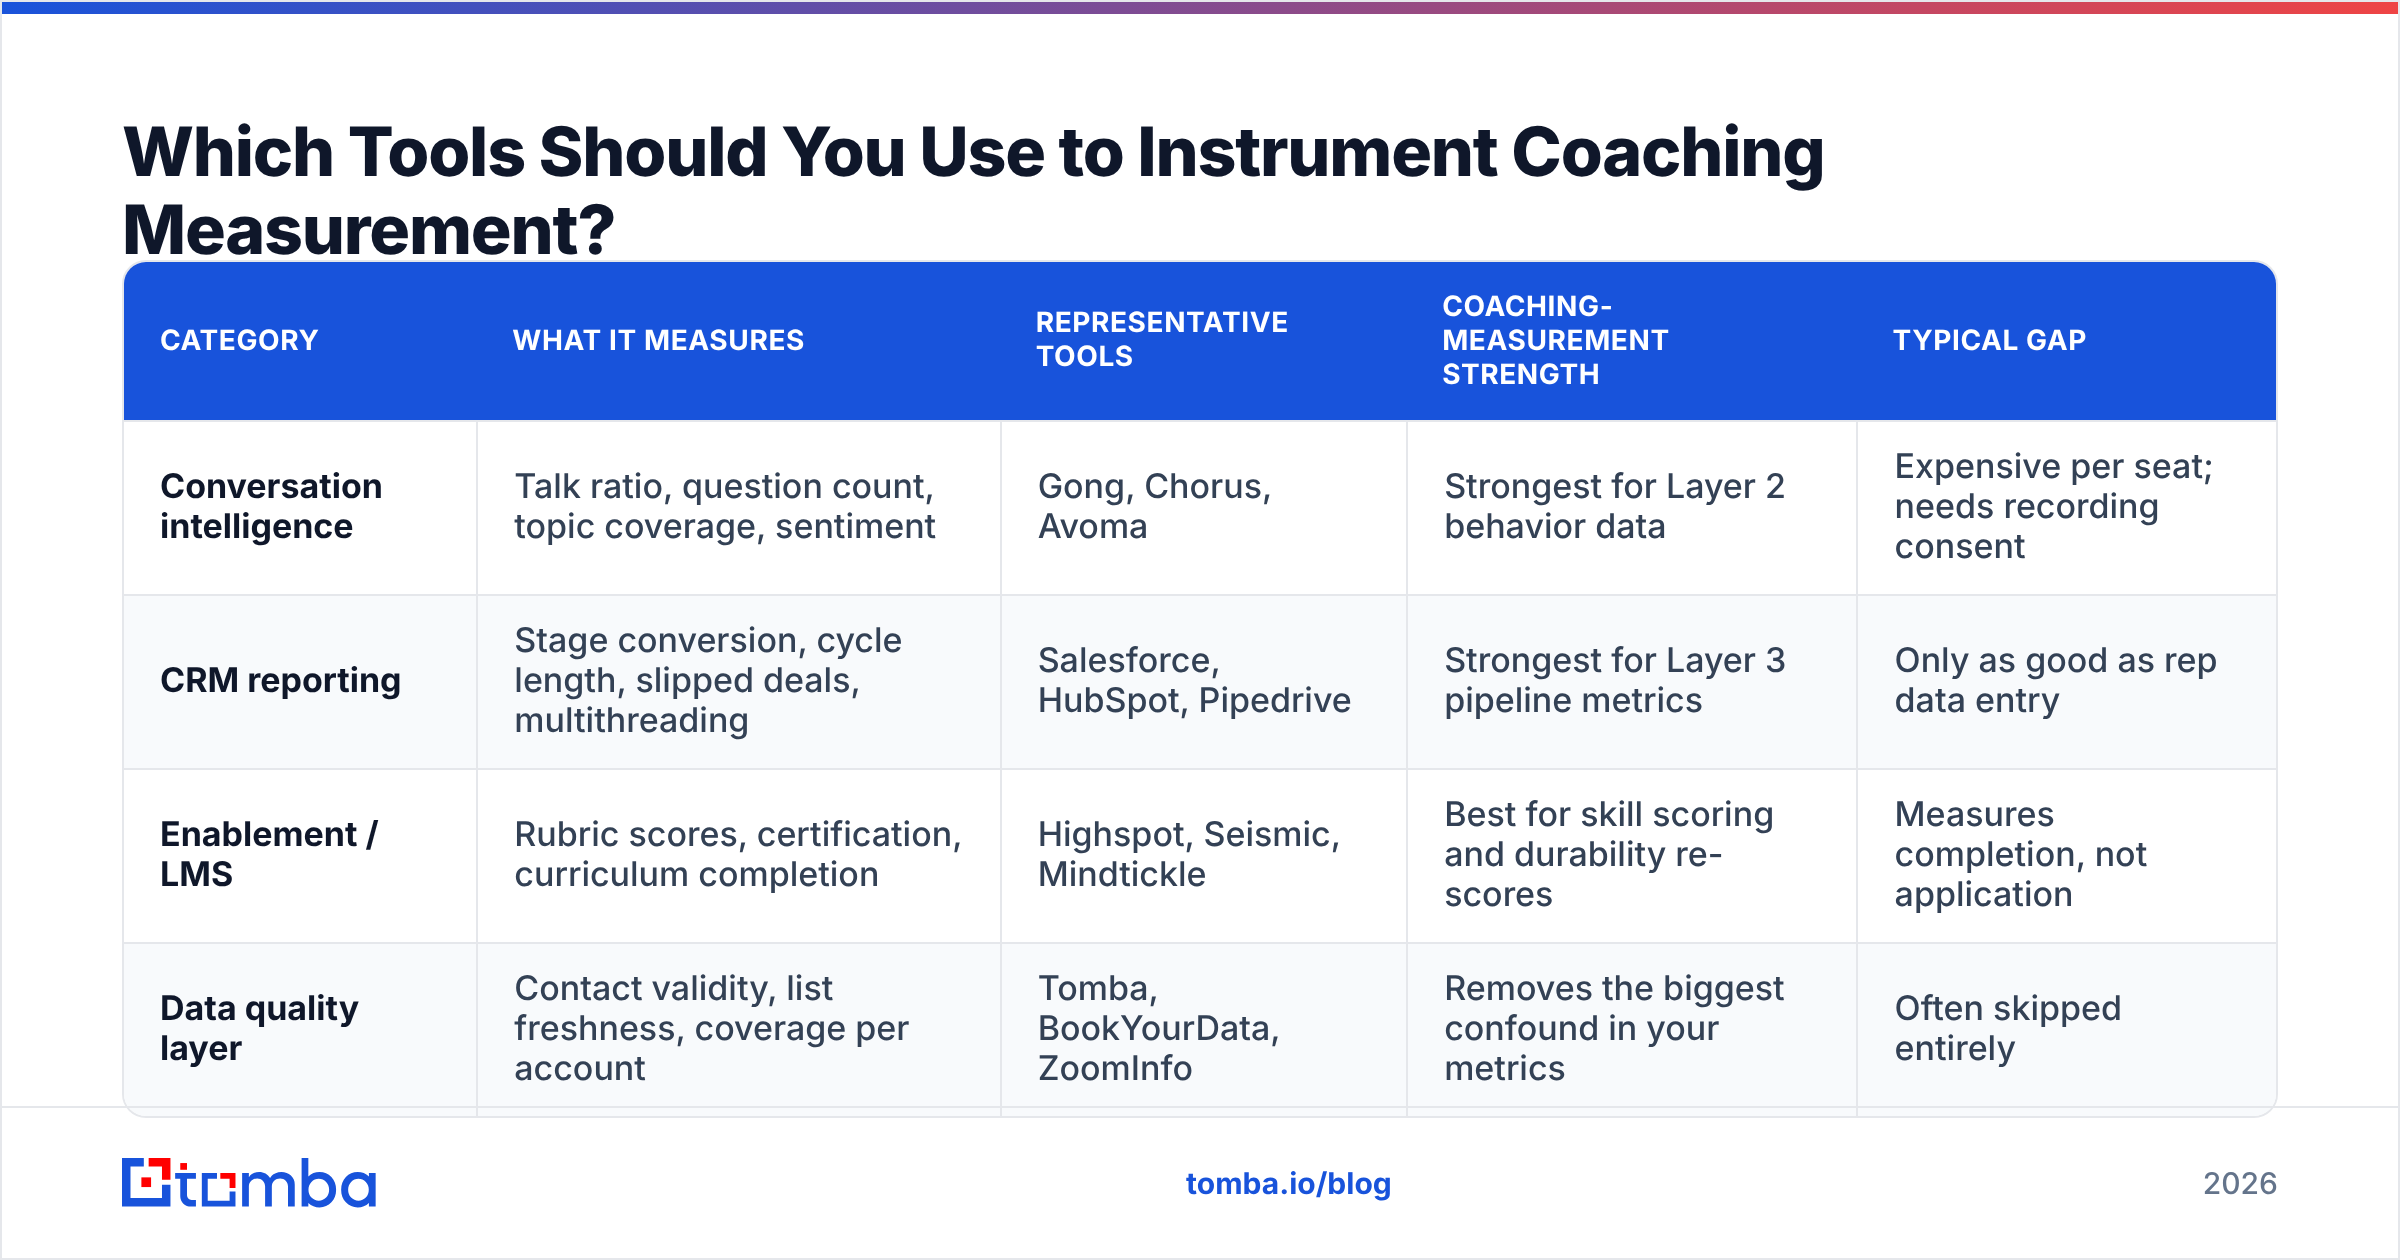
You need four categories of tooling. Here is how the common options compare for coaching measurement specifically.
| Category | What it measures | Representative tools | Coaching-measurement strength | Typical gap |
|---|---|---|---|---|
| Conversation intelligence | Talk ratio, question count, topic coverage, sentiment | Gong, Chorus, Avoma | Strongest for Layer 2 behavior data | Expensive per seat; needs recording consent |
| CRM reporting | Stage conversion, cycle length, slipped deals, multithreading | Salesforce, HubSpot, Pipedrive | Strongest for Layer 3 pipeline metrics | Only as good as rep data entry |
| Enablement / LMS | Rubric scores, certification, curriculum completion | Highspot, Seismic, Mindtickle | Best for skill scoring and durability re-scores | Measures completion, not application |
| Data quality layer | Contact validity, list freshness, coverage per account | Tomba, BookYourData, ZoomInfo | Removes the biggest confound in your metrics | Often skipped entirely |
Most teams buy the first three and skip the fourth. Then they wonder why conversion metrics jump around quarter to quarter. HubSpot's sales research points at data decay as a main driver of that swing. Contact data degrades roughly 2-3% per month in normal B2B markets. That is enough to swamp a 4-point coaching effect over two quarters.
BookYourData is a solid option when you want a purchased, pre-built list to normalize both cohorts quickly. Tomba fits the other pattern. It builds and refreshes lists on demand via API, so both cohorts stay on equally fresh data all the way through. Both approaches solve the same confound. Pick based on whether you need a bulk snapshot or a continuous refresh. Tomba pricing starts free at 25 searches/month, with Starter at $49/mo and Growth at $99/mo. That is cheap insurance against invalidating a quarter of coaching measurement.
If you are wiring this into an existing stack, the Tomba API and the HubSpot integration re-verify cohort contact lists on a schedule instead of by hand.
What Are the Most Common Coaching Measurement Mistakes?#
- Reporting inputs as outcomes. "We delivered 340 coaching hours" is a budget report, not an effectiveness report.
- No control group. Every uncontrolled coaching study finds a positive effect. That is what makes them useless.
- Manager-selected cohorts. Managers put their strongest reps in the coached group because they want the program to win. It is not malice, it is incentives.
- Single-scorer rubrics. One manager's 4/5 is another's 2/5. Without scorer agreement, your skill scores are noise.
- Measuring only the top of the funnel. Coaching that raises meeting-booked rate but not close rate has moved work, not revenue.
- Ignoring rep churn. If two coached reps quit mid-measurement, the survivors bias your cohort upward. Report attrition next to every effectiveness number.
- Stopping at the win. A coaching effect that vanishes in 90 days needs a reinforcement plan, not a celebration.
How Do You Report Coaching ROI to Leadership?#
Lead with the difference-in-differences number. State your confidence honestly. Then show the behavior chain.
A defensible one-page report reads like this. "Coached cohort win rate moved +5.2 points. Control cohort moved +1.4 points. Net coaching effect: +3.8 points, n=18 reps, two sales cycles."
Then the mechanism. "Multithreading rate rose from 1.4 to 2.7 contacts per opportunity in the coached cohort, and stayed flat in control. At our average deal size, +3.8 points on 240 annual opportunities is roughly $912K in incremental closed-won. Program cost $140K. Caveat: cohort sizes are small, so the true effect could land anywhere from +1 to +6 points."
That last sentence is what makes the rest credible. Leadership has seen plenty of enablement decks with suspiciously clean numbers. Stating your uncertainty buys you trust for the next program.
Track it where you already track response rate and pipeline coverage. Coaching then stops being a side conversation and becomes a line in the operating review.
Start With Clean Data Before You Measure Anything#
You cannot measure sales coaching effectiveness on top of dirty contact data. Stale lists, invalid addresses, and single-threaded accounts produce conversion swings that dwarf anything your coaching program does. You will spend a quarter arguing about a number that was never real.
Normalize both cohorts on verified, current contact data first. The Tomba Email Finder returns accurate professional emails by domain, name, or company. Every rep in your measurement window then works from the same quality of list, coached or not. Start free with 25 searches a month, or run both cohorts through a bulk refresh before your measurement window opens.
// get started
Find, verify and enrich your first contacts today
Start on the free plan with 25 searches a month, then scale when your team is ready.
Free plan · No credit card required · GDPR & CCPA
// about the author