Firmographics vs Technographics: B2B Data Guide (2026)
Firmographics tell you who a company is. Technographics tell you what they run. Here's how to combine both into an ICP that actually predicts who buys.
You can describe a company two ways. You can say it's a 400-person fintech in Berlin doing $50M in revenue, or you can say it runs Salesforce, Segment, and Snowflake and just added a job listing for a RevOps lead. The first description is firmographic. The second is technographic. Most teams build their entire targeting on the first and wonder why their lists feel like everyone else's.
This guide breaks down firmographics vs technographics: what each one is, where the data comes from, how accurate it tends to be, and how to layer both into an ideal customer profile (ICP) that actually predicts who buys instead of just describing who exists.
TL;DR#
- Firmographics describe who a company is: industry, size, revenue, location, structure. They answer "should this account be in my market at all?"
- Technographics describe what a company uses: the software, infrastructure, and tools in its stack. They answer "is this account a fit right now?"
- Firmographics are stable and broad; technographics are volatile and specific. Used alone, each is half a picture.
- The highest-performing ICPs stack both — firmographic filters define the universe, technographic signals rank intent and fit inside it.
- Your data is only as good as your source. Verify company records and contacts before you spend a sequence on them; bad data quietly taxes every downstream metric.
What are firmographics?#
Firmographics are to companies what demographics are to people. Demographics segment humans by age, income, and location; firmographics segment organizations by the structural traits that don't change week to week.
The core firmographic fields most B2B teams rely on:
- Industry / vertical (often via NAICS or SIC codes)
- Company size (headcount bands like 1–10, 11–50, 51–200, 201–1,000, 1,000+)
- Annual revenue
- Geography (HQ country, region, or specific metros)
- Company structure (independent, subsidiary, public, private)
- Growth signals (funding rounds, headcount trajectory, new locations)
If your product sells to mid-market manufacturers in North America, firmographics are how you draw that boundary. They're the zoning laws of your total addressable market — they tell you which neighborhoods you're even allowed to build in.
The strength of firmographic data is stability. A company's industry and rough size don't flip overnight, so a firmographic list stays valid for months. The weakness is that everyone has the same list. Your competitor can filter for "SaaS, 200–500 employees, US" in the same database you use and pull a nearly identical set. Firmographics get you to the right room; they don't tell you who in the room is ready to talk.
What are technographics?#
Technographics describe the technology a company actually runs — its CRM, marketing automation, cloud provider, analytics stack, payment processor, support desk, and the long tail of point tools underneath.
Where firmographics describe the building, technographics describe the wiring inside it. And the wiring tells you far more about whether you fit.
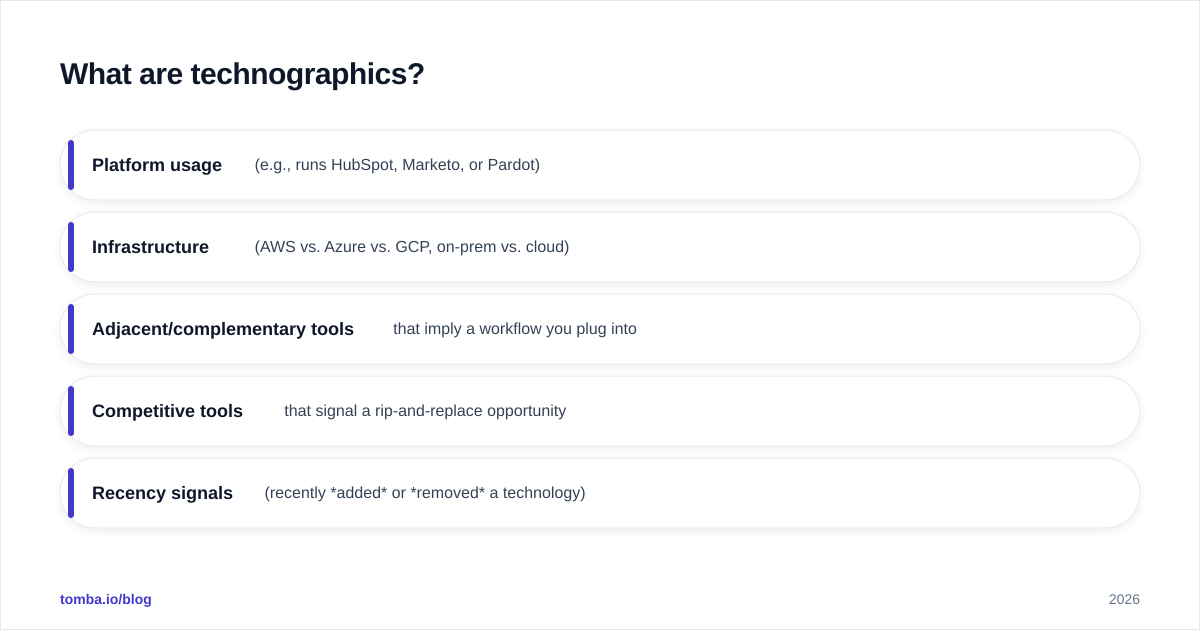
Typical technographic data points:
- Platform usage (e.g., runs HubSpot, Marketo, or Pardot)
- Infrastructure (AWS vs. Azure vs. GCP, on-prem vs. cloud)
- Adjacent/complementary tools that imply a workflow you plug into
- Competitive tools that signal a rip-and-replace opportunity
- Recency signals (recently added or removed a technology)
The reason technographics convert better is that they encode intent and compatibility. If you sell a Salesforce-native app, knowing an account runs Salesforce isn't a nice-to-have — it's a hard prerequisite. If you sell a Mixpanel competitor, an account that just posted three analytics-engineering roles is warmer than any cold firmographic match.
The catch: technographic data decays fast and is harder to detect accurately. Stacks change, detection methods miss server-side tools, and vendors disagree on what "uses" even means. Treat technographics as a strong but noisy signal, not gospel.
Firmographics vs technographics: what's the actual difference?#
Here's the side-by-side that most "what is technographics" posts skip.
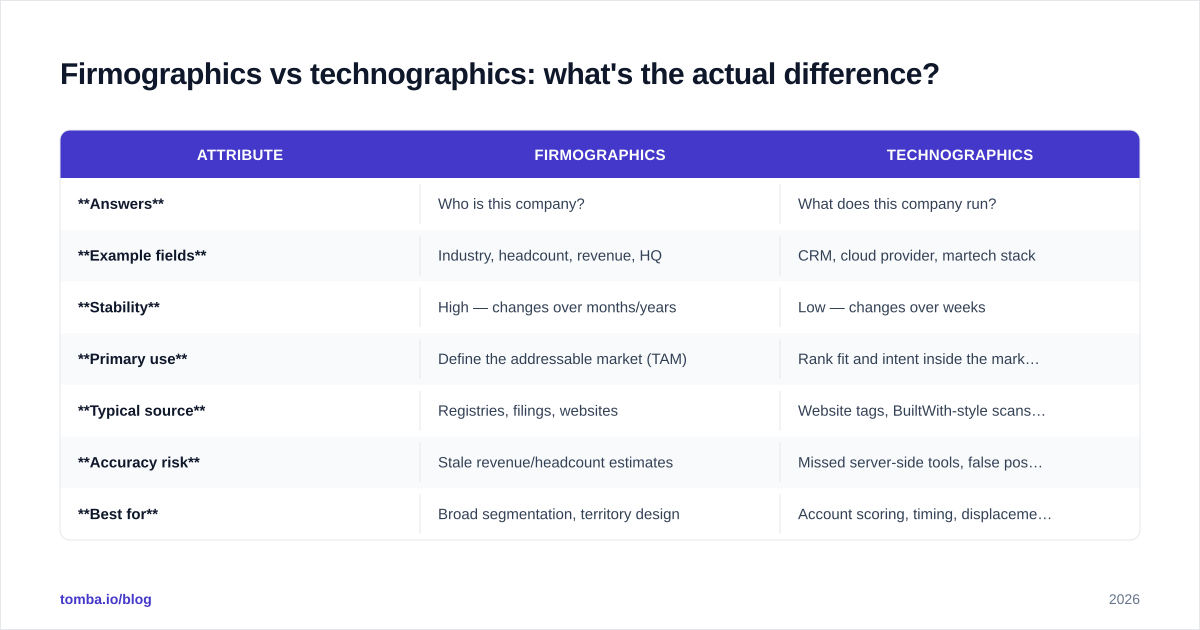
| Attribute | Firmographics | Technographics |
|---|---|---|
| Answers | Who is this company? | What does this company run? |
| Example fields | Industry, headcount, revenue, HQ | CRM, cloud provider, martech stack |
| Stability | High — changes over months/years | Low — changes over weeks |
| Primary use | Define the addressable market (TAM) | Rank fit and intent inside the market |
| Typical source | Registries, filings, websites | Website tags, BuiltWith-style scans, job posts |
| Accuracy risk | Stale revenue/headcount estimates | Missed server-side tools, false positives |
| Best for | Broad segmentation, territory design | Account scoring, timing, displacement plays |
| Used alone | Lists look generic | Lists lack market boundaries |
Read the table top to bottom and the relationship is obvious: these aren't competitors, they're layers. Firmographics set the what universe. Technographics set the which accounts, and why now.
How do you combine firmographics and technographics into an ICP?#
Stop choosing between them. The teams getting outsized reply rates use a layered model where each data type does the job it's good at.
A practical four-layer build:
Layer 1 — Firmographic boundary (the filter). Define the non-negotiables: industry, size band, geography, revenue floor. This is a hard include/exclude. Anything outside it never enters the pipeline. This usually cuts your raw universe by 80–95%.
Layer 2 — Technographic fit (the qualifier). Inside that boundary, flag accounts whose stack makes you compatible, complementary, or a displacement candidate. A Salesforce-native vendor scores Salesforce accounts higher; a Marketo competitor scores Marketo accounts higher.
Layer 3 — Signal recency (the timing). Layer in change events: new funding, a relevant hire, a tool recently added or churned. Recency is where technographics turn from "fit" into "now." An account that adopted a complementary tool last month is warmer than one that's run it for three years.
Layer 4 — Contact reachability (the execution). None of the above matters if you can't reach a real human at the account. This is where account-level data has to become person-level: the right title, a verified email, ideally a direct phone line.
That last layer is where most carefully built ICPs leak value. You can score an account perfectly and still burn the opportunity on a bounced email to info@. Use a dedicated domain search to pull the real contacts behind a qualified company, then run them through an email verifier before anything hits a sequence. Account intelligence and contact data are two halves of the same job.
Where does firmographic and technographic data come from?#
Knowing the source tells you how much to trust the field. Here's the rough provenance map.
Firmographic sources
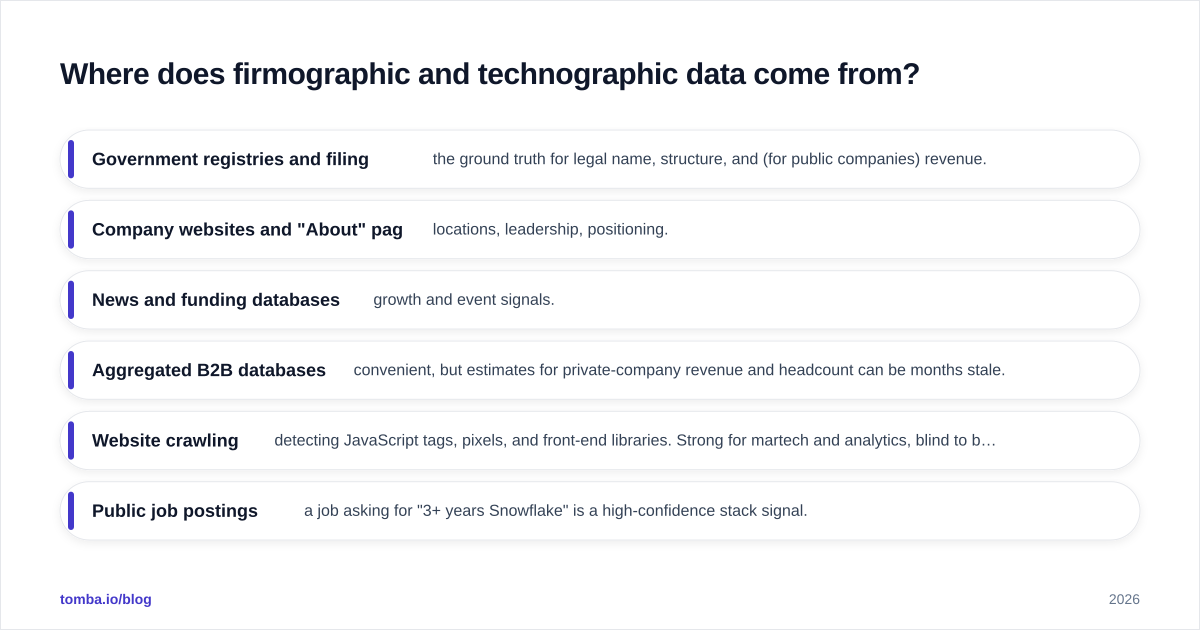
- Government registries and filings — the ground truth for legal name, structure, and (for public companies) revenue.
- Company websites and "About" pages — locations, leadership, positioning.
- News and funding databases — growth and event signals.
- Aggregated B2B databases — convenient, but estimates for private-company revenue and headcount can be months stale.
Technographic sources
- Website crawling — detecting JavaScript tags, pixels, and front-end libraries. Strong for martech and analytics, blind to back-end systems.
- Public job postings — a job asking for "3+ years Snowflake" is a high-confidence stack signal.
- DNS, email headers, and HTTP fingerprints — reveal mail providers, CDNs, and security tooling.
- Self-reported and review data — sites like G2 show what tools companies publicly say they use.
Two honest caveats. First, technographic detection is inherently incomplete — server-side and internal tools often leave no public trace, so absence of a signal isn't evidence of absence. Second, firmographic revenue and headcount for private companies are frequently modeled estimates, not facts. When the number matters (territory carving, ABM tiering), corroborate it.
For a deeper look at how contact and company datasets get assembled and validated, Tomba documents its own approach to data accuracy and sources, and the broader concept is well summarized on Wikipedia's firmographics entry.
What does this look like in practice? A worked example#
Say you sell a customer-data platform that's only worth deploying for companies with real data volume and an existing analytics culture.
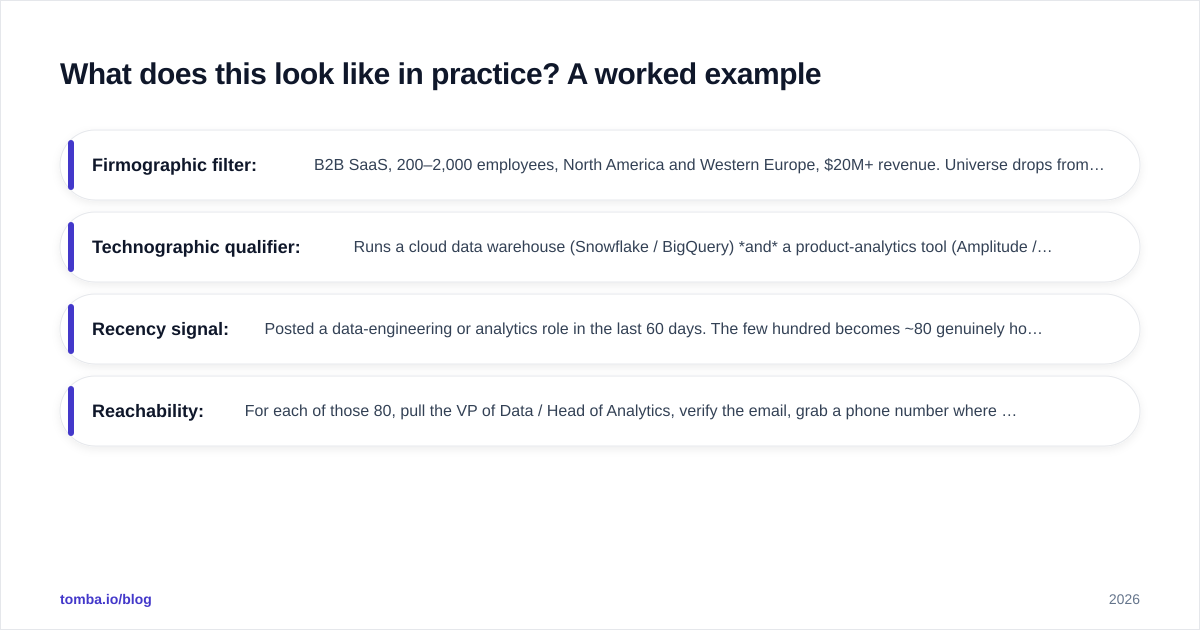
- Firmographic filter: B2B SaaS, 200–2,000 employees, North America and Western Europe, $20M+ revenue. Universe drops from millions of companies to a few thousand.
- Technographic qualifier: Runs a cloud data warehouse (Snowflake / BigQuery) and a product-analytics tool (Amplitude / Mixpanel). This is your compatibility AND-gate. The few thousand becomes a few hundred.
- Recency signal: Posted a data-engineering or analytics role in the last 60 days. The few hundred becomes ~80 genuinely hot accounts.
- Reachability: For each of those 80, pull the VP of Data / Head of Analytics, verify the email, grab a phone number where you can.
You now have 80 accounts with a clear, defensible reason to reach out — versus a 5,000-row firmographic list where every message starts with a guess. The same SDR capacity aimed at 80 right accounts beats 5,000 maybes on nearly every metric that matters: reply rate, meetings booked, and pipeline quality.

Which one matters more — and common mistakes to avoid#
Neither matters more in the abstract; it depends on what you sell. But the failure patterns are predictable.
Mistake 1 — Firmographics only. You build a clean ICP, pull 10,000 lookalike accounts, and your reps work an undifferentiated list. Open rates are fine, replies are dead, because nothing in the message proves you understand the account. Fix: add a technographic or event layer so every touch has a reason.
Mistake 2 — Technographics only. You chase every account running a competitor's tool and ignore that half of them are 8-person startups or in regions you can't service. Fix: gate technographic signals behind a firmographic boundary first.
Mistake 3 — Trusting stale fields. Acting on a two-year-old "uses Marketo" tag or a modeled revenue estimate as if it were fact. Fix: weight recency, and verify before high-cost actions.
Mistake 4 — Great account data, garbage contact data. You nail the account and then email a role address or an inbox that left the company a year ago. Fix: make verified, person-level contact data the final, non-optional layer. Account scoring without a deliverable contact is a scoreboard with no players.
That fourth mistake is the quiet killer because it doesn't show up in your targeting dashboard — it shows up as a slowly rising bounce rate and a sender reputation that erodes one bad send at a time. If you're enriching at scale, a bulk email finder plus verification keeps the contact layer honest without manual lookups, and Tomba's data enrichment can attach firmographic and contact fields to records you already have.
How accurate is this data, and how do you keep it clean?#
Assume every field has an error rate and budget for it. Firmographic structure (industry, country) is usually reliable; firmographic magnitude (private revenue, exact headcount) is often a modeled estimate. Technographic presence of front-end tools is fairly reliable; technographic completeness is not — you'll miss what you can't crawl.
Three habits keep a combined dataset usable:
- Verify at the boundary. Before a contact enters an active sequence, confirm the email resolves. This single step protects deliverability more than any copy tweak.
- Re-check on a cadence. Technographic and growth signals decay; re-scan high-value accounts quarterly rather than treating the first pull as permanent.
- Corroborate before expensive actions. ABM, territory design, and exec outreach justify a second source. Cheap, top-of-funnel touches don't.
For pricing on contact discovery and verification volume, Tomba pricing starts with a free tier of 25 searches per month, with the Starter plan at $49/mo when you need real throughput. Compare that against the cost of a sales team working stale lists and the math on data hygiene usually makes itself.
Frequently asked questions#
Are firmographics and technographics the only B2B data types? No. The common fourth category is intent data (content consumption signaling active research), and some teams separate out chronographic (timing/event) data. Firmographics and technographics are the foundational two; intent and timing sit on top.
Can a small team realistically use both? Yes — and arguably small teams benefit most, because tight targeting stretches limited rep capacity. You don't need an enterprise data warehouse; you need a firmographic filter, one or two technographic signals you can detect, and verified contacts.
Where do firmographics end and technographics begin for things like funding? Funding and headcount growth are usually classed as firmographic growth signals, while a new tool adoption is technographic. In practice you'll use both as "recency" inputs to the same scoring layer.
Build the account picture, then reach the person#
Firmographics tell you which companies belong in your market. Technographics tell you which of those are a fit, and which are a fit right now. Run them as layers, not rivals, and your list stops looking like everyone else's.
But account intelligence only pays off when it ends in a conversation, and conversations need a verified person — not a contact@ address. Once you've scored your accounts, turn them into reachable contacts with the Tomba Email Finder: find professional emails by domain, name, or company, verify them in the same workflow, and hand your reps a list where every row is a real human worth a real message. Start free with 25 searches and pressure-test it on your own ICP before you scale.
// get started
Find, verify and enrich your first contacts today
Start on the free plan with 25 searches a month, then scale when your team is ready.
Free plan · No credit card required · GDPR & CCPA
// about the author