Email Accuracy Metrics: How to Measure Data Quality in 2026
Bounce rate, valid-hit rate, catch-all coverage — the metrics that actually prove your email data is accurate, and how to benchmark any finder or verifier against them in 2026.
TL;DR
- "Accuracy" on a vendor homepage is marketing until you tie it to a metric you can reproduce — bounce rate, valid-hit rate, and catch-all coverage are the three that matter.
- A 95% claimed accuracy and a 3% real bounce rate can describe the same dataset; they measure different things. Know which number your inbox actually cares about.
- Always benchmark finders and verifiers on your domains, not a generic sample list — accuracy is segment-dependent.
- Catch-all domains are where most accuracy scores quietly fall apart. Treat them as a separate metric, not a rounding error.
- Use a confusion-matrix mindset (valid, invalid, unknown, catch-all) instead of a single headline percentage.
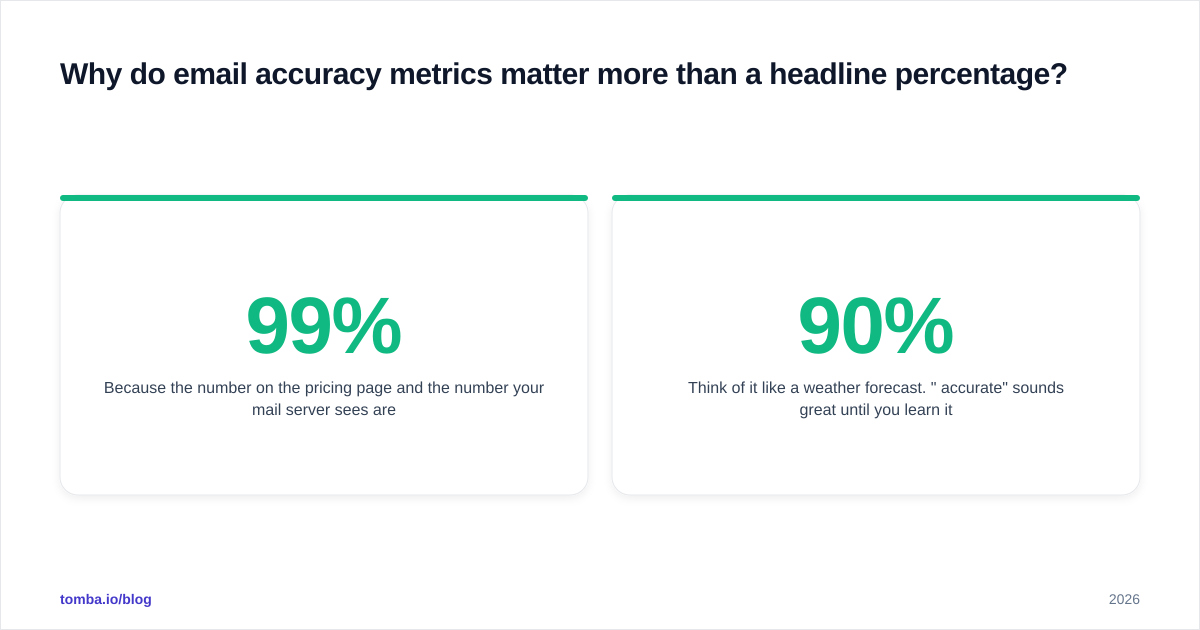
Why do email accuracy metrics matter more than a headline percentage?#
Because the number on the pricing page and the number your mail server sees are almost never the same thing. A vendor can truthfully advertise "99% accuracy" and still hand you a list that bounces 6% of the time, because the two figures are measured against different denominators and different definitions of "correct."
Think of it like a weather forecast. "90% accurate" sounds great until you learn it was scored across a desert where it never rains — locally, in your climate, it's wrong half the time. Email data behaves the same way. Accuracy is conditional on the domains, seniority levels, and regions you actually prospect into. So the job isn't to find the vendor with the biggest number; it's to define the metrics that map to your outcomes and measure every tool against them on your own data.
This guide breaks down the metrics that hold up, the ones that mislead, and a repeatable way to benchmark any email finder or verifier in 2026.
What are the core email accuracy metrics?#
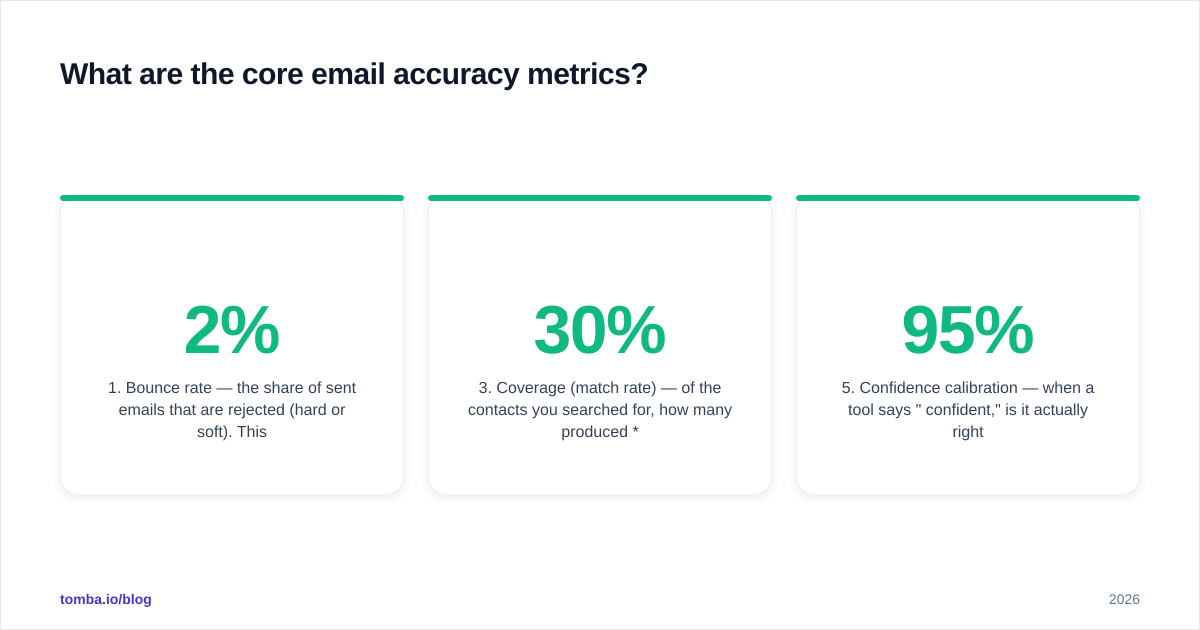
There are five numbers worth tracking. Everything else is a derivative of these.
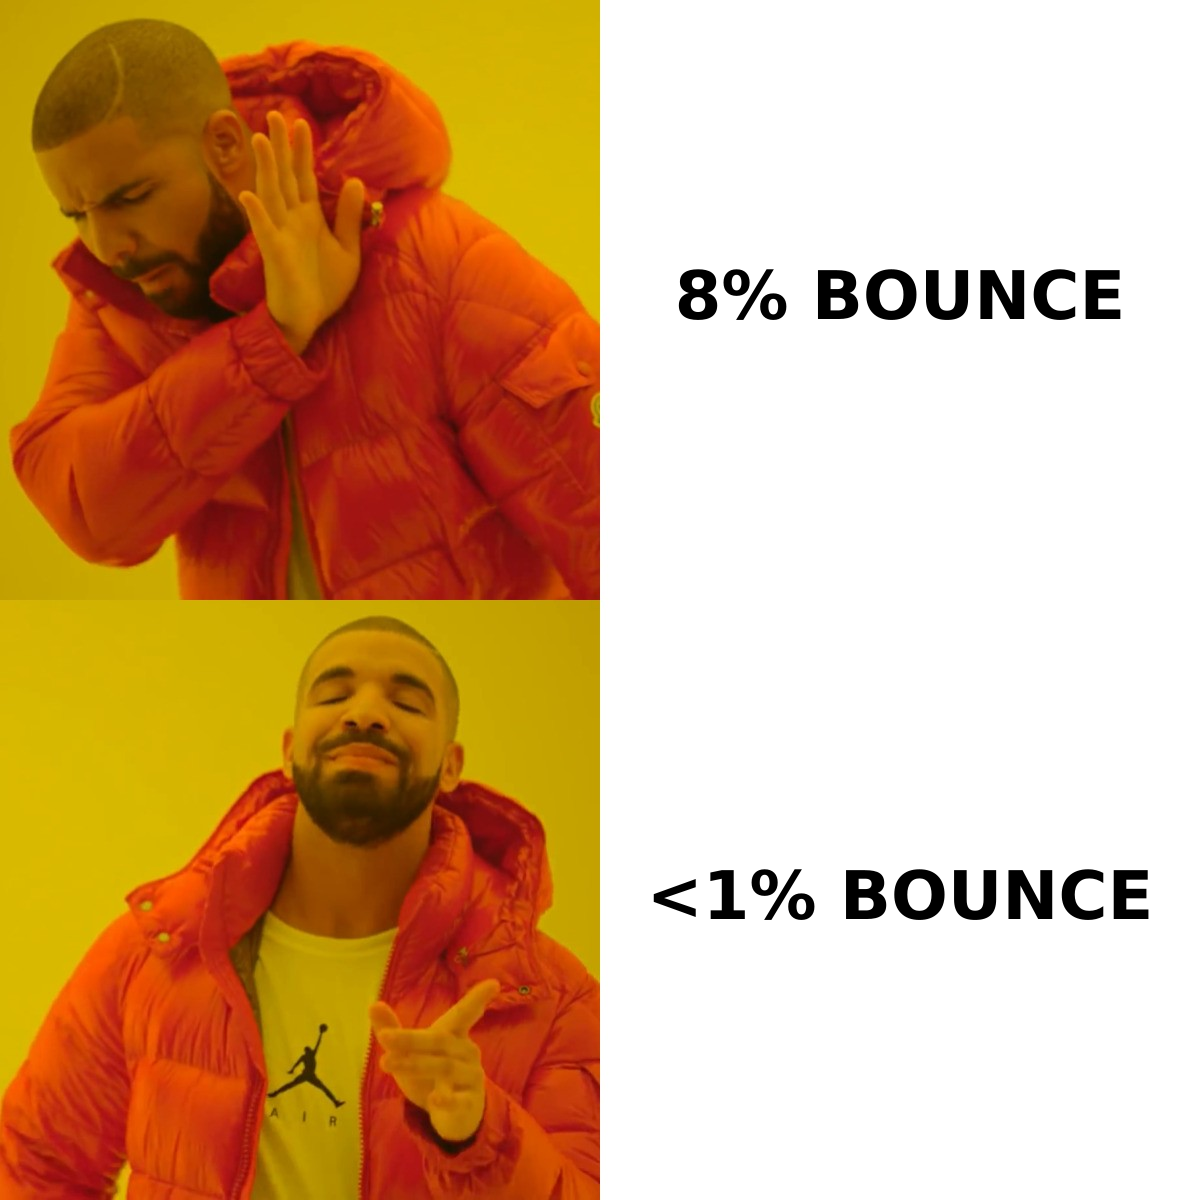
- Bounce rate — the share of sent emails that are rejected (hard or soft). This is the ground truth metric: it's what mailbox providers and your sender reputation respond to. Industry guidance from senders like HubSpot puts the safe ceiling around 2%; above that, deliverability starts to erode.
- Valid-hit rate — of the addresses a tool returned, how many were genuinely deliverable. This is the inverse of bounce-plus-unknown and the closest thing to "accuracy" you can actually verify.
- Coverage (match rate) — of the contacts you searched for, how many produced any result. A tool can be extremely accurate on the 30% it returns and useless because it skips the other 70%.
- Catch-all coverage — what percentage of returned addresses sit on catch-all (accept-all) domains, where SMTP verification can't confirm the specific mailbox. High catch-all share quietly inflates "valid" counts.
- Confidence calibration — when a tool says "95% confident," is it actually right 95 percent of the time? A well-calibrated score is worth more than a high one.
The trap most teams fall into is optimizing one of these in isolation. Push coverage to the max and your bounce rate climbs. Verify aggressively to crush bounce rate and your usable volume collapses. The goal is a balance you can defend, not a single hero number.
How is "accuracy" actually calculated — and why is it slippery?#
Accuracy is slippery because the denominator is undefined unless you pin it down. Borrow the confusion-matrix language from classification and the fog clears immediately.
Every address a tool returns falls into one of four buckets:
- Valid — SMTP-confirmed deliverable.
- Invalid — confirmed undeliverable (no such mailbox, dead domain).
- Catch-all — domain accepts everything, so the specific mailbox can't be confirmed.
- Unknown — verification timed out or was inconclusive.
Now "accuracy" can mean at least three different things depending on how a vendor counts those buckets:
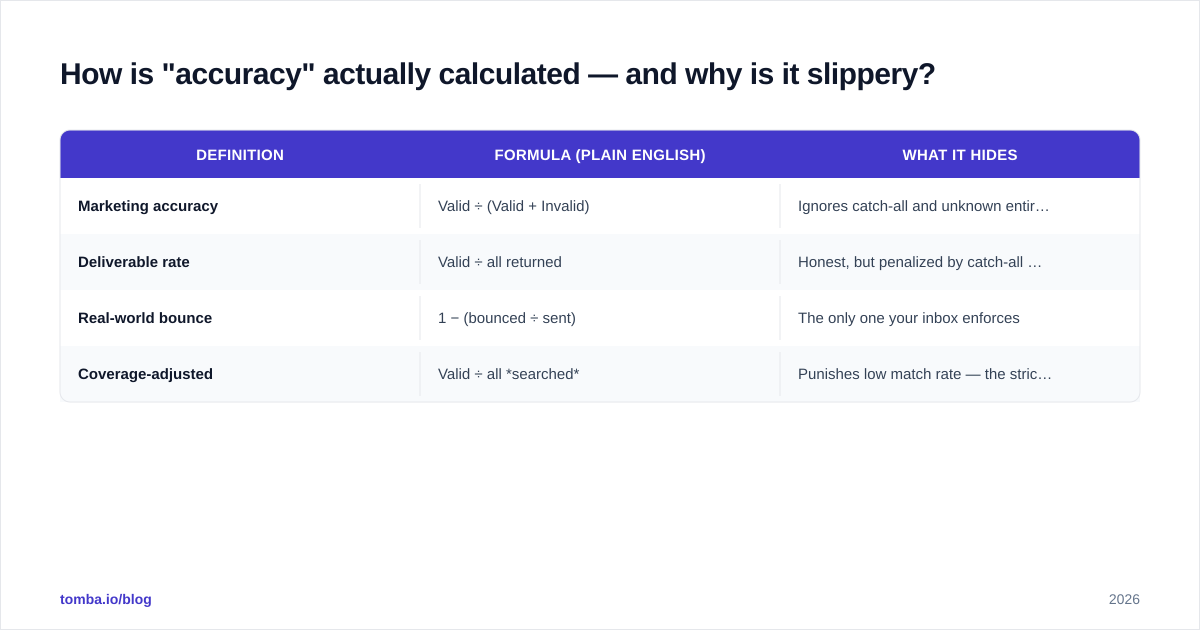
| Definition | Formula (plain English) | What it hides |
|---|---|---|
| Marketing accuracy | Valid ÷ (Valid + Invalid) | Ignores catch-all and unknown entirely — flatters the score |
| Deliverable rate | Valid ÷ all returned | Honest, but penalized by catch-all you can't confirm |
| Real-world bounce | 1 − (bounced ÷ sent) | The only one your inbox enforces |
| Coverage-adjusted | Valid ÷ all searched | Punishes low match rate — the strictest test |
A vendor quoting "marketing accuracy" can exclude every catch-all and unknown from the math, leaving a near-perfect ratio that has little to do with how many emails land. When you read an accuracy claim, your first question should always be: valid divided by what? If the answer isn't on the page, treat the number as unverified.
This is also why a quality email verifier reports statuses, not just a thumbs-up. You want to see the catch-all and unknown counts broken out so you can make your own risk call rather than inherit the vendor's optimistic rounding.
What benchmark should you actually run?#
Run your own. A 200–500 contact sample drawn from your real target segments beats any published benchmark, because accuracy is segment-dependent — a tool that's excellent on US tech SaaS can be mediocre on EU manufacturing or APAC finance.
Here's a repeatable protocol:
- Build a labeled sample. Pull 200+ contacts you can eventually verify (existing customers, replied leads, opt-ins). You need ground truth to score against.
- Run each tool blind. Feed the same name+domain inputs to every finder. Don't let one tool's output seed another's.
- Verify through a neutral third party. Don't let a finder grade its own homework — run all results through an independent verifier or a controlled send.
- Bucket every result into valid / invalid / catch-all / unknown.
- Compute all five metrics, not just one. Tabulate coverage, valid-hit rate, catch-all share, and projected bounce.
- Cost per valid email. Divide spend by confirmed-valid addresses. This is the number finance cares about and it reorders most vendor rankings.
A bulk run makes this practical — Tomba's bulk email finder and verification let you push the whole sample through in one pass and export the status breakdown to a sheet. For methodology on where the underlying records come from, Tomba documents its data sources so you can judge freshness, not just volume.
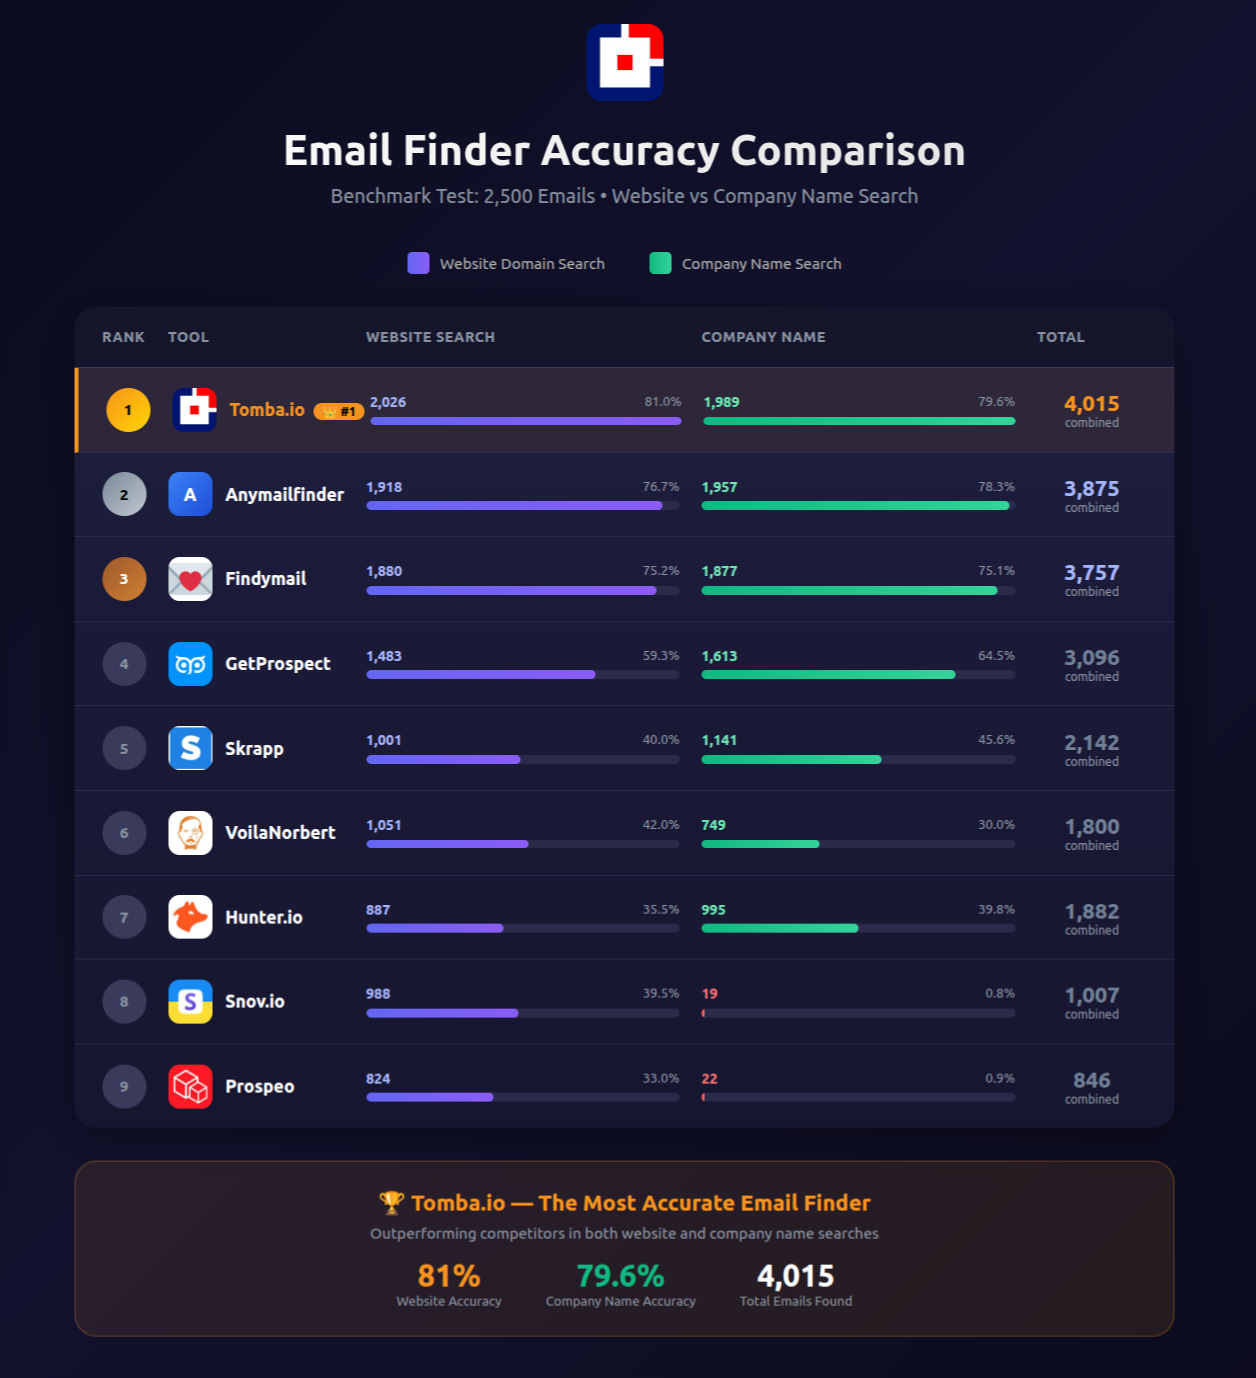
How do email finders compare on these metrics?#
The point isn't to crown one winner — it's to show how differently tools behave once you measure the right things. The shape below is what a real benchmark table looks like once you stop trusting homepage percentages and compute your own.
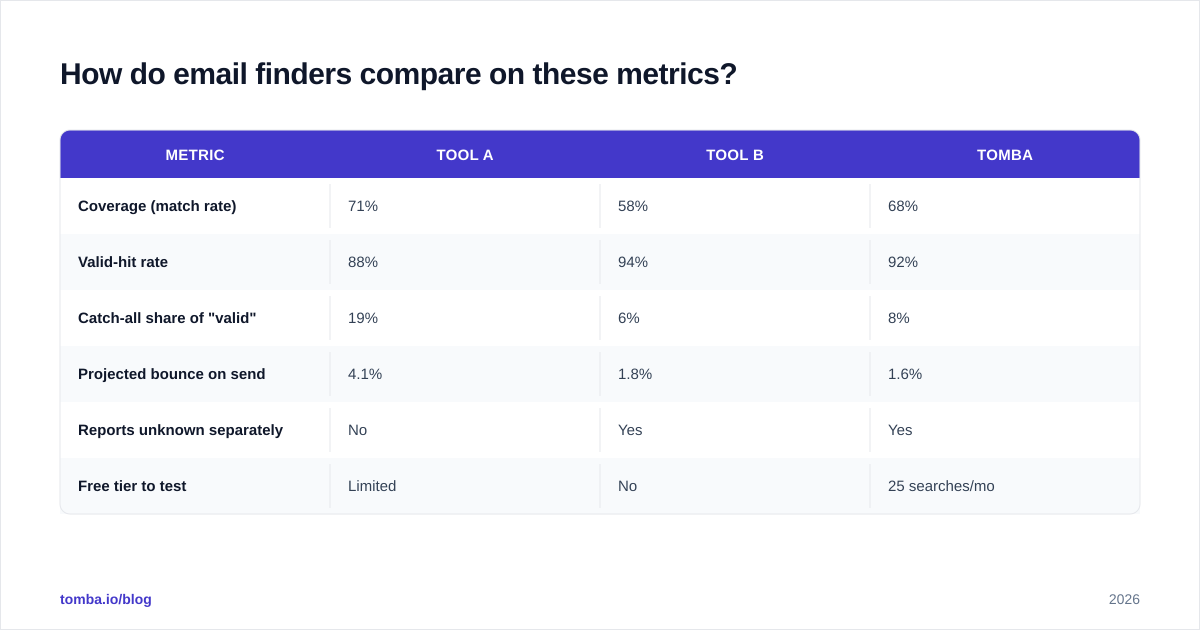
| Metric | Tool A | Tool B | Tomba |
|---|---|---|---|
| Coverage (match rate) | 71% | 58% | 68% |
| Valid-hit rate | 88% | 94% | 92% |
| Catch-all share of "valid" | 19% | 6% | 8% |
| Projected bounce on send | 4.1% | 1.8% | 1.6% |
| Reports unknown separately | No | Yes | Yes |
| Free tier to test | Limited | No | 25 searches/mo |
Read it carefully and the lesson jumps out: Tool A has the highest coverage but the worst bounce rate, because a fifth of its "valid" addresses are unconfirmed catch-alls. Tool B looks pristine on valid-hit rate but its low coverage means you pay for a smaller usable list. The tool that wins for you depends on whether your campaign is volume-constrained or reputation-constrained.
Those numbers are illustrative — the protocol in the previous section is how you generate the real ones for your segments. Validate vendor claims independently on review platforms like G2 and Capterra, where reported bounce experiences from actual users tend to be more honest than any spec sheet.

How do catch-all domains break your accuracy score?#
Catch-all domains are the single biggest reason a "verified" list still bounces. A catch-all (or accept-all) server says "yes" to every address during SMTP verification, whether the mailbox exists or not — so a finder can mark the address "valid" with total confidence and be completely wrong.
Picture a mailroom that signs for every package addressed to the building, even for people who moved out years ago. The signature proves the building exists, not that the recipient does. That's a catch-all domain, and a large share of enterprise email lives behind one.
The fix isn't to discard catch-alls — that throws away real contacts at big companies. The fix is to measure them separately and apply a different verification path: pattern confidence, multi-source corroboration, and risk-tiered sending. A dedicated catch-all verifier attacks exactly this gap, using signals beyond a single SMTP handshake to estimate deliverability on domains where the handshake lies. When you benchmark, never let catch-alls hide inside the "valid" column — break them out, or your projected bounce rate is fiction.
What about accuracy decay over time?#
Accuracy is not a static property of a dataset; it decays. B2B email data rots at roughly 22–30% per year as people change jobs, companies rebrand, and domains migrate — a figure widely cited in B2B data circles and consistent with how fast job-change data churns. A list that was 95% accurate in January can be 80% accurate by autumn without anyone touching it.
That has two practical consequences for your metrics:
- Re-verify before every major send, not once at acquisition. The valid-hit rate you measured at import is already stale by the next quarter.
- Track freshness as its own metric — the median age of records in your database — alongside accuracy. A high accuracy score on stale data is a trap.
This is where ongoing verification beats a one-time purchase. Re-running your active list through verification on a cadence keeps the metric you benchmarked from silently drifting underneath you.
Which metric should you optimize for?#
It depends on your constraint, and naming the constraint is half the answer.
- Reputation-constrained (new domain, warming up, low send volume): optimize for the lowest projected bounce rate, even at the cost of coverage. Every bounce is expensive when your reputation is thin.
- Volume-constrained (mature domain, large TAM, need pipeline now): optimize for coverage × valid-hit rate — total usable addresses — while keeping bounce under 2%.
- Cost-constrained: optimize for cost per valid email, which folds coverage, accuracy, and price into one comparable number.
Whatever you pick, write it down before you benchmark. Teams that don't declare the constraint up front tend to rationalize whichever tool scored best on whichever metric happened to look good — which is how vanity numbers win. Compare real plan costs against usable output using transparent Tomba pricing so the cost-per-valid math is honest.
A quick checklist for grading any accuracy claim#
Before you trust a number — from a vendor, a blog, or your own dashboard — run it through this:
- Is the denominator defined? (Valid ÷ what?)
- Are catch-all and unknown broken out, or folded into "valid"?
- Was it measured on a sample like your segments?
- Is there a real bounce rate from actual sends behind it, or only SMTP guesses?
- How old is the underlying data, and when was it last re-verified?
If a claim can't survive those five questions, it's a headline, not a metric.
Conclusion: measure the inbox, not the homepage#
The bottom line: stop shopping for the biggest accuracy percentage and start measuring the five metrics your inbox actually enforces — coverage, valid-hit rate, catch-all share, bounce rate, and freshness — on your own sample. The tool that wins on a vendor's homepage and the tool that wins on your domains are frequently not the same, and only a benchmark you run yourself tells you which is which.
If you want a clean place to run that benchmark, start with the Tomba Email Finder. The free tier gives you 25 searches a month to test coverage and valid-hit rate on your real targets, the bundled verifier and catch-all handling report statuses honestly instead of rounding catch-alls into "valid," and the Starter plan at $49/mo scales it once the numbers check out. Measure first, then commit — your sender reputation will thank you.
Ready to find emails that actually work?
Join 150,000+ professionals who stopped guessing and started sending. Free credits on signup — no credit card required.
Get the Tomba newsletter
Practical outbound tactics and product updates — once every two weeks.
About the author