Lead Generation Economics and Measurement: 2026 Guide
Most teams count leads. The ones that win count dollars. Here's how to measure lead generation economics — CPL, CAC, payback, and ROI — without lying to yourself.
TL;DR
- Lead generation economics is the discipline of tying every lead back to a dollar figure: what it cost to acquire, what it's worth, and how long until it pays you back.
- Vanity metrics (raw lead volume, MQL counts, form fills) hide bad economics. The numbers that matter are CPL, CAC, payback period, and pipeline-weighted ROI.
- A lead is only "cheap" relative to the revenue it produces. A $5 lead that never closes is more expensive than a $200 lead that becomes a $40k contract.
- You can't measure what you don't track at the source — clean contact data and consistent attribution are the foundation of every reliable number below.
- This guide gives you the formulas, a channel-comparison framework, and a 5-step measurement loop you can run this quarter.
Why does lead generation economics matter more than lead volume?#
Because volume lies, and money doesn't. You can double your lead count next month by loosening your form, buying a cheap list, or running a giveaway — and watch your sales team's close rate collapse while your cost per closed deal quietly triples.
Think of lead generation like a restaurant kitchen. The number of plates leaving the pass (leads) tells you almost nothing. What matters is food cost per plate, how many plates get sent back (disqualified leads), and how much each table actually spends (revenue). A kitchen optimizing for "plates out the door" goes bankrupt cheerfully.
Technically, lead generation economics is the practice of attaching a unit cost and a unit value to every lead so you can compare channels, forecast pipeline, and decide where the next dollar of budget goes. Gartner's research on B2B buying consistently shows that buyers spend only a fraction of their journey talking to vendors — which means the leads you generate are increasingly self-qualified and increasingly expensive to source accurately. Getting the math right is no longer optional.

What are the core lead generation metrics you must track?#
There are dozens of dashboards you could build. Five numbers carry most of the signal.
- Cost Per Lead (CPL): total channel spend ÷ leads generated. The entry-level metric — useful, but dangerous on its own.
- Cost Per Qualified Lead (CPQL): spend ÷ leads that pass your qualification bar (often a marketing qualified lead). This is where channels start separating.
- Customer Acquisition Cost (CAC): fully-loaded sales + marketing spend ÷ new customers. The number your CFO actually cares about.
- Payback Period: CAC ÷ monthly gross margin per customer. How many months until a customer pays back what you spent to win them.
- Pipeline ROI: revenue (or pipeline value) generated ÷ total cost, expressed as a multiple. Your scoreboard.
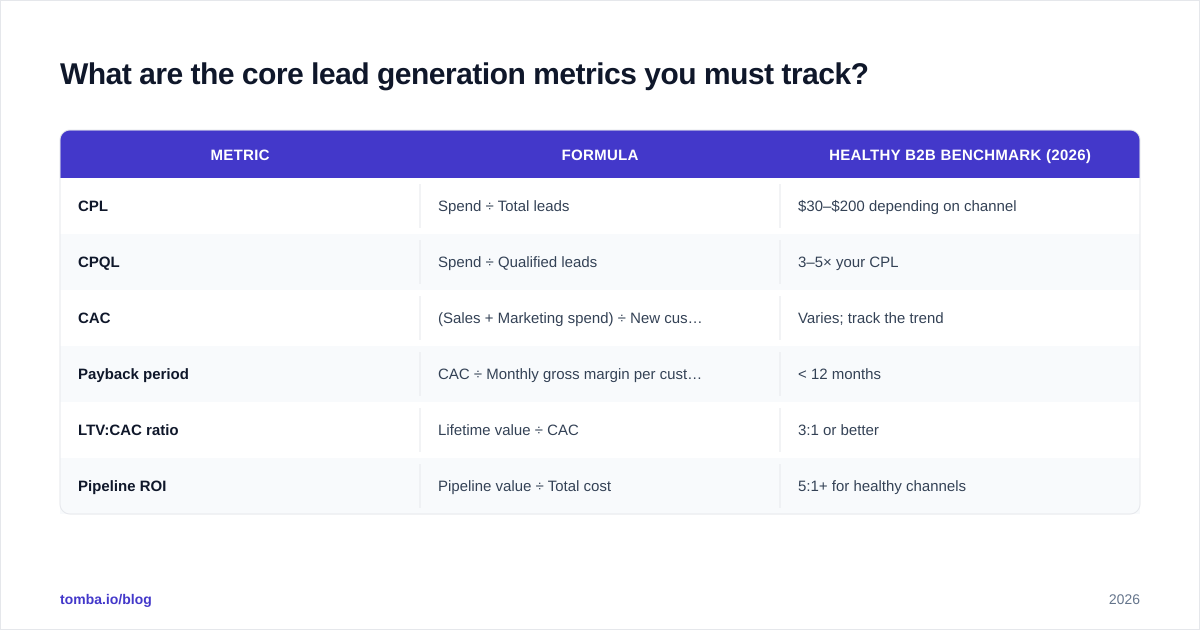
Here are the formulas in one place so you can drop them into a sheet:
| Metric | Formula | Healthy B2B benchmark (2026) |
|---|---|---|
| CPL | Spend ÷ Total leads | $30–$200 depending on channel |
| CPQL | Spend ÷ Qualified leads | 3–5× your CPL |
| CAC | (Sales + Marketing spend) ÷ New customers | Varies; track the trend |
| Payback period | CAC ÷ Monthly gross margin per customer | < 12 months |
| LTV:CAC ratio | Lifetime value ÷ CAC | 3:1 or better |
| Pipeline ROI | Pipeline value ÷ Total cost | 5:1+ for healthy channels |
A quick gut check: if your LTV:CAC is below 3:1, you're buying growth at a loss and papering over it with new funding. If it's above 5:1, you're probably under-investing and leaving growth on the table.
How do you actually measure cost per lead correctly?#
The mistake almost everyone makes: they divide ad spend by form fills and call it CPL. That undercounts cost on two fronts.
First, fully-load the spend. CPL isn't just media budget. It includes the tooling, the content production, the SDR hours spent on follow-up, and the data costs to enrich and reach those leads. A "free" organic lead that took 40 hours of content work to produce is not free.
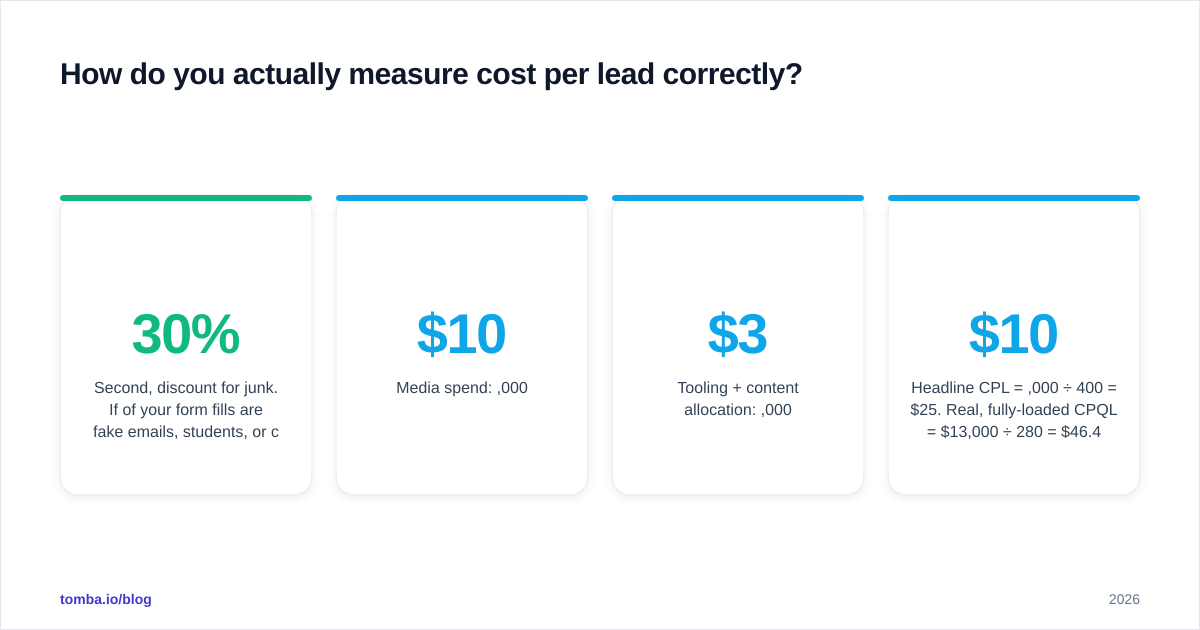
Second, discount for junk. If 30% of your form fills are fake emails, students, or competitors, your real CPL is ~43% higher than the headline number. This is why clean capture matters at the source — running new contacts through an email verifier before they ever hit your CRM stops you from paying SDR time to chase addresses that bounce.
A worked example. Say a paid channel looks like this:
- Media spend: $10,000
- Tooling + content allocation: $3,000
- Leads captured: 400
- Valid, reachable leads after verification: 280
Headline CPL = $10,000 ÷ 400 = $25. Real, fully-loaded CPQL = $13,000 ÷ 280 = $46.40. That's the number you compare across channels — and it's nearly double the figure most teams report upward.
Which lead generation channels have the best economics?#
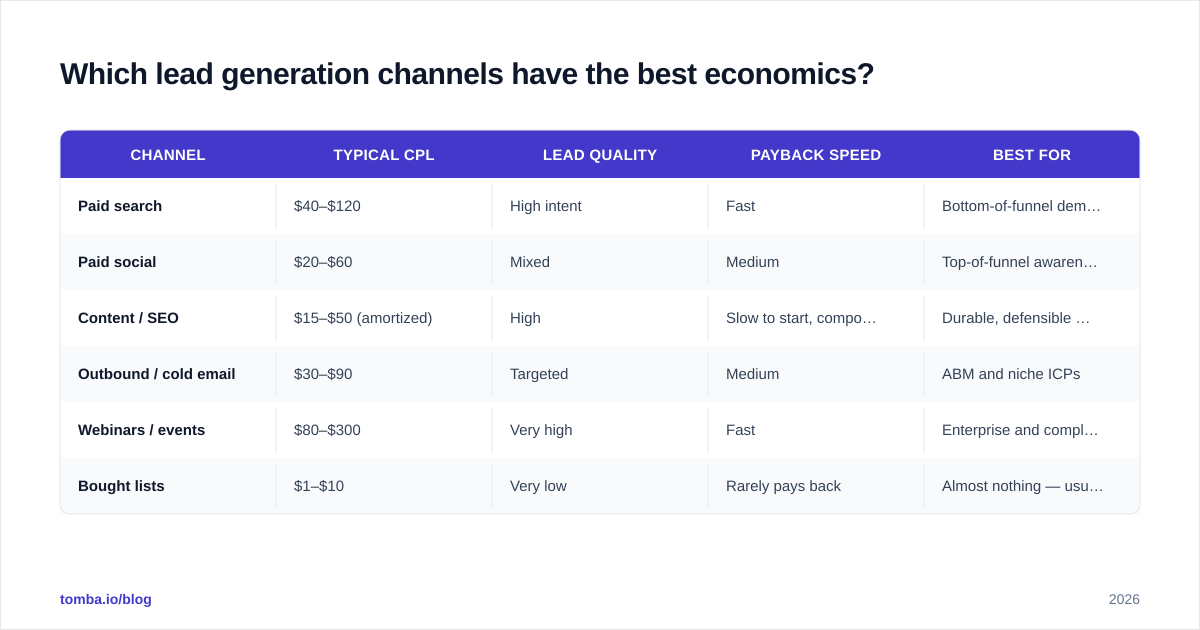
It depends on your motion, but the shape of the answer is consistent. Cheap-and-broad channels win on CPL and lose on CPQL. Expensive-and-narrow channels look scary up front and win on payback. Here's a representative comparison you can adapt:
| Channel | Typical CPL | Lead quality | Payback speed | Best for |
|---|---|---|---|---|
| Paid search | $40–$120 | High intent | Fast | Bottom-of-funnel demand capture |
| Paid social | $20–$60 | Mixed | Medium | Top-of-funnel awareness |
| Content / SEO | $15–$50 (amortized) | High | Slow to start, compounds | Durable, defensible pipeline |
| Outbound / cold email | $30–$90 | Targeted | Medium | ABM and niche ICPs |
| Webinars / events | $80–$300 | Very high | Fast | Enterprise and complex deals |
| Bought lists | $1–$10 | Very low | Rarely pays back | Almost nothing — usually a trap |
Notice the bought-list row. On CPL it crushes everything. On economics it's typically the worst channel you can run, because deliverability craters, your sender reputation takes damage, and the close rate approaches zero. Cheap leads with no economics are the most expensive leads you'll ever buy.
The channels that consistently win on economics (not CPL) are the ones where you control targeting precision. Outbound is a good example: when you build a tightly-defined ICP list and reach decision-makers directly with accurate data — using a domain search to map the right contacts at each target account — your CPQL stays low even though your raw CPL isn't the cheapest on the board.
What's the difference between CAC and payback period?#
CAC tells you how much a customer cost. Payback period tells you how long until that customer is profitable. You need both, and teams that track only CAC make a predictable error: they celebrate a low CAC while ignoring that those customers churn before they pay it back.
Analogy: CAC is the price of a fruit tree. Payback period is how many seasons until it produces enough fruit to cover the price. A cheap tree that dies in year one is worse than an expensive tree that fruits for a decade.
The formula chain is:
- CAC = (sales + marketing spend over a period) ÷ (new customers won in that period)
- Gross margin per customer = monthly revenue × gross margin %
- Payback period = CAC ÷ monthly gross margin per customer
If your CAC is $6,000 and a customer delivers $750/month in gross margin, payback is 8 months. Under 12 months is the rule of thumb most B2B SaaS investors use; HubSpot's benchmarking content and most RevOps playbooks land in the same range. Past 18 months and you're financing growth with cash you may not have.
The reason payback matters for lead generation specifically: a channel can produce a perfectly fine CAC while quietly attracting customers who churn fast. When you segment payback by lead source, the channel that looked great on CPL often turns out to be filling your funnel with poor-fit accounts.
How do you connect leads to revenue without an attribution mess?#
Attribution is where most measurement efforts go to die. You don't need a perfect model — you need a consistent one, applied the same way every quarter so trends are comparable.
Three workable approaches, from simplest to most rigorous:
- First-touch / last-touch single attribution. Crude but consistent. Good enough to rank channels when you're starting out. Pick one and stick with it.
- Multi-touch (linear or position-based). Spreads credit across the journey. More honest for long B2B cycles, but requires clean tracking on every touchpoint.
- Pipeline-weighted attribution. Credit channels by the value of opportunities they sourced, weighted by stage probability — not just closed deals. This handles long sales cycles where revenue lags lead gen by months.
The non-negotiable foundation under all three is identity resolution: every lead needs a clean, deduplicated record so the same person filling out two forms doesn't count as two leads with split credit. This is where data enrichment earns its keep — appending firmographic and contact data so a lead from a personal Gmail can be matched to the right company and the right account in your CRM. Without that, your attribution model is averaging noise.
A practical rule: measure attribution at the account level for B2B, not the lead level. Buying committees average 6–10 people. If you score channels by individual leads, you'll systematically under-credit the channels that reach senior decision-makers (who rarely fill out forms) and over-credit the ones that catch junior researchers.
What does a repeatable measurement loop look like?#
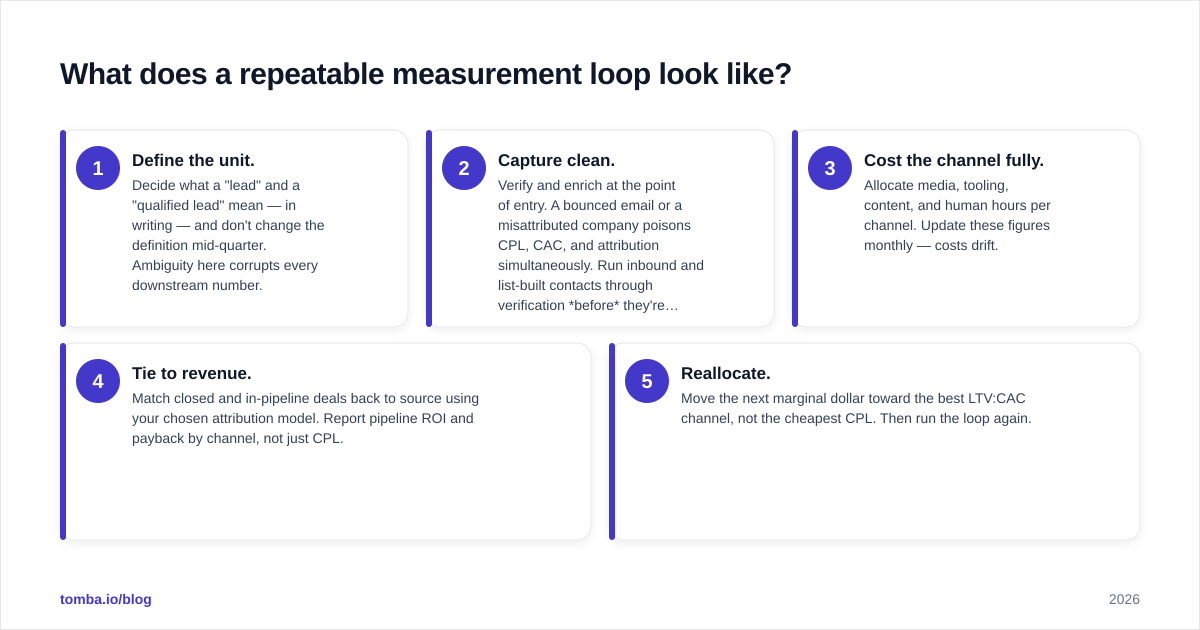
Stop treating measurement as a quarterly fire drill. Run it as a loop. Here's a five-step cycle you can operate every month:
- Define the unit. Decide what a "lead" and a "qualified lead" mean — in writing — and don't change the definition mid-quarter. Ambiguity here corrupts every downstream number.
- Capture clean. Verify and enrich at the point of entry. A bounced email or a misattributed company poisons CPL, CAC, and attribution simultaneously. Run inbound and list-built contacts through verification before they're counted.
- Cost the channel fully. Allocate media, tooling, content, and human hours per channel. Update these figures monthly — costs drift.
- Tie to revenue. Match closed and in-pipeline deals back to source using your chosen attribution model. Report pipeline ROI and payback by channel, not just CPL.
- Reallocate. Move the next marginal dollar toward the best LTV:CAC channel, not the cheapest CPL. Then run the loop again.
The teams that compound are the ones that close this loop fast. Salesforce's State of Sales research repeatedly finds that high-performing revenue teams differ less in the channels they use and more in how rigorously they measure and reallocate. Speed of feedback beats cleverness of strategy.
If you're scaling outbound and building large prospect lists, the economics are dominated by data quality and reach efficiency. A bulk email finder lets you build and validate a targeted list at known cost-per-contact, which makes your CPL and CPQL predictable instead of a guess — and predictable inputs are what make the whole measurement loop trustworthy.
What are the most common lead economics mistakes?#
- Optimizing CPL in isolation. The cheapest leads are usually the worst. Always pair CPL with a downstream quality or revenue metric.
- Ignoring data decay. B2B contact data goes stale at roughly 25–30% per year. Last quarter's clean list is this quarter's bounce rate. Re-verify before reuse.
- Counting unverified leads. Every fake or undeliverable lead inflates your numerator and flatters your CPL while taxing your sales team. Verify at capture.
- Changing definitions mid-stream. If "MQL" meant one thing in Q1 and another in Q2, your trend line is fiction.
- Reporting volume up the chain. Executives who see "leads up 40%" make budget decisions on a metric that may have zero correlation with revenue. Report pipeline ROI and payback instead.
Avoid these five and you're already ahead of most teams — not because the math is hard, but because discipline is rare.
The bottom line#
Lead generation economics rewards teams that count dollars, not form fills. Track CPL and CPQL to compare channels, CAC and payback to judge sustainability, and pipeline ROI to decide where the next dollar goes. The entire structure rests on clean data at the source — verified, enriched, deduplicated — because every economic metric is only as honest as the contact records feeding it.
That's where the right tooling pays for itself immediately. Tomba's Email Finder helps you build accurate, targeted prospect lists with known cost-per-contact, so your CPL is a number you can trust instead of a guess — and your whole measurement loop finally tells the truth. Start on the free tier (25 searches/month), and when the economics prove out, scale up from $49/month. See full Tomba pricing to match a plan to your volume.
// get started
Find, verify and enrich your first contacts today
Start on the free plan with 25 searches a month, then scale when your team is ready.
Free plan · No credit card required · GDPR & CCPA
// about the author