Market Sizing and Unit Economics: A 2026 GTM Playbook
Most GTM plans die on a guessed TAM and a fuzzy CAC. Here's how to size a market bottom-up and pressure-test unit economics before you spend a dollar.

Market sizing tells you whether a business is worth building. Unit economics tell you whether the one you built will survive contact with a spreadsheet. Get either wrong and your go-to-market plan is fiction with a budget attached.
This guide walks RevOps leaders, founders, and GTM strategists through both disciplines as a single connected system: how to size a market from the bottom up, how to model LTV, CAC, and payback honestly, and how to wire the two together so your board deck survives a hostile diligence call.
TL;DR#
- Market sizing and unit economics are two halves of the same question: is there enough addressable revenue, and can you capture it profitably?
- Bottom-up beats top-down. Counting real accounts and real ACV is harder than multiplying a Gartner number by 1%, but it's the only version investors trust in 2026.
- The three numbers that matter most are LTV:CAC ratio (aim ≥ 3:1), CAC payback period (aim < 12 months for SMB, < 18 for enterprise), and gross margin (the multiplier on everything).
- Your TAM is only as good as your account data. A clean, enriched list of target accounts is the raw material for a credible bottom-up model.
- Refresh the model quarterly. Markets move, CAC inflates, and a stale unit-economics model is a slow-motion fundraising failure.
What is market sizing, really?#
Market sizing is the disciplined estimate of how much revenue exists for a product, segmented into what's theoretically available, what you can realistically serve, and what you can plausibly win. The standard framing is TAM, SAM, and SOM.
- TAM (Total Addressable Market): every dollar that would be spent on your category if every possible buyer bought from someone. Think of it as the size of the whole ocean.
- SAM (Serviceable Addressable Market): the slice your product, pricing, geography, and compliance posture can actually serve. The part of the ocean your boat can reach.
- SOM (Serviceable Obtainable Market): the realistic catch over a defined window given your sales capacity and competition. What you'll actually haul in this year.
The mistake almost everyone makes is starting at the top — quoting a giant analyst figure and applying an arbitrary percentage. Investors have seen that movie. The credible move is to build from the bottom and let TAM be a sanity check, not the headline.
Top-down vs bottom-up: which market sizing method wins?#
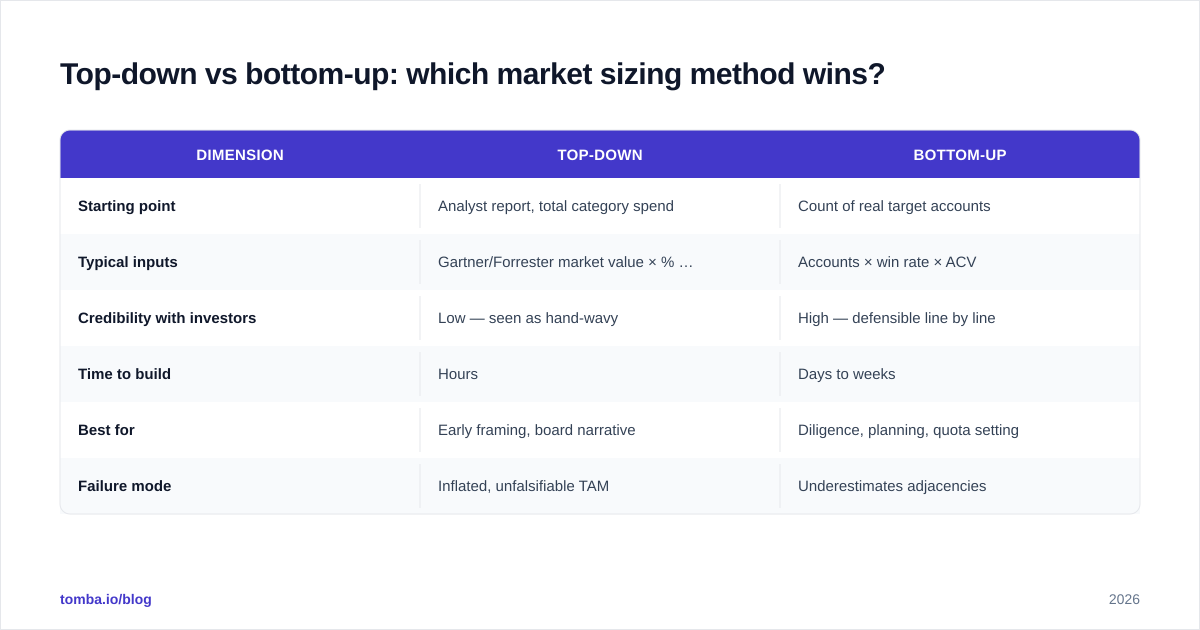
Both methods have a place, but they answer different questions and carry very different credibility.
| Dimension | Top-down | Bottom-up |
|---|---|---|
| Starting point | Analyst report, total category spend | Count of real target accounts |
| Typical inputs | Gartner/Forrester market value × % capture | Accounts × win rate × ACV |
| Credibility with investors | Low — seen as hand-wavy | High — defensible line by line |
| Time to build | Hours | Days to weeks |
| Best for | Early framing, board narrative | Diligence, planning, quota setting |
| Failure mode | Inflated, unfalsifiable TAM | Underestimates adjacencies |
A defensible 2026 model uses bottom-up as the spine and top-down as a guardrail. If your bottom-up SOM is larger than the entire top-down SAM, one of your assumptions is broken. If it's a rounding error against TAM, you have room to grow but should explain the constraint.
The bottom-up formula in its simplest form:
SOM = (number of reachable accounts) × (annual win rate) × (average contract value)
Each term is an evidence claim you have to defend. "Number of reachable accounts" is where your data operation earns its keep — you need an actual count of companies matching your ICP, not a vibe. Pulling firmographics with data enrichment and building an account list from a B2B database turns "we think there are about 40,000 of these" into "there are 38,412, here they are, filtered by employee count and tech stack."
For the canonical definitions, Wikipedia's entry on Total Addressable Market is a clean reference, and Gartner's market research methodology explains how the top-down numbers you'll cite are actually produced.

How do you build a bottom-up TAM in practice?#
Here's the workflow that survives diligence, step by step.
- Define the ICP precisely. Industry, employee band, revenue band, geography, and any disqualifiers (regulated, on-prem only, etc.). Vague ICPs produce vague TAMs.
- Count the accounts that match. Use a firmographic database or enrichment API to return an actual list. This is your serviceable universe.
- Assign realistic ACV by segment. SMB, mid-market, and enterprise rarely share a price. Model them separately.
- Apply a defensible win rate. Pull it from your CRM history if you have it; benchmark conservatively if you don't.
- Layer in time. SOM is annual. Spreading capture across a 3–5 year horizon shows the ramp without overstating year one.
- Stress-test against top-down. If your numbers exceed the analyst category, find the error.
The output isn't a single number — it's a model with named assumptions you can flex. When a board member asks "what if win rate is half that?", you change one cell and the whole thing recalculates. That's the difference between a sizing exercise and a slide.
What are unit economics, and why do they break GTM plans?#
Unit economics describe the revenue and cost of a single customer relationship over its lifetime. They answer the question a big TAM can't: if you spend a dollar acquiring a customer, do you get more than a dollar back, and how fast?
A huge market with broken unit economics is a machine for burning cash faster. A modest market with excellent unit economics is a quietly profitable business. Investors in 2026 reward the second profile far more than they did in the cheap-capital years.
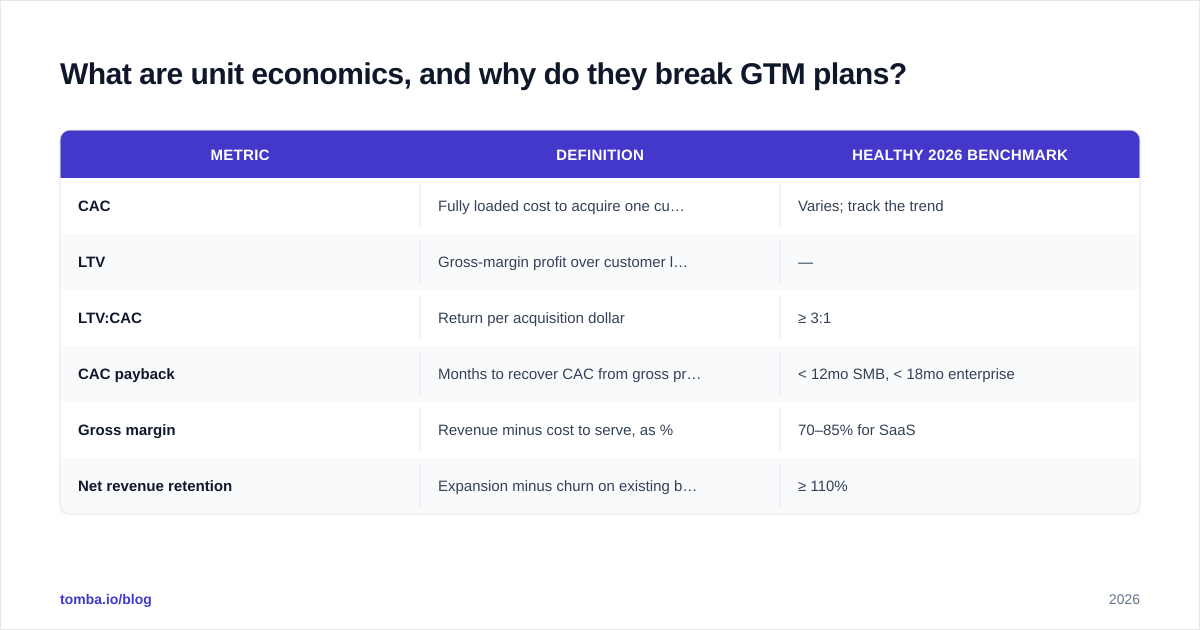
The core metrics:
| Metric | Definition | Healthy 2026 benchmark |
|---|---|---|
| CAC | Fully loaded cost to acquire one customer | Varies; track the trend |
| LTV | Gross-margin profit over customer lifetime | — |
| LTV:CAC | Return per acquisition dollar | ≥ 3:1 |
| CAC payback | Months to recover CAC from gross profit | < 12mo SMB, < 18mo enterprise |
| Gross margin | Revenue minus cost to serve, as % | 70–85% for SaaS |
| Net revenue retention | Expansion minus churn on existing base | ≥ 110% |
For the formula details and common pitfalls, HubSpot's breakdown of LTV and CAC is a solid practitioner reference, and the Wikipedia entry on customer lifetime value covers the discounting math most quick models skip.
Calculating LTV without fooling yourself#
The lazy LTV formula is ARPA / churn. It's fine for a back-of-envelope, but it ignores gross margin and inflates the number. Use:
LTV = (ARPA × gross margin %) × (1 / monthly churn rate)
If you charge $500/month, run 80% gross margin, and lose 2% of customers monthly, your LTV is ($500 × 0.80) × (1 / 0.02) = $20,000. Note how the margin term cuts a naive $25,000 estimate down to the truth. Founders who skip the margin multiplier are the ones surprised when the bank balance disagrees with the model.
Calculating CAC honestly#
Fully loaded CAC includes sales salaries, marketing spend, tooling, and the SDR coffee budget — not just ad spend. The number people quote and the number that's true are usually 2–3x apart. Divide total go-to-market cost in a period by new customers acquired in that period.
How do market sizing and unit economics connect?#
They're a feedback loop, not two separate slides. Your SOM sets the revenue ceiling; your unit economics determine how much you can spend to reach it and how fast you can scale.

Here's the connective tissue:
- CAC caps your reachable SOM. If acquiring a customer costs more than they're worth, accounts that look "addressable" aren't economically reachable. Your true SOM shrinks to the segment where the math works.
- LTV justifies your CAC budget. A 3:1 LTV:CAC means you can afford to spend a third of lifetime value on acquisition — which determines how aggressively you can pursue the SOM.
- Payback period sets your growth speed. Short payback lets you recycle cash into more acquisition quickly. Long payback means you need more capital to capture the same SOM.
The practical implication: when you tighten your ICP to the segment with the best unit economics, your SAM gets smaller but your capturable SOM often gets bigger, because every dollar works harder. Counterintuitive, and exactly why the two models have to be built together.
What data do you need to make these models real?#
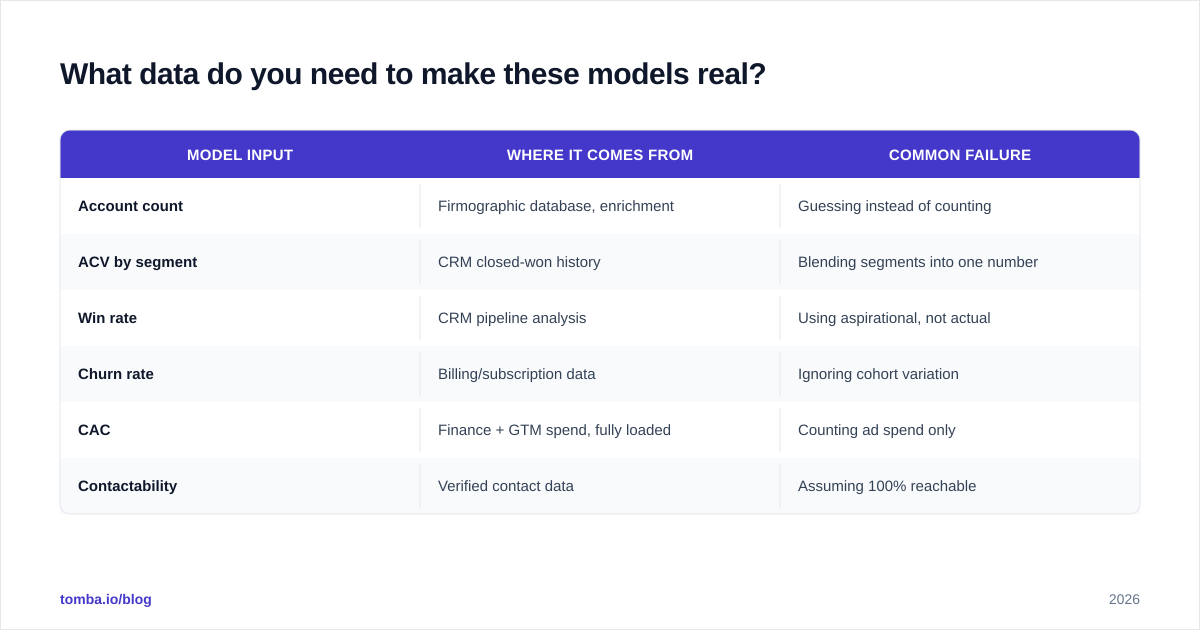
A model is only as honest as its inputs. The recurring failure is treating market sizing as a creative-writing exercise instead of a data problem. Here's what each part demands.
| Model input | Where it comes from | Common failure |
|---|---|---|
| Account count | Firmographic database, enrichment | Guessing instead of counting |
| ACV by segment | CRM closed-won history | Blending segments into one number |
| Win rate | CRM pipeline analysis | Using aspirational, not actual |
| Churn rate | Billing/subscription data | Ignoring cohort variation |
| CAC | Finance + GTM spend, fully loaded | Counting ad spend only |
| Contactability | Verified contact data | Assuming 100% reachable |
That last row matters more than people admit. Your SOM assumes you can actually reach the accounts you counted. If 30% of your target list has stale or unverifiable contact data, your real obtainable market is smaller than your spreadsheet claims. Building your account universe on a verified B2B database and confirming you can reach decision-makers with a reliable email finder is the difference between a SOM you can sell into and one you can only present.
When you tighten the loop — enrich accounts, verify reachability, feed real ACV and churn back into the model — market sizing stops being a fundraising prop and becomes an operating tool that drives territory design, quota setting, and budget allocation.
How often should you refresh the model?#
Quarterly at minimum, and any time a core assumption moves. Markets are not static, and CAC in particular has a habit of inflating quietly as your best channels saturate.
A practical cadence:
- Monthly: track CAC and payback against plan. These move fast.
- Quarterly: rebuild win rate and churn from fresh CRM cohorts; re-pull the account universe to catch new entrants and dead companies.
- Annually: revisit ICP and segment ACV; rerun the full bottom-up TAM.
A model with a 2024 timestamp in a 2026 board meeting tells investors you stopped paying attention. Keep the assumptions dated and visible.
Common mistakes that sink the model#
- Quoting TAM as the headline. A $50B TAM with no path to capture it is a red flag, not a selling point.
- Naive LTV. Skipping the gross-margin multiplier overstates LTV and flatters LTV:CAC.
- Partial CAC. Counting only paid media hides the true cost of your motion.
- Ignoring contactability. Counting accounts you can't actually reach inflates SOM.
- Set-and-forget. A model built once and never refreshed decays into fiction.
- One blended segment. SMB and enterprise have different ACV, CAC, and churn. Modeling them as one average hides where the business actually works.
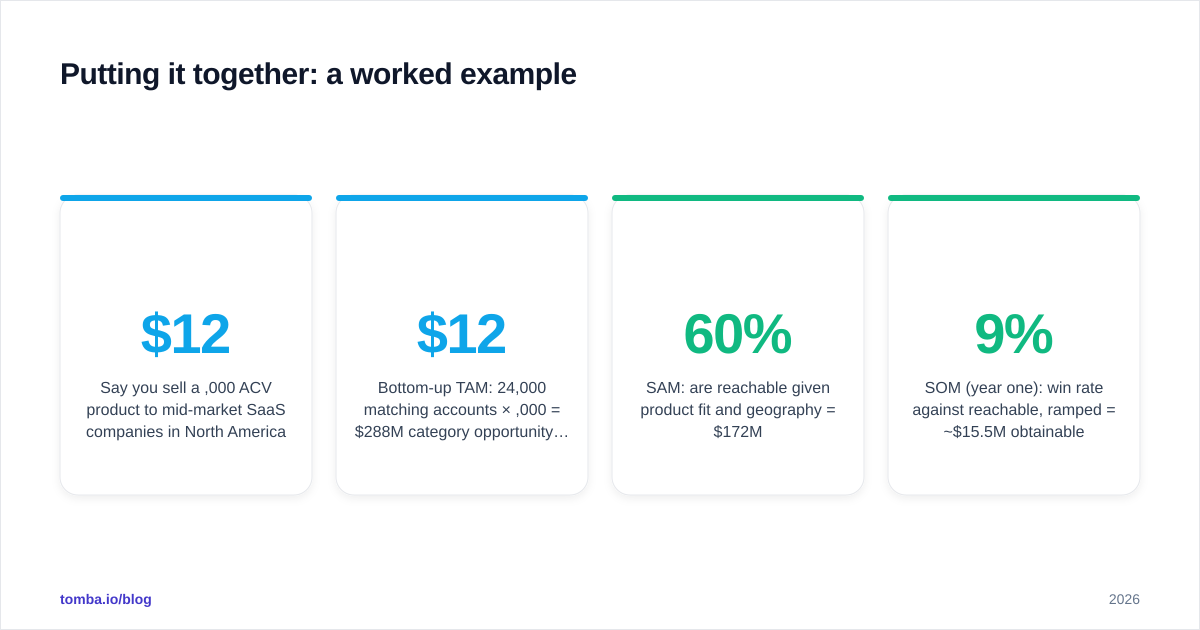
Putting it together: a worked example#
Say you sell a $12,000 ACV product to mid-market SaaS companies in North America.
- Bottom-up TAM: 24,000 matching accounts × $12,000 = $288M category opportunity for your slice.
- SAM: 60% are reachable given product fit and geography = $172M.
- SOM (year one): 9% win rate against reachable, ramped = ~$15.5M obtainable.
- Unit economics: $9,600 gross-margin LTV per year × 4-year life = ~$38,400 LTV; CAC of $11,000 → LTV:CAC ≈ 3.5:1; payback ≈ 14 months.
Now the models talk to each other: the 3.5:1 ratio says you can afford to chase the full reachable SAM, but the 14-month payback says you need enough capital to fund the gap. Tighten the ICP to the segment where CAC drops to $8,000 and payback falls under 12 months, and you can scale acquisition faster even though the SAM is smaller. That trade-off is invisible unless both models sit on the same page.
The bottom line#
Market sizing without unit economics is optimism. Unit economics without market sizing is a calculator with nowhere to point. Built together — bottom-up, data-backed, refreshed every quarter — they become the operating system for your entire go-to-market motion, from revenue operations planning to territory design to the fundraising narrative.
The hard part isn't the formulas. It's the data underneath them: a real count of real accounts, verified as reachable, with honest ACV and churn fed back from your CRM.
That's where Tomba fits. Use the Tomba Email Finder to turn your bottom-up account list into a verified, reachable target universe — so the SOM in your model is the SOM you can actually sell into. Pair it with enrichment and the B2B database to keep every assumption grounded in current data, and check Tomba pricing to find the plan that matches your sizing workload. A market sizing model is only as good as the accounts behind it. Make them real.
// get started
Find, verify and enrich your first contacts today
Start on the free plan with 25 searches a month, then scale when your team is ready.
Free plan · No credit card required · GDPR & CCPA
// about the author