Sales Automation Reporting in 2026: Tools, Metrics & Setup
Stop building dashboards by hand. Here is how sales automation reporting turns raw CRM activity into pipeline visibility, the metrics that matter, and the tools that get you there in 2026.
TL;DR
- Sales automation reporting replaces manual spreadsheet exports with live, rules-driven dashboards that pull straight from your CRM and activity tools.
- The highest-leverage reports are pipeline coverage, conversion-by-stage, activity-to-outcome, and forecast accuracy — not vanity activity counts.
- Bad input data quietly breaks every report downstream, so contact accuracy and deduplication matter more than dashboard design.
- Native CRM reporting works to a point; dedicated BI and RevOps tooling take over when you need cross-system joins and attribution.
- Start with one source of truth, three core reports, and a weekly review cadence before you buy anything fancy.
What is sales automation reporting?#
Sales automation reporting is the practice of collecting sales activity and pipeline data automatically, then turning it into dashboards and scheduled reports without anyone copy-pasting from a CRM into a spreadsheet.
Think of it like the dashboard in your car. You do not pop the hood and measure fuel with a dipstick every morning — a sensor does it continuously and shows you a number you can trust at a glance. Sales automation reporting is that sensor layer for revenue: it watches deals, emails, calls, and meetings as they happen and surfaces the numbers a manager actually needs to make a decision.
Technically, it sits on three layers: a data layer (your CRM, email tool, dialer, and enrichment sources), a transformation layer (rules that clean, join, and aggregate that data), and a presentation layer (dashboards, scheduled emails, and alerts). When people say "our reporting is broken," the problem is almost always in the first two layers, not the charts.
This matters because reps spend a shocking amount of time on admin. Salesforce's own State of Sales research has repeatedly found sellers spend the majority of their week on non-selling tasks, and manual reporting is a big slice of that. Automating it gives time back and — more importantly — gives leadership numbers they can actually believe.
Why does manual sales reporting break down?#
Manual reporting fails for the same reason hand-copied ledgers failed: humans are slow, inconsistent, and busy. Three failure modes show up again and again.
It is always stale. A spreadsheet is a photograph of a moment that has already passed. By the time a rep finishes pasting last week's numbers, three deals have moved stage and one has been lost. Decisions made on Monday's export are decisions made on Thursday's reality.
It hides the truth in formatting. Every rep tracks "next steps" or "close date" slightly differently. When you roll those up by hand, you smooth over the disagreements instead of exposing them. The forecast looks clean and is quietly wrong.
It does not scale. One rep and twenty deals is manageable in a sheet. Ten reps and four hundred deals is not. The effort grows faster than the team, so reporting either eats a RevOps person's whole week or simply stops happening.

The fix is not "try harder in Excel." It is to move the collection and transformation into a system that never gets tired, then let people spend their judgment on what the numbers mean.
Which sales reports actually drive decisions?#
Most teams over-index on activity counts because they are easy to measure. Calls dialed and emails sent feel like progress, but they answer the wrong question. The reports that change behavior tie activity to outcomes and money.
Here are the core reports worth automating first:
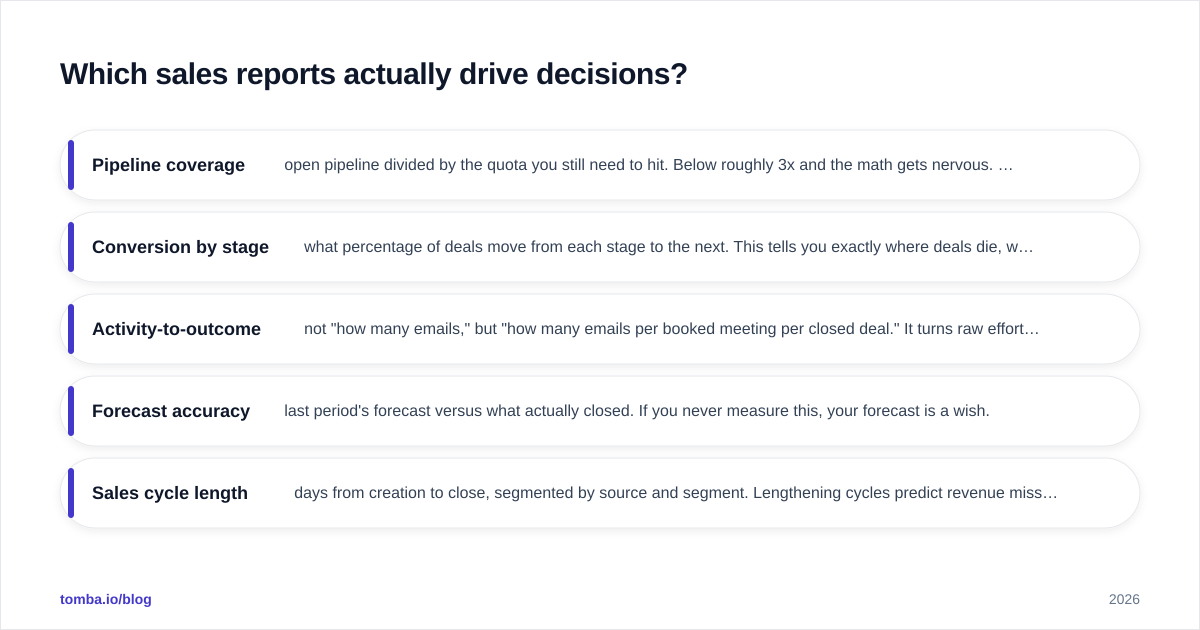
- Pipeline coverage — open pipeline divided by the quota you still need to hit. Below roughly 3x and the math gets nervous. This is your single best early-warning signal.
- Conversion by stage — what percentage of deals move from each stage to the next. This tells you exactly where deals die, which is where coaching and content should go.
- Activity-to-outcome — not "how many emails," but "how many emails per booked meeting per closed deal." It turns raw effort into an efficiency ratio.
- Forecast accuracy — last period's forecast versus what actually closed. If you never measure this, your forecast is a wish.
- Sales cycle length — days from creation to close, segmented by source and segment. Lengthening cycles predict revenue misses weeks before they appear in bookings.
A useful frame: a metric earns a place on the dashboard only if someone would do something differently when it moves. If a number changes and nobody acts, it is decoration. For deeper definitions of how these connect to broader goals, the revenue operations discipline treats reporting as the connective tissue between marketing, sales, and customer success — which is exactly the altitude you want these reports to live at.
What does a sales automation reporting stack look like?#
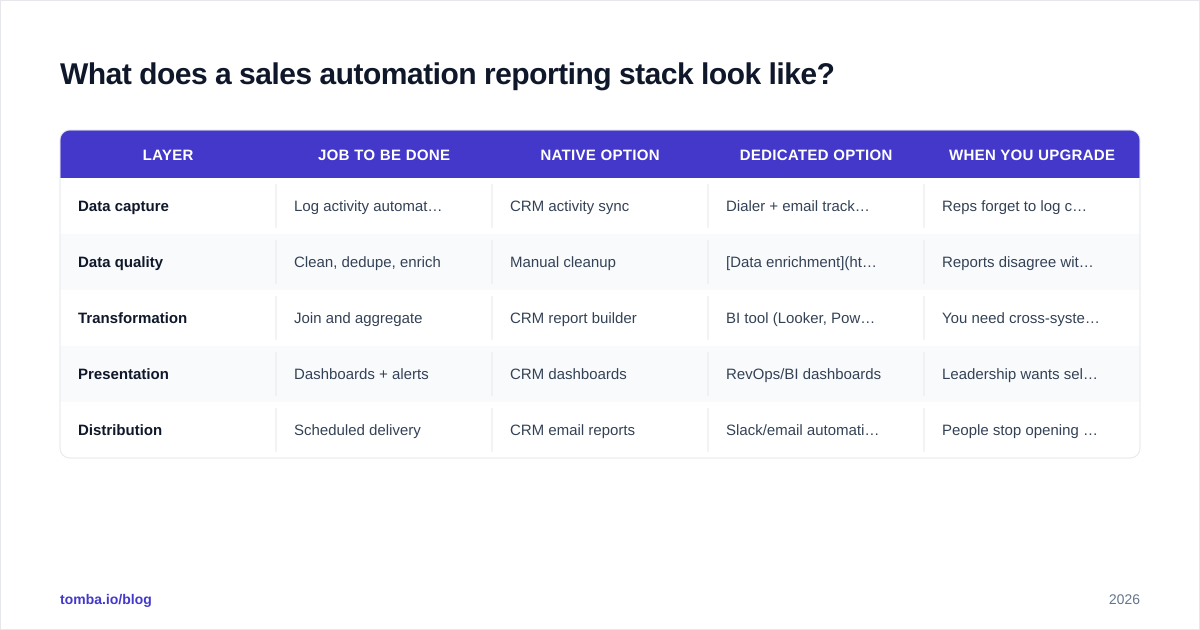
There is no single tool — it is a stack of jobs to be done. You can fill each job with a native feature or a dedicated product, and the right answer depends on team size and how many systems you have to join.
| Layer | Job to be done | Native option | Dedicated option | When you upgrade |
|---|---|---|---|---|
| Data capture | Log activity automatically | CRM activity sync | Dialer + email tracking | Reps forget to log calls |
| Data quality | Clean, dedupe, enrich | Manual cleanup | Data enrichment + dedupe rules | Reports disagree with reality |
| Transformation | Join and aggregate | CRM report builder | BI tool (Looker, Power BI) | You need cross-system joins |
| Presentation | Dashboards + alerts | CRM dashboards | RevOps/BI dashboards | Leadership wants self-serve |
| Distribution | Scheduled delivery | CRM email reports | Slack/email automation | People stop opening the CRM |
The mistake teams make is buying the presentation layer first — a shiny BI tool — while the data-quality layer is a swamp. A beautiful dashboard built on duplicated, half-enriched records just makes wrong numbers more convincing. Fix capture and quality before you spend on visualization.
If you live inside one CRM, native reporting goes further than people expect. HubSpot's reporting tools and Salesforce dashboards both handle pipeline and conversion reporting well out of the box. You graduate to a dedicated BI layer when you need to join CRM data with product usage, billing, or marketing data that does not live in the same place.
Native CRM reporting vs dedicated tools: which should you pick?#
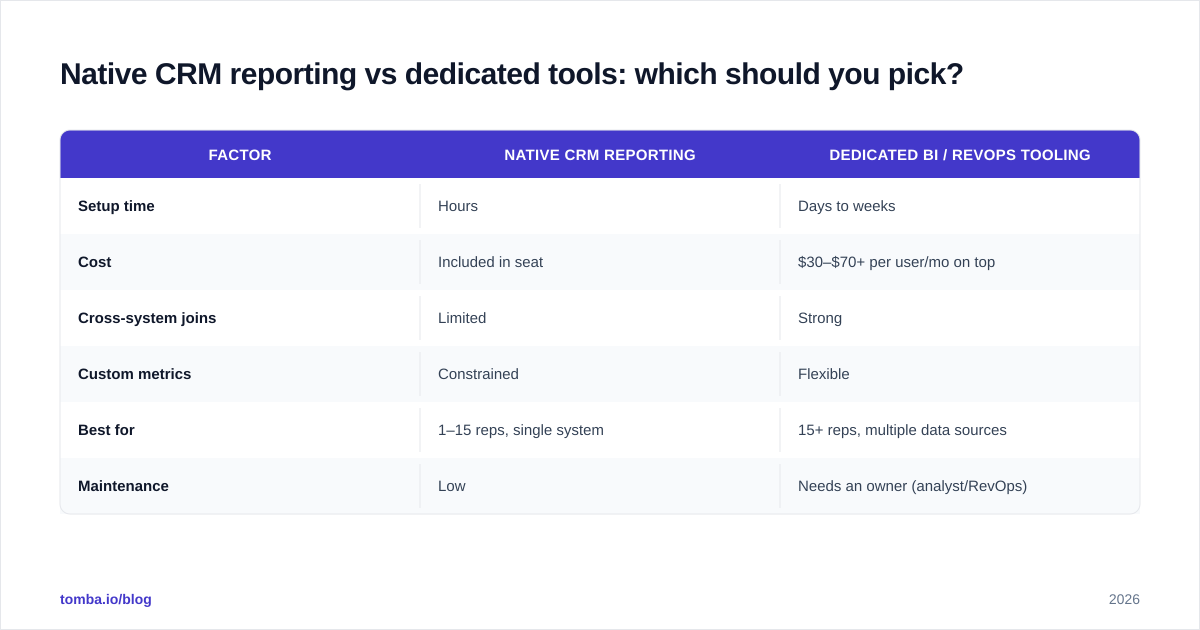
Pick native CRM reporting until the joins hurt; then add a dedicated layer on top — do not rip and replace.
| Factor | Native CRM reporting | Dedicated BI / RevOps tooling |
|---|---|---|
| Setup time | Hours | Days to weeks |
| Cost | Included in seat | $30–$70+ per user/mo on top |
| Cross-system joins | Limited | Strong |
| Custom metrics | Constrained | Flexible |
| Best for | 1–15 reps, single system | 15+ reps, multiple data sources |
| Maintenance | Low | Needs an owner (analyst/RevOps) |
Native tools win on speed and cost and are perfectly good for most teams under fifteen reps on a single CRM. The moment you are stitching together CRM, a separate sequencing tool, a dialer, and product data, a dedicated layer pays for itself — but only if you have someone to own it. An unowned BI tool decays into a graveyard of broken dashboards within a quarter. Cross-checking options on a review site like G2 before you commit is worth the hour; the category moves fast and pricing shifts often.

How do you set up sales automation reporting step by step?#
Treat this like wiring a house: get the foundation and the cabling right before you hang the light fixtures. Here is a sequence that does not collapse later.
1. Pick one source of truth. Your CRM is almost always it. Every other tool feeds into it; nothing reports independently. The instant you have two systems each claiming to hold "the real number," you have lost.
2. Fix the input data. Reports are only as honest as the records under them. Standardize stage definitions, set required fields at each stage, and deduplicate ruthlessly. If your contact data is stale or missing, even perfect dashboards will mislead — which is where keeping records current with accurate contact data and data enrichment earns its keep before any chart gets built.
3. Automate capture. Turn on email and calendar sync so meetings and replies log themselves. Connect your dialer. The goal is that a rep doing their job generates clean data as a side effect, with zero manual logging.
4. Build three reports, not thirty. Start with pipeline coverage, conversion by stage, and forecast accuracy. Resist the urge to chart everything. A focused dashboard that people read beats a comprehensive one they ignore.
5. Automate distribution. Schedule the dashboard to land in the team's inbox or Slack every Monday morning, and set alerts for the two or three thresholds that demand action — coverage dropping below 3x, a stage conversion falling off a cliff.
6. Review on a cadence. A report nobody reviews is theatre. Put a 30-minute weekly pipeline review on the calendar where the numbers drive the conversation. The cadence is what turns data into decisions.
If your CRM is Salesforce or Pipedrive, connecting your prospecting data in cleanly matters as much as the reports themselves — see how a tool like Tomba's Salesforce integration keeps the records that feed reporting accurate from the first touch, so you are not reporting on garbage.
What are the most common sales reporting mistakes?#
The failure patterns are predictable, which is good news — you can design around them.
Measuring activity instead of outcomes. A leaderboard of calls made rewards dialing, not selling. Tie every activity metric to a downstream result or drop it.
Reporting on dirty data. Duplicates inflate pipeline, stale contacts crater connect rates, and missing fields break segmentation. Quality is upstream of every report; budget time for it accordingly. Tracking something like response rate is meaningless if half your contacts bounce.
Too many dashboards. When everything is highlighted, nothing is. One canonical dashboard per role beats fifteen niche ones.
No owner. Reporting infrastructure rots without a named owner — usually RevOps or a sales ops analyst. Assign it, or watch it decay.
Confusing a forecast with a report. A report describes what happened; a forecast predicts what will. Automate the report so humans can spend their judgment on the forecast — that is the whole point of sales automation in the first place.
According to industry analysts like Gartner, the teams that win on forecast accuracy are not the ones with the fanciest tools — they are the ones with the cleanest, most consistent inputs and a disciplined review rhythm. The tooling amplifies the discipline; it does not replace it.
How does data quality affect reporting accuracy?#
Data quality is the foundation, not a footnote — every report inherits the errors in its source records. A dashboard cannot un-corrupt a duplicated account or invent a missing email. Garbage in, garbage on the screen.
Three quality dimensions move the needle most:
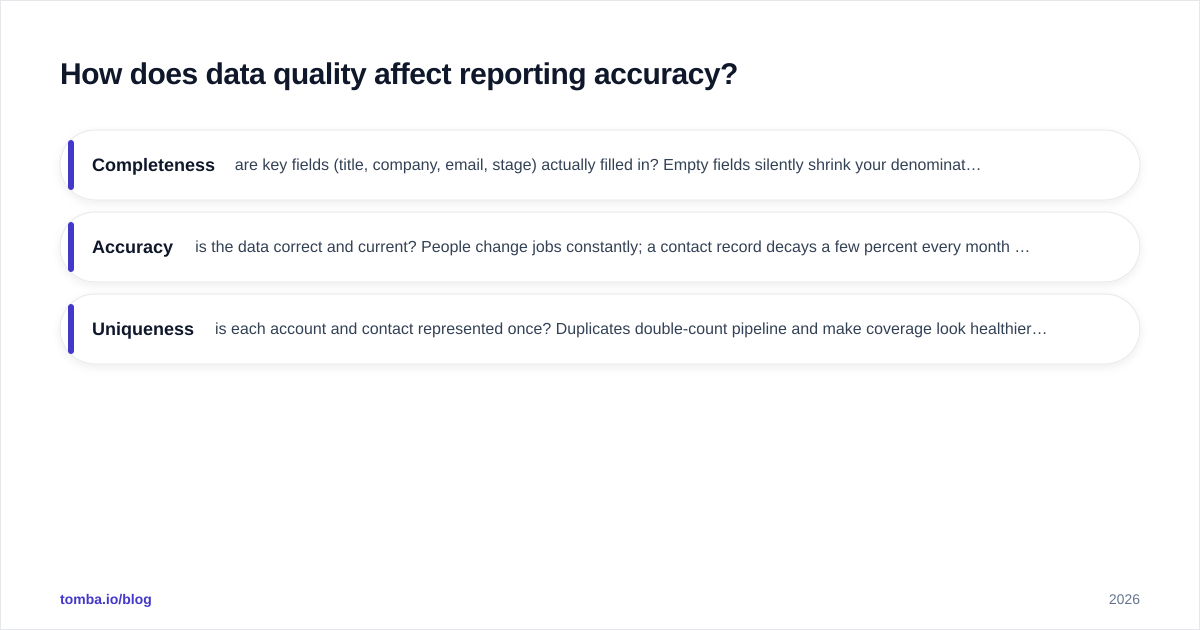
- Completeness — are key fields (title, company, email, stage) actually filled in? Empty fields silently shrink your denominators and skew every conversion rate.
- Accuracy — is the data correct and current? People change jobs constantly; a contact record decays a few percent every month it sits untouched.
- Uniqueness — is each account and contact represented once? Duplicates double-count pipeline and make coverage look healthier than it is.
The cheapest place to fix all three is at the point of entry. Verifying and enriching contact data as it enters the CRM — rather than scrubbing it in a panic before a board meeting — keeps reporting honest by default. Clean inputs are the unglamorous secret behind every dashboard that leadership actually trusts.
Build reporting on data you can trust#
The best dashboard in the world is only as good as the records feeding it — and most reporting problems are really data problems wearing a costume. Before you invest in BI tools and elaborate visualizations, make sure the contacts and accounts in your CRM are accurate, complete, and de-duplicated.
That is where Tomba Email Finder fits into your reporting stack: it helps you populate and refresh your CRM with verified, accurate contact data so every pipeline report, conversion rate, and forecast is built on a foundation you can defend. Start on the free tier (25 searches a month), and when you are ready to scale clean data across the team, the Starter plan at $49/mo opens up the volume most growing sales teams need. Get the inputs right, automate the reports, and spend your judgment where it actually matters — on the deals.
Ready to find emails that actually work?
Join 150,000+ professionals who stopped guessing and started sending. Free credits on signup — no credit card required.
Get the Tomba newsletter
Practical outbound tactics and product updates — once every two weeks.
About the author