Average SaaS Commission Rate in 2026: Models & Benchmarks
The average SaaS commission rate hovers near 10% of revenue, but the real number depends on role, deal size, and pay model. Here are the 2026 benchmarks and how to set rates that actually close deals.
Setting commission rates by gut feel is how you end up overpaying your worst reps and losing your best ones. If you run a SaaS sales team, you need a defensible number — one that maps to your margins, your sales cycle, and what the rest of the market pays. This guide gives you the 2026 benchmarks and the math behind them.
TL;DR#
- The average SaaS commission rate is roughly 10% of the revenue a rep closes, but it ranges from 5% to 15% depending on role, deal size, and product margin.
- Most SaaS teams run a 50/50 OTE split — half base salary, half variable commission — for quota-carrying Account Executives.
- SDRs/BDRs earn smaller commission percentages (often a fixed bounty per meeting or 5–8% of influenced pipeline) because they don't own the close.
- Commission rate is only half the story — your OTE, quota, and accelerators decide whether 10% is generous or stingy.
- Pipeline quality drives payout more than the percentage itself. Reps paid on bad data hit quota less often, so clean contact data quietly raises your effective commission ROI.
What is the average SaaS commission rate?#
The short answer: about 10% of closed revenue for a quota-carrying Account Executive. That figure is the most-cited industry benchmark and a sensible default if you're building a plan from scratch.
But "10%" hides a lot of variation. Think of commission rate like a restaurant tip — "around 18%" is the norm, yet the actual number swings based on service, party size, and the city you're in. In SaaS, the swing comes from three levers: the role, the deal size, and the gross margin of what you sell.
A high-margin product (80%+ gross margin, typical for pure software) can afford to pay reps more generously than a hardware-plus-software bundle running 40% margins. Likewise, a rep closing $5,000 annual contracts on high volume gets a different structure than one chasing six-figure enterprise deals over nine-month cycles.
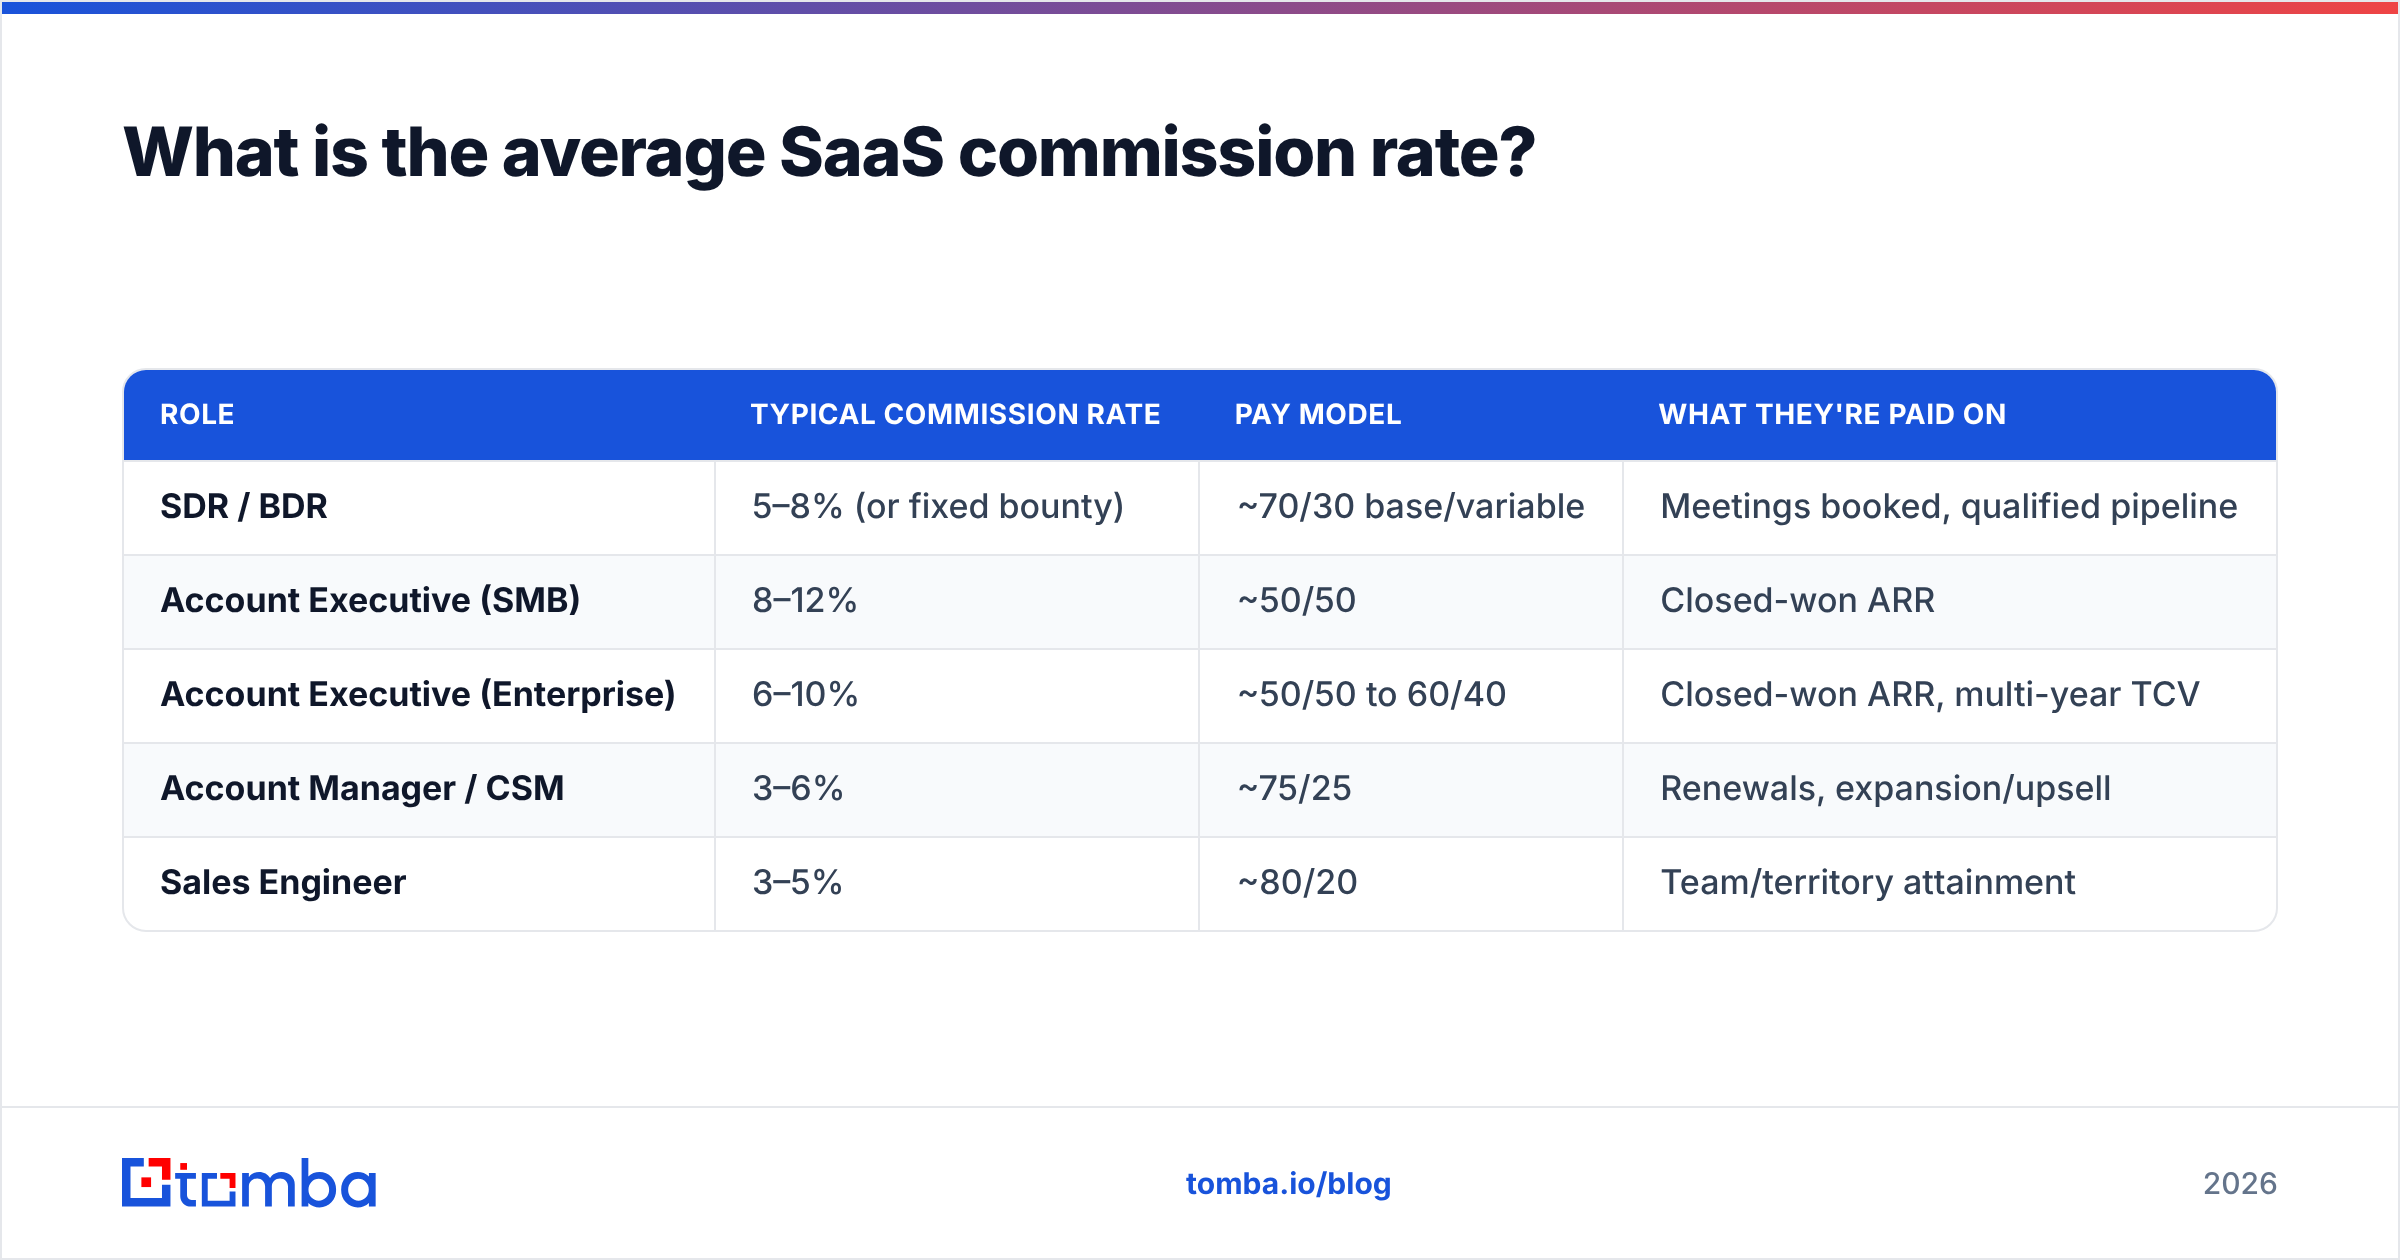
Here's how the average commission rate breaks down by role in 2026:
| Role | Typical commission rate | Pay model | What they're paid on |
|---|---|---|---|
| SDR / BDR | 5–8% (or fixed bounty) | ~70/30 base/variable | Meetings booked, qualified pipeline |
| Account Executive (SMB) | 8–12% | ~50/50 | Closed-won ARR |
| Account Executive (Enterprise) | 6–10% | ~50/50 to 60/40 | Closed-won ARR, multi-year TCV |
| Account Manager / CSM | 3–6% | ~75/25 | Renewals, expansion/upsell |
| Sales Engineer | 3–5% | ~80/20 | Team/territory attainment |
Note the pattern: the closer a role sits to the signature, the higher the commission percentage and the larger the variable slice of pay.
How does commission rate connect to OTE and quota?#
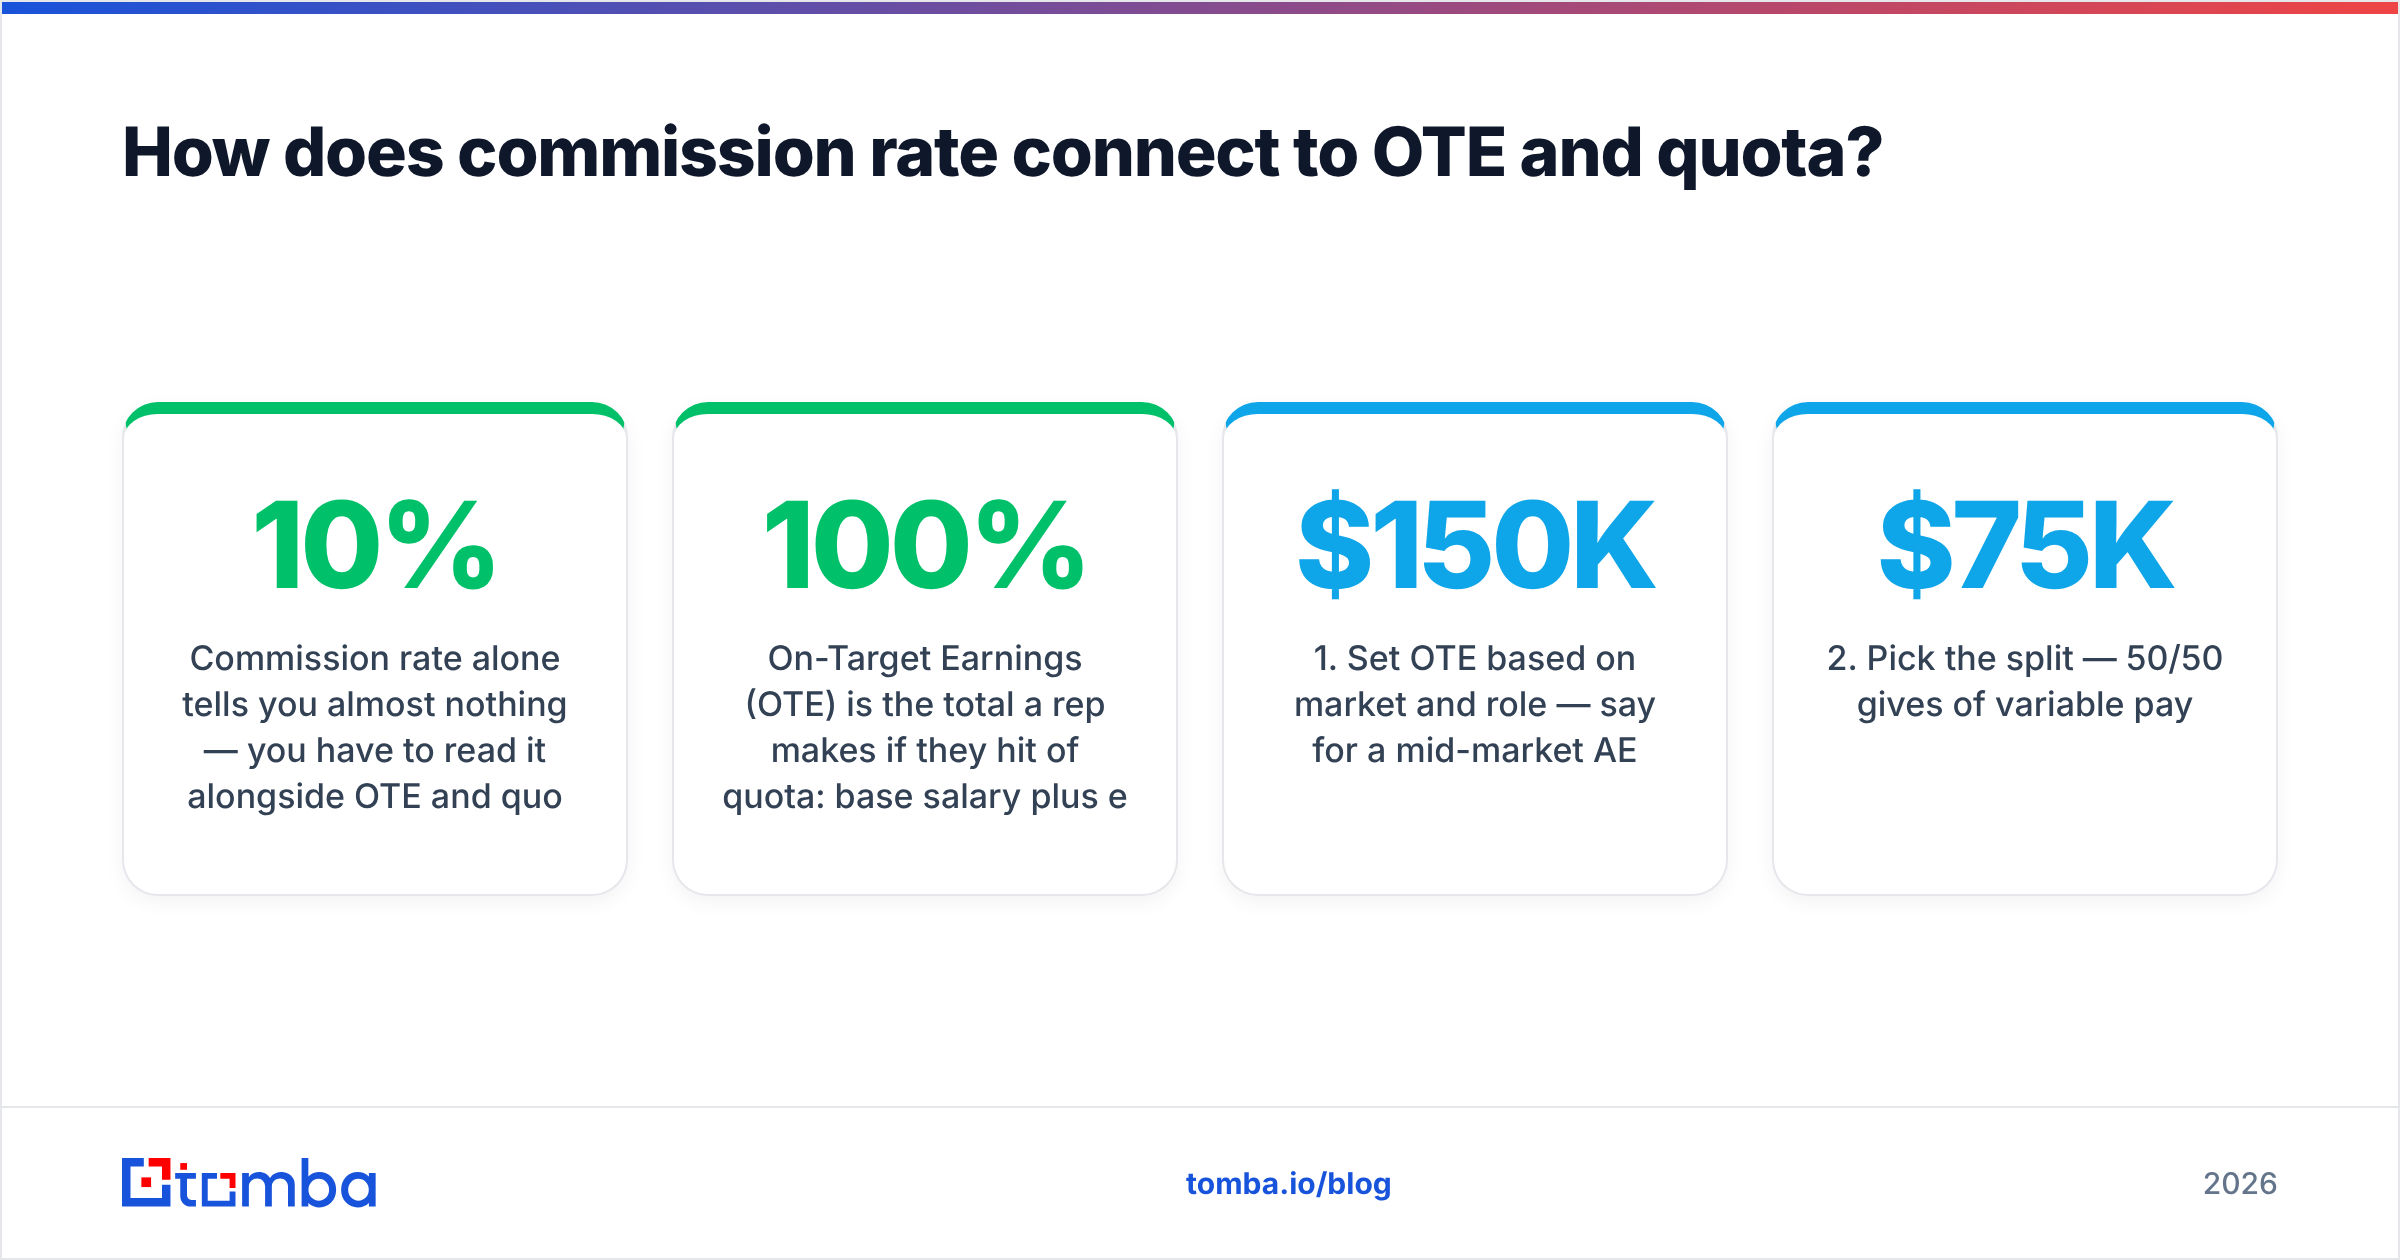
Commission rate alone tells you almost nothing — you have to read it alongside OTE and quota. A 10% rate on a $1M quota is a very different job than a 10% rate on a $400K quota.
On-Target Earnings (OTE) is the total a rep makes if they hit 100% of quota: base salary plus expected commission. The standard SaaS structure is a 50/50 split, meaning a rep with a $150K OTE earns $75K base and is expected to earn $75K in commission at full attainment.
Work the math backward and the commission rate falls out of it:
- Set OTE based on market and role — say $150K for a mid-market AE.
- Pick the split — 50/50 gives $75K of variable pay.
- Assign quota — a common rule of thumb is a 5:1 quota-to-OTE ratio, so this rep carries ~$750K in annual quota.
- Derive the rate — $75K variable ÷ $750K quota = 10% commission rate.
That's why 10% recurs so often: it's the natural output of a 50/50 split and a 5:1 quota ratio. Change either input and the "average" rate moves. A team running a 6:1 quota ratio at the same OTE lands closer to an 8% rate; a 4:1 ratio pushes it toward 12.5%.

For more on the metrics that frame any comp plan, the concept of win rate is worth understanding — a low win rate quietly inflates the effective cost of every point of commission you pay.
What are the most common SaaS commission structures?#
The rate is the number; the structure is how you apply it. These five models cover the vast majority of SaaS teams.
- Flat-rate commission. Every closed deal pays the same percentage — a clean 10% regardless of size. Easy to explain, easy to forecast, and the right default for early-stage teams. The downside: it doesn't push reps toward your most strategic deals.
- Tiered commission. The rate climbs as reps pass attainment thresholds. A rep might earn 8% up to quota, then 12% on everything above it. This is the most popular structure for scaling SaaS because it rewards overperformance without overpaying laggards.
- Accelerators. A close cousin of tiers, accelerators multiply the rate (often 1.5x–3x) once a rep blows past 100%. They're how top reps earn 200%+ of OTE and why your best closers stay.
- Gross-margin commission. Reps are paid on profit, not revenue. Common when deals include services, discounting authority, or variable-cost components — it stops reps from buying the deal with margin.
- Multiplier/quota-relief models. Reps earn relief or bonus multipliers for strategic outcomes: multi-year contracts, new-logo acquisition, or landing a target account.
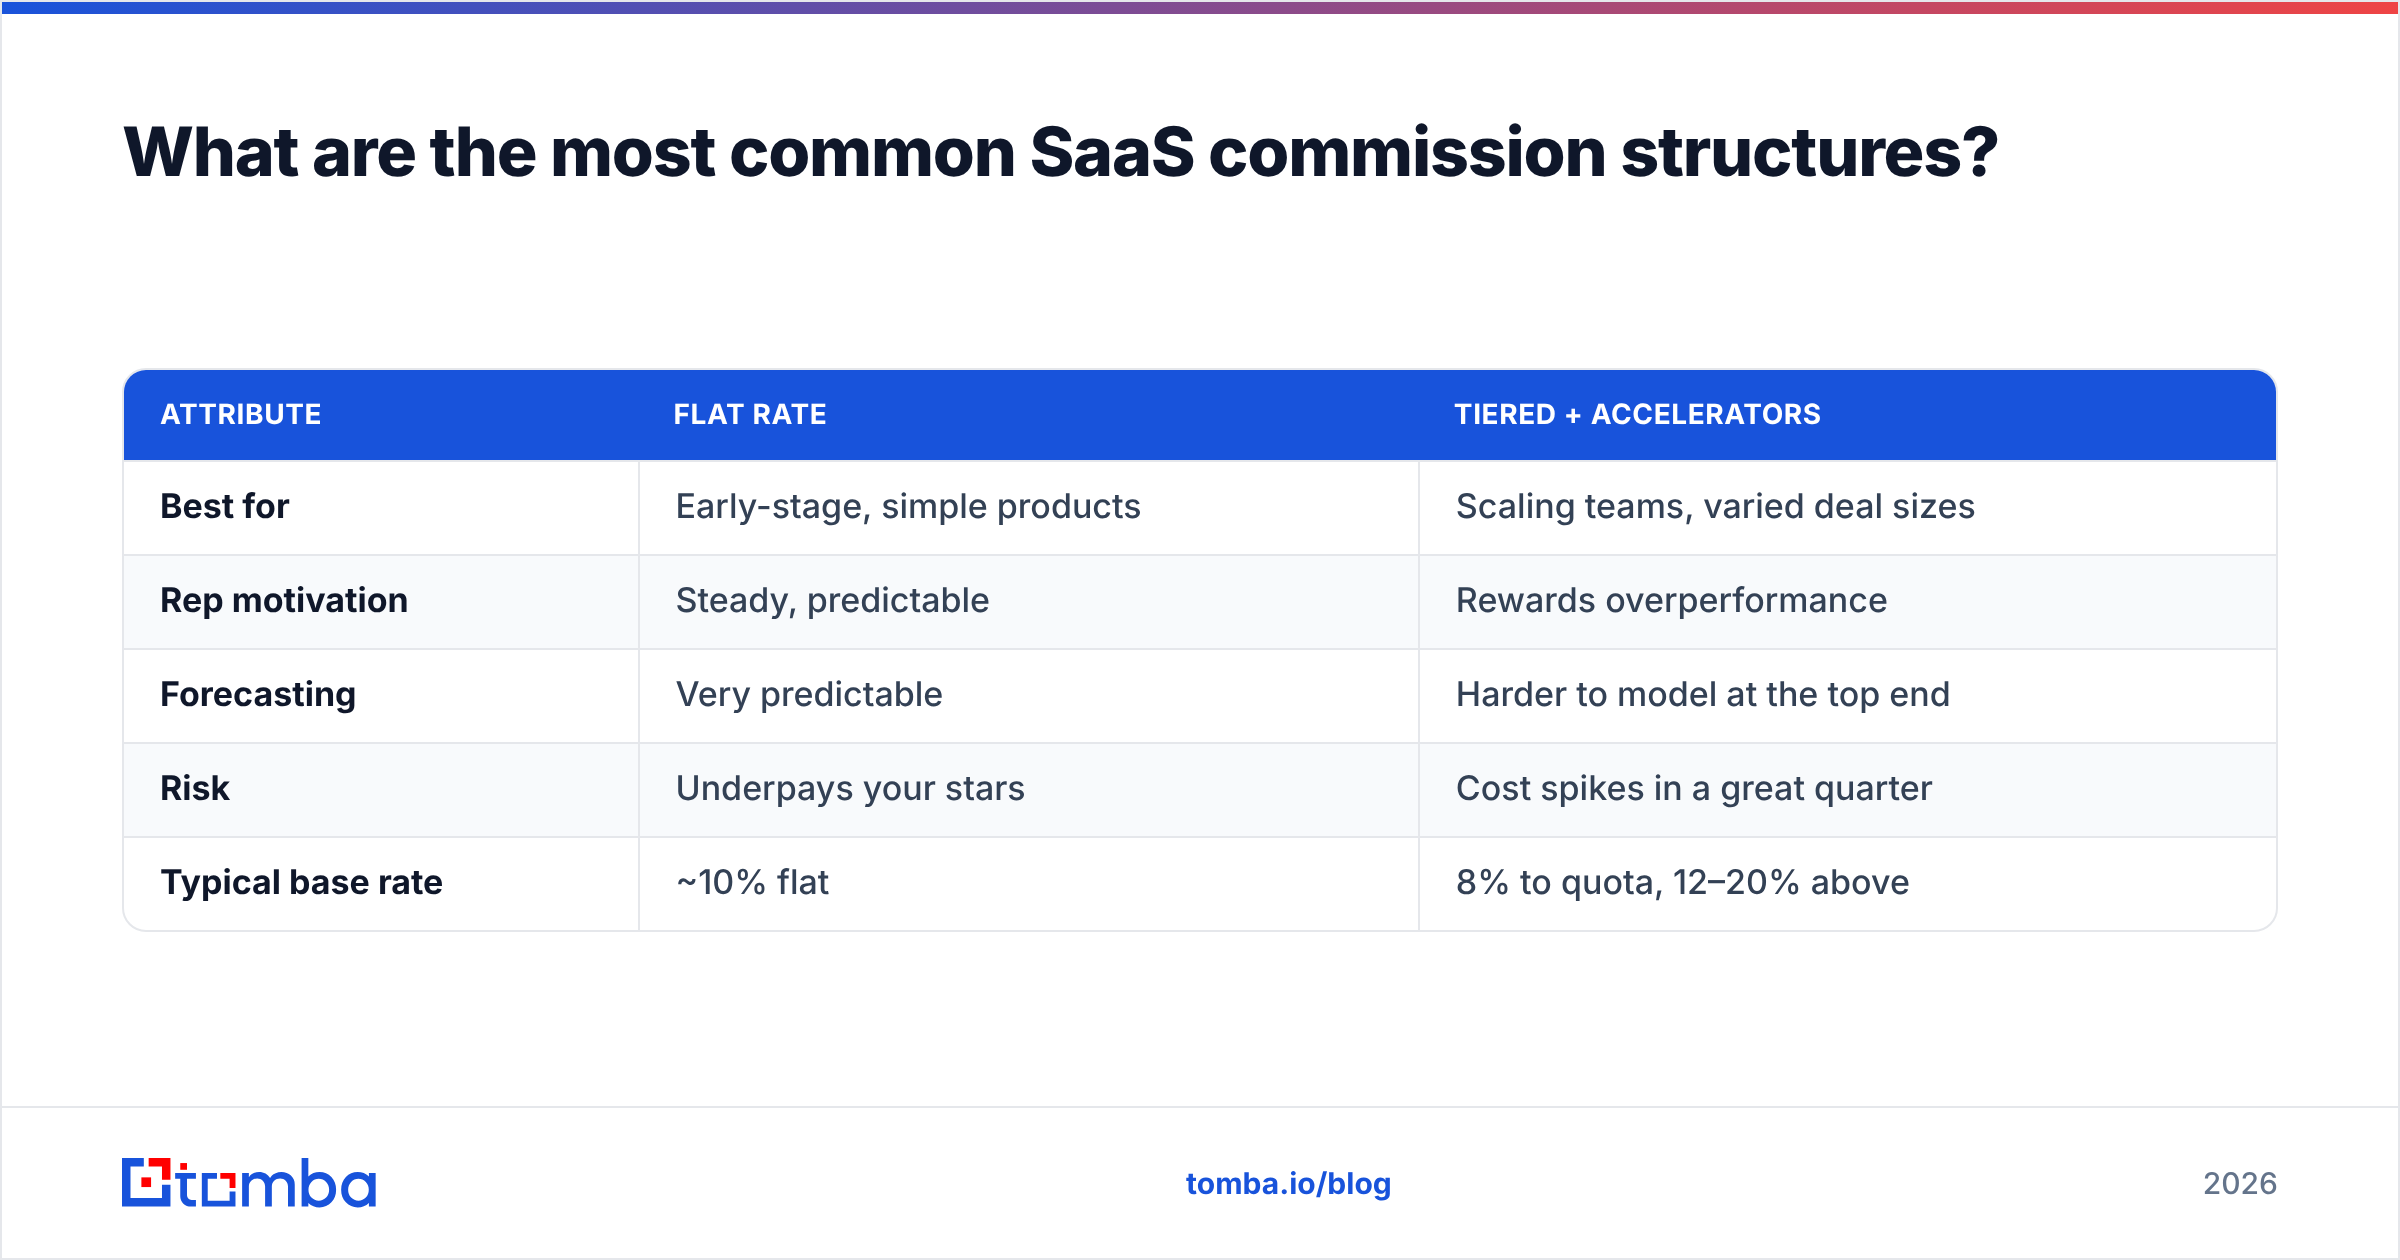
Here's how the two most common models compare in practice:
| Attribute | Flat rate | Tiered + accelerators |
|---|---|---|
| Best for | Early-stage, simple products | Scaling teams, varied deal sizes |
| Rep motivation | Steady, predictable | Rewards overperformance |
| Forecasting | Very predictable | Harder to model at the top end |
| Risk | Underpays your stars | Cost spikes in a great quarter |
| Typical base rate | ~10% flat | 8% to quota, 12–20% above |
Industry compensation research from firms like Gartner and sales-comp benchmarks published by HubSpot consistently show tiered structures dominating once a team passes ~10 reps, because flat rates leave too much performance on the table.
Is a higher commission rate always better for reps?#
No — a high rate attached to an unrealistic quota pays less than a modest rate on an achievable one. Reps quickly learn to read the whole plan, not the headline percentage.
Imagine two offers. Plan A pays 15% commission but sets a $1.2M quota that only the top 10% of the team ever hits. Plan B pays 9% on a $600K quota that 70% of reps clear. The "lower" rate in Plan B produces more reliable take-home pay and a happier, less churn-prone team.
This is where pipeline quality becomes a comp issue, not just a marketing one. A rep can only earn commission on deals that close, and deals only close if the contacts are real, reachable, and in-market. When reps burn half their week chasing bounced emails and disconnected numbers, attainment drops — and a generous rate on an unreachable list is worth nothing.
That's the quiet link between data and compensation. Teams that feed reps verified, enriched contact data hit quota more often, which means the same commission rate delivers a higher return on every payroll dollar. Tools like data enrichment and a reliable B2B phone finder don't change the percentage on the plan — they change how often reps actually trigger it.

How do you set the right commission rate for your team?#
Work top-down from your economics, not sideways from a competitor's plan. Five steps:
- Start with your CAC payback target. Decide what fraction of first-year contract value you can spend on sales compensation — commonly 10–25% of ARR for the whole sales motion. Your commission rate has to fit inside that envelope.
- Benchmark OTE by role and region. Use sources like G2 reviews of comp tools, Salesforce's own sales benchmarks, and public salary data to anchor OTE before you ever touch the rate.
- Choose your split. 50/50 for AEs, 70/30 for SDRs, 75/25 or 80/20 for retention roles. The split encodes how much risk you're asking the rep to carry.
- Set quota with a 4:1 to 6:1 ratio. Tighter ratios (4:1) suit longer, higher-touch enterprise motions; wider ratios (6:1) suit high-volume SMB.
- Layer in accelerators above 100%. Reward the behavior you want — overperformance, new logos, multi-year terms — without inflating the base rate everyone earns.
Then pressure-test the plan against reality. Model what a 60th-percentile rep, a top rep, and a struggling rep each take home. If your average performer can't clear OTE on an average pipeline, the problem usually isn't the rate — it's quota or lead quality.
What commission rate benchmarks should you actually use in 2026?#
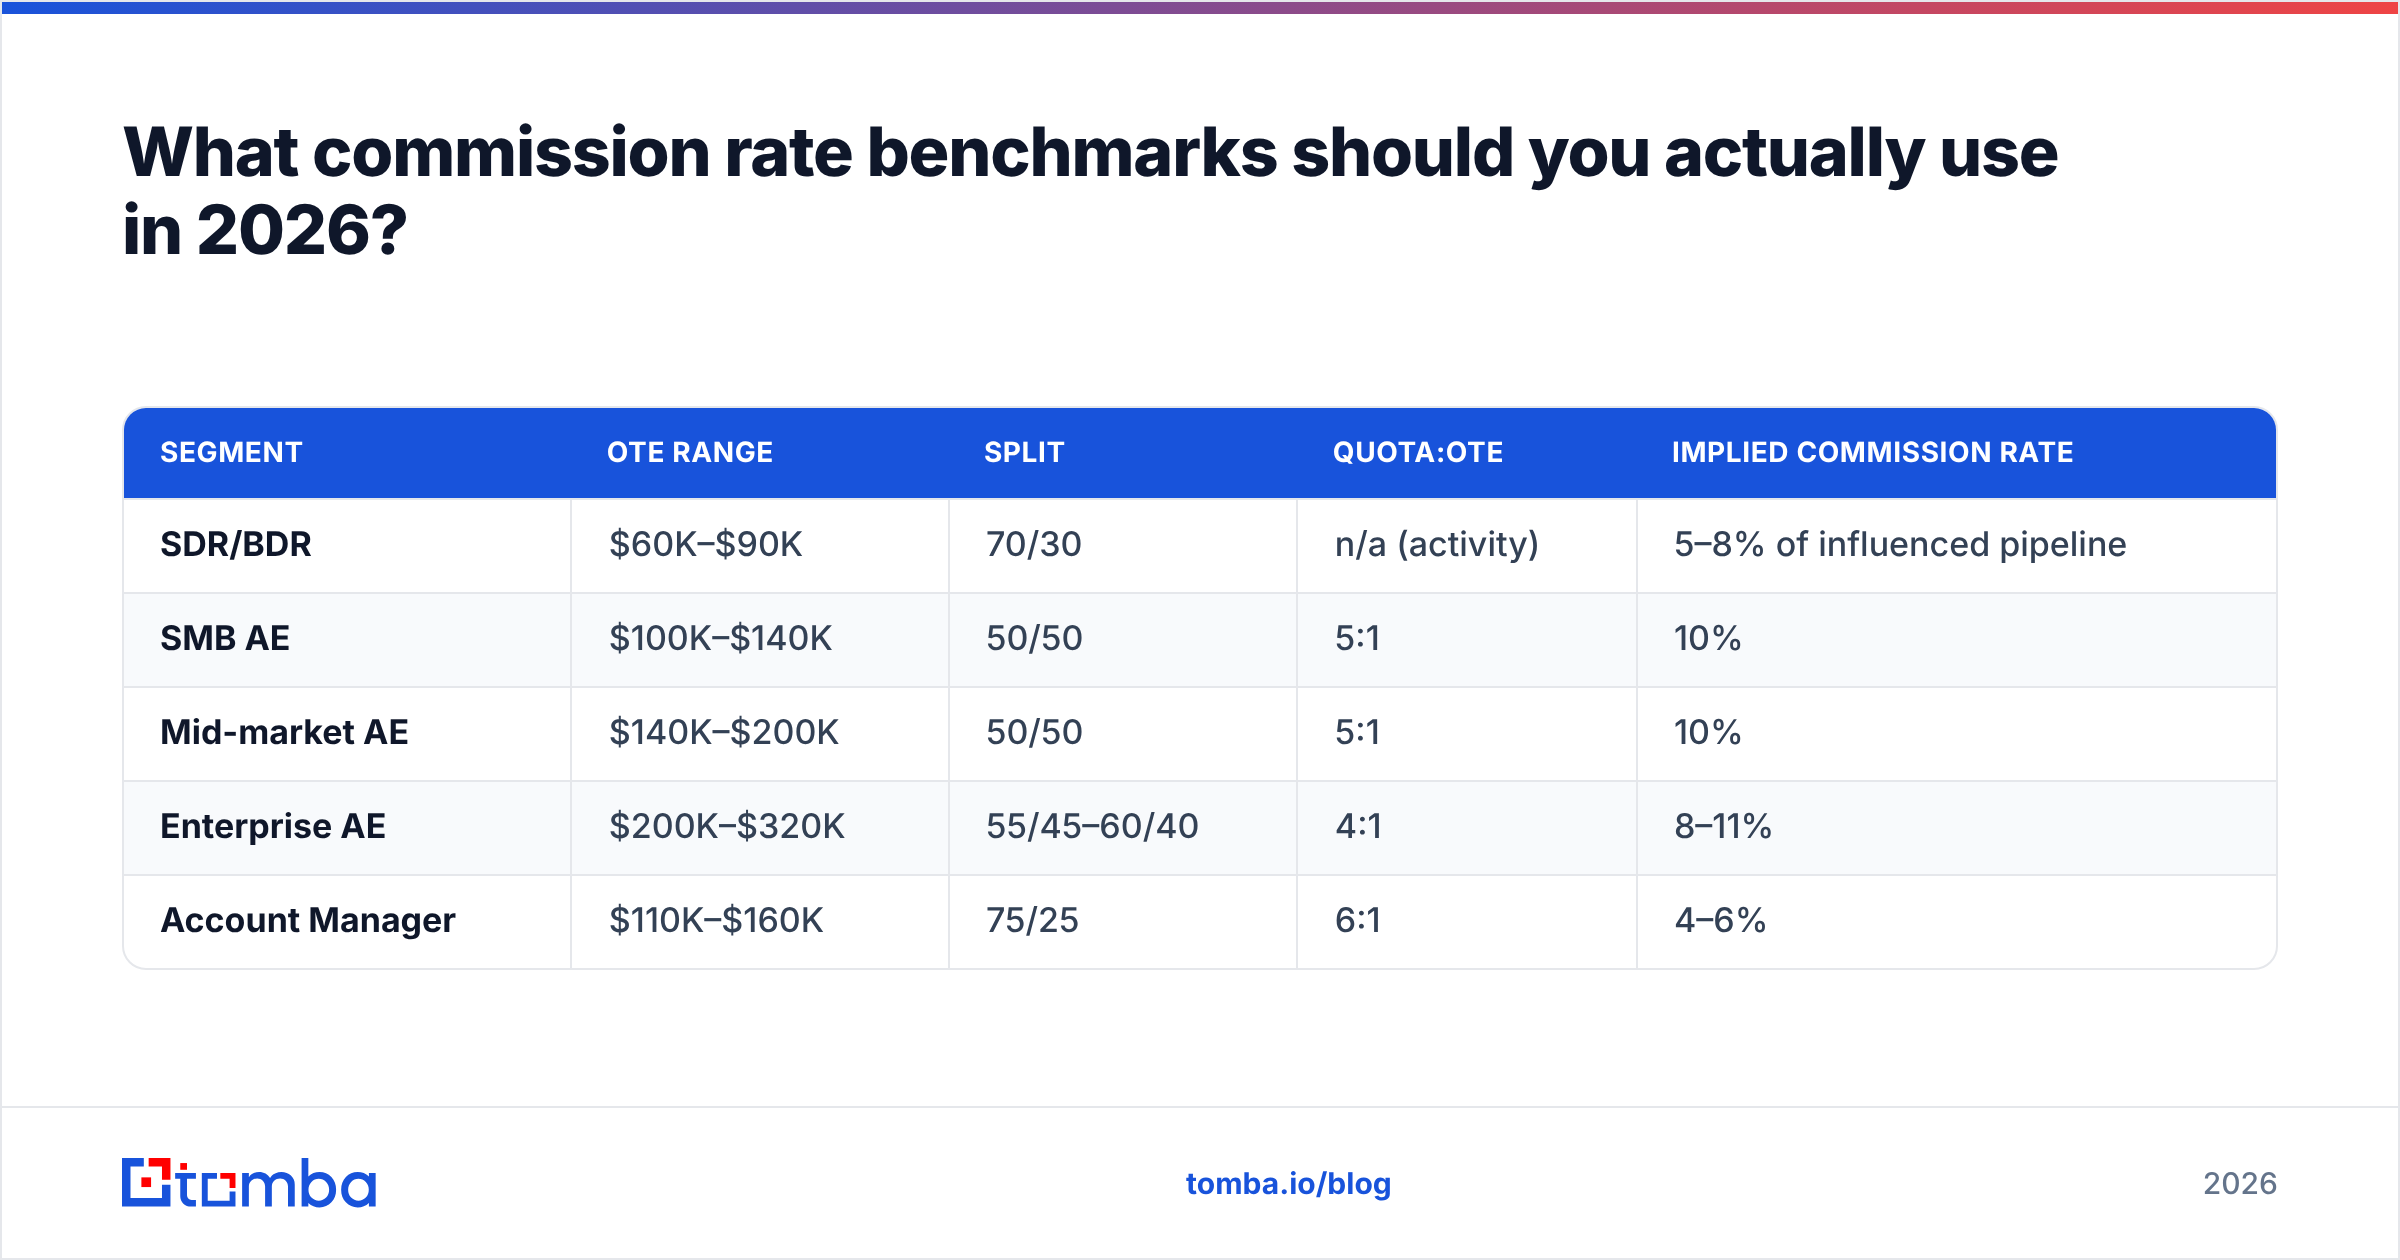
Pull it together into a single reference. These are reasonable 2026 starting points for a venture-funded or bootstrapped SaaS company selling recurring subscriptions:
| Segment | OTE range | Split | Quota:OTE | Implied commission rate |
|---|---|---|---|---|
| SDR/BDR | $60K–$90K | 70/30 | n/a (activity) | 5–8% of influenced pipeline |
| SMB AE | $100K–$140K | 50/50 | 5:1 | 10% |
| Mid-market AE | $140K–$200K | 50/50 | 5:1 | 10% |
| Enterprise AE | $200K–$320K | 55/45–60/40 | 4:1 | 8–11% |
| Account Manager | $110K–$160K | 75/25 | 6:1 | 4–6% |
Treat these as anchors, not gospel. A product with 85% gross margin and a 14-day sales cycle can pay at the top of these ranges; a services-heavy product with a long cycle should sit lower and lean on gross-margin commission. Revisit the plan annually — comp that fit a 20-person team breaks at 80 people.
For the broader operating context behind these numbers, it helps to understand how revenue operations ties comp design to pipeline data and forecasting. The best comp plans aren't built in a spreadsheet in isolation — they're calibrated against what your pipeline data actually says reps can close.
Common mistakes that quietly break commission plans#
Even a well-benchmarked rate fails when the surrounding plan is sloppy. Watch for these:
- Capping commission. Putting a ceiling on earnings tells your best reps to stop selling once they hit it. Uncap and use accelerators instead.
- Changing the plan mid-year. Reps plan their lives around OTE. Retroactive changes destroy trust faster than almost anything else.
- Paying on bookings you can't collect. Tie commission to collected revenue or build clawbacks for early churn, especially on monthly plans.
- Ignoring data quality in attainment math. If reps are handed unverified lists, quota becomes a lottery. Clean data isn't a marketing line item — it's a precondition for a fair comp plan.
- Over-engineering. A plan a rep can't calculate on a napkin is a plan they won't trust. Simplicity beats cleverness.
Closing: pay your reps well — and give them lists worth selling#
The average SaaS commission rate lands near 10% of revenue, but the number that matters is whether your reps can actually reach it. The cleanest comp plan in the world underperforms when half the pipeline bounces.
That's where your data foundation earns its keep. Tomba Email Finder helps your team find and verify accurate, professional email addresses by domain, name, or company — so reps spend their hours selling to real, reachable buyers instead of chasing dead contacts. Pair a fair commission rate with verified data, and the same percentage on the plan starts producing a lot more closed-won. Start on the free tier (25 searches/month) and scale to a paid plan as your pipeline grows — see Tomba pricing for the full breakdown.
Ready to find emails that actually work?
Join 150,000+ professionals who stopped guessing and started sending. Free credits on signup — no credit card required.
Get the Tomba newsletter
Practical outbound tactics and product updates — once every two weeks.
About the author