B2B Sales KPIs: The 15 Metrics That Actually Matter in 2026
Most teams track dozens of numbers and act on none. Here are the 15 B2B sales KPIs that actually predict revenue in 2026 — with formulas, benchmarks, and the data you need to feed them.
(rendered separately)
Tracking 40 numbers feels productive. It isn't. The teams that hit quota in 2026 watch a short list of B2B sales KPIs that actually move revenue — and ignore the vanity metrics that just look busy on a dashboard.
This guide is that short list: what each KPI measures, the formula, a realistic benchmark, and why it matters. No filler, no "synergy."
TL;DR#
- Track outcomes, not activity. Win rate, pipeline coverage, and CAC payback predict revenue. "Calls made" mostly predicts burnout.
- Pick 5–8 KPIs, not 40. A focused scorecard beats a wall of charts nobody reads.
- Garbage in, garbage out. Every KPI below depends on clean contact and pipeline data — bad emails and stale records quietly poison your conversion math.
- Leading + lagging. Pair lagging KPIs (revenue, win rate) with leading ones (qualified pipeline created, response rate) so you can steer before the quarter ends.
- Benchmark against yourself. Industry medians are a sanity check; your own trend line is the real scoreboard.
What are B2B sales KPIs, exactly?#
B2B sales KPIs are the quantified checkpoints that tell you whether your revenue engine is healthy. Think of them like the gauges on a car dashboard: speed, fuel, engine temperature. You don't need 40 gauges to drive well — you need the few that warn you before something breaks.
A metric is any number you can measure. A KPI (key performance indicator) is a metric you've decided is important enough to drive decisions. The difference matters. "Emails sent" is a metric. "Qualified pipeline created per rep" is a KPI, because a dip in it changes what you do next week.
Good KPIs share three traits:
- They tie to an outcome — revenue, retention, or efficiency, not just effort.
- They're actionable — when the number moves, you know what lever to pull.
- They're trustworthy — built on accurate data, not a CRM full of bounced contacts.
That third trait is where most teams quietly fail. You can measure win rate to two decimal places, but if half your "contacted" leads had dead email addresses, your conversion denominator is fiction.
)
Which B2B sales KPIs actually matter in 2026?#
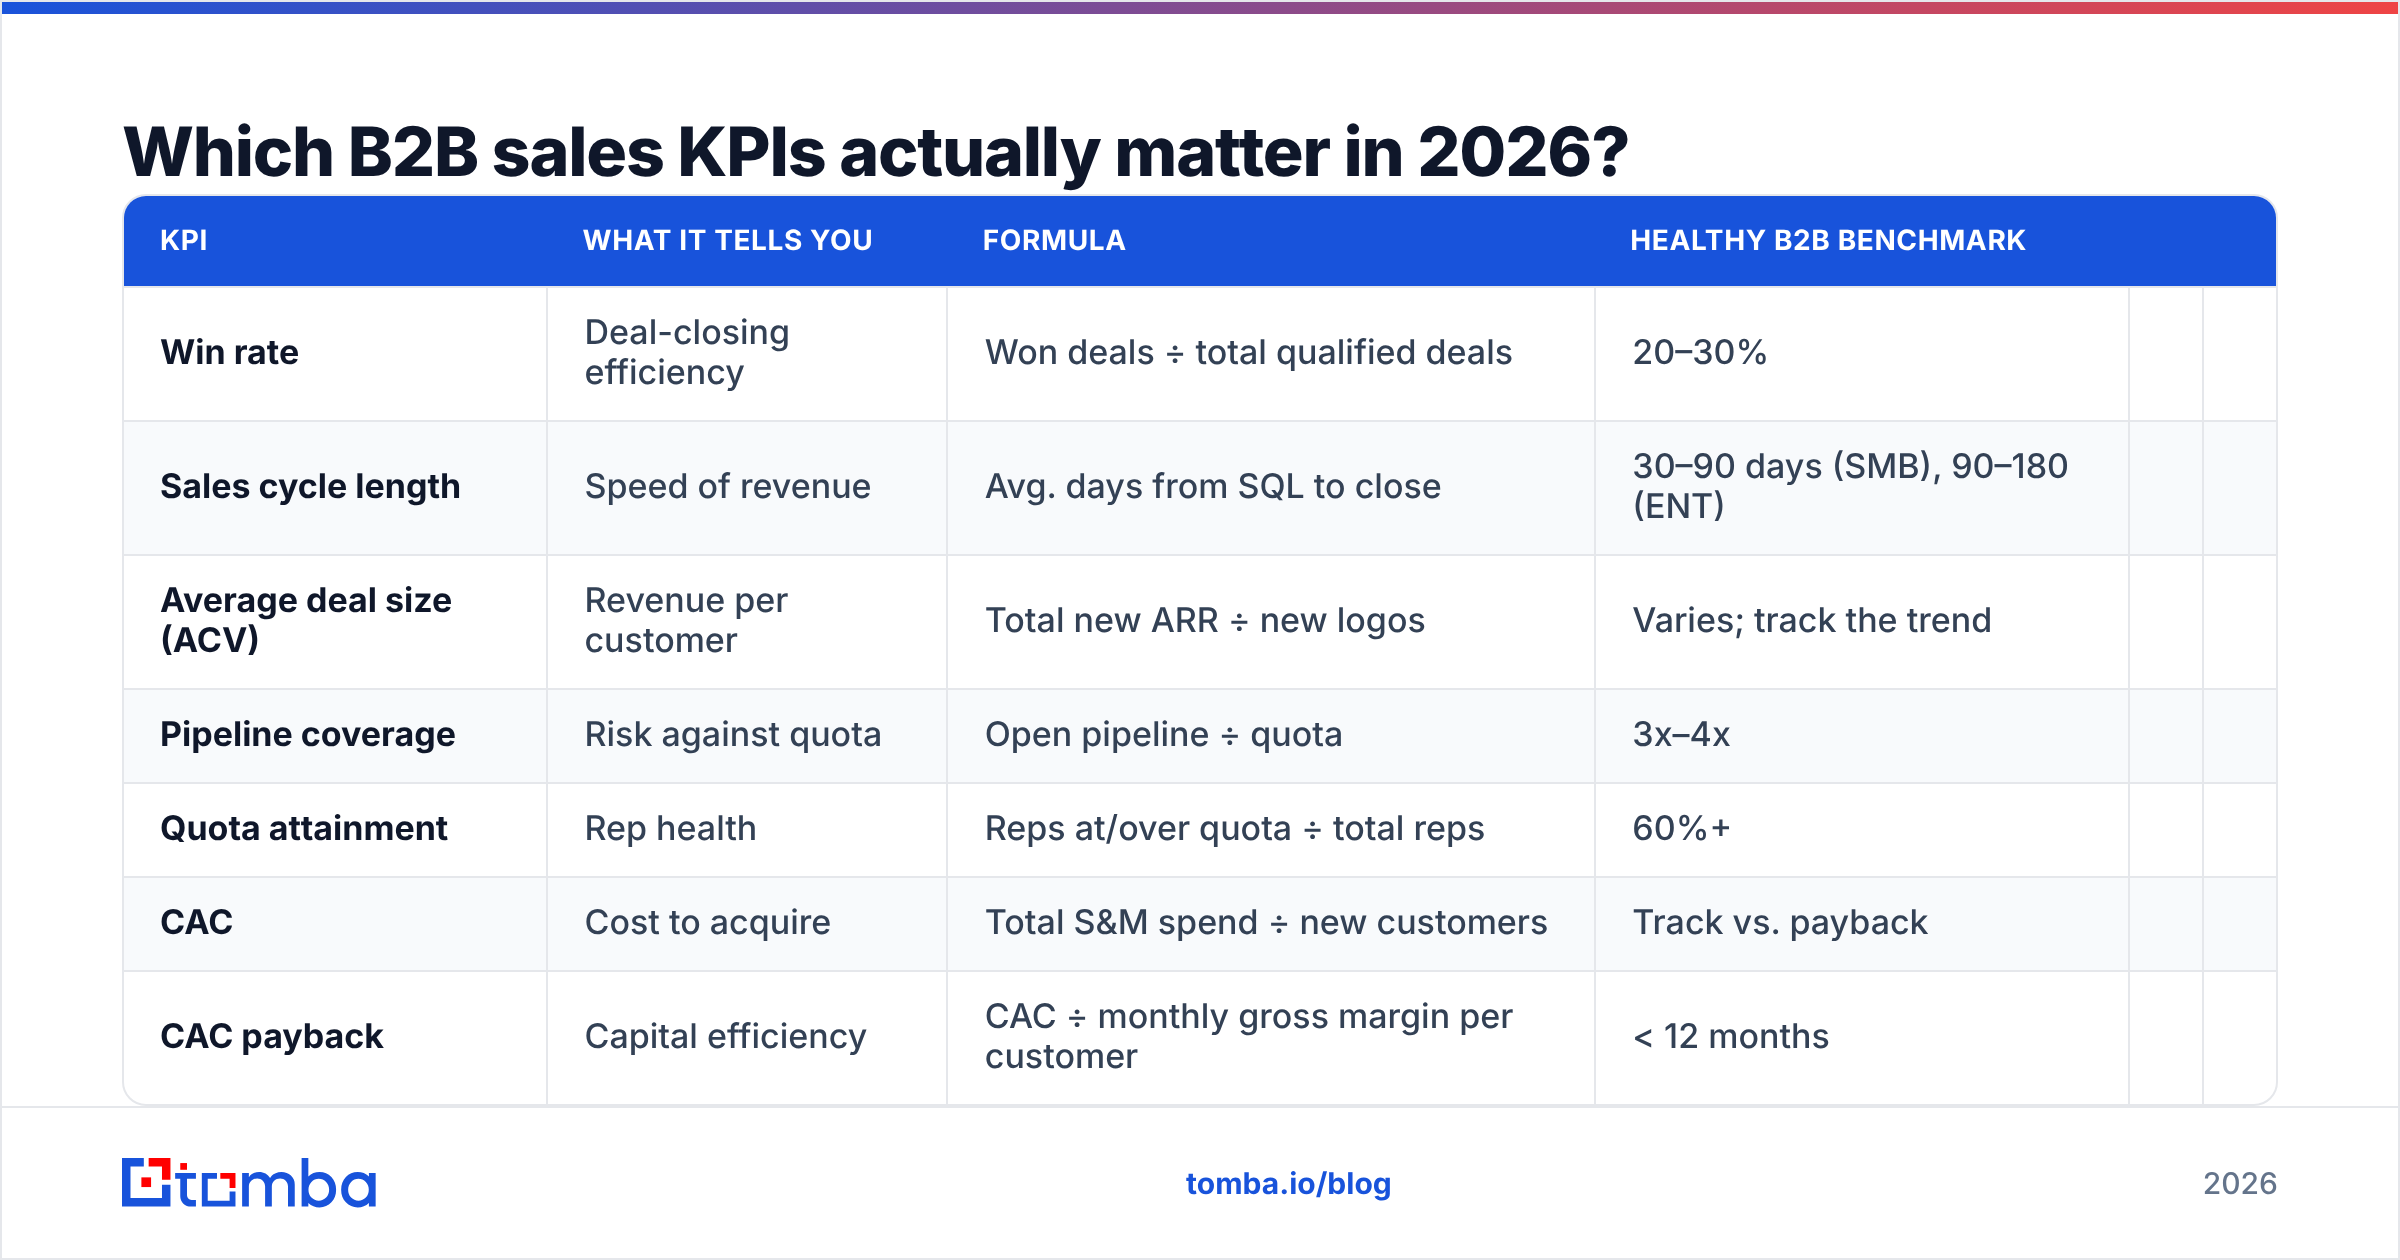
Here's the working scorecard. You won't use all 15 — pick the ones that match your motion (PLG, outbound, enterprise) and your stage. The formulas are deliberately simple so anyone on the team can compute them.
| KPI | What it tells you | Formula | Healthy B2B benchmark | ||
|---|---|---|---|---|---|
| Win rate | Deal-closing efficiency | Won deals ÷ total qualified deals | 20–30% | ||
| Sales cycle length | Speed of revenue | Avg. days from SQL to close | 30–90 days (SMB), 90–180 (ENT) | ||
| Average deal size (ACV) | Revenue per customer | Total new ARR ÷ new logos | Varies; track the trend | ||
| Pipeline coverage | Risk against quota | Open pipeline ÷ quota | 3x–4x | ||
| Quota attainment | Rep health | Reps at/over quota ÷ total reps | 60%+ | ||
| CAC | Cost to acquire | Total S&M spend ÷ new customers | Track vs. payback | ||
| CAC payback | Capital efficiency | CAC ÷ monthly gross margin per customer | < 12 months | ||
| LTV:CAC | Unit economics | Customer LTV ÷ CAC | 3:1 or better | ||
| Lead response time | Speed-to-lead | Time from inbound to first touch | < 5 minutes | ||
| Conversion rate (stage) | Funnel leaks | Deals advancing ÷ deals entering stage | Stage-specific | ||
| Response rate | Outbound message quality | Replies ÷ messages delivered | 5–15% | ||
| Qualified pipeline created | Leading revenue signal | Sum of new SQL pipeline value | Set vs. quota | ||
| Net revenue retention | Expansion vs. churn | (Start ARR + expansion − churn) ÷ start ARR | 100%+ | ||
| Activity-to-meeting ratio | Prospecting efficiency | Activities ÷ meetings booked | Lower is better | ||
| Forecast accuracy | Predictability | 1 − | forecast − actual | ÷ actual | 90%+ |
Two ground rules before you copy this into a spreadsheet:
- Leading vs. lagging. Win rate and NRR are lagging — they confirm what already happened. Lead response time, response rate, and qualified pipeline created are leading — they predict what's coming. A balanced scorecard has both, or you're always reacting to last quarter.
- Segment everything. A blended win rate across SMB and enterprise hides more than it reveals. Slice by segment, source, and rep.
How do you calculate the core revenue KPIs?#
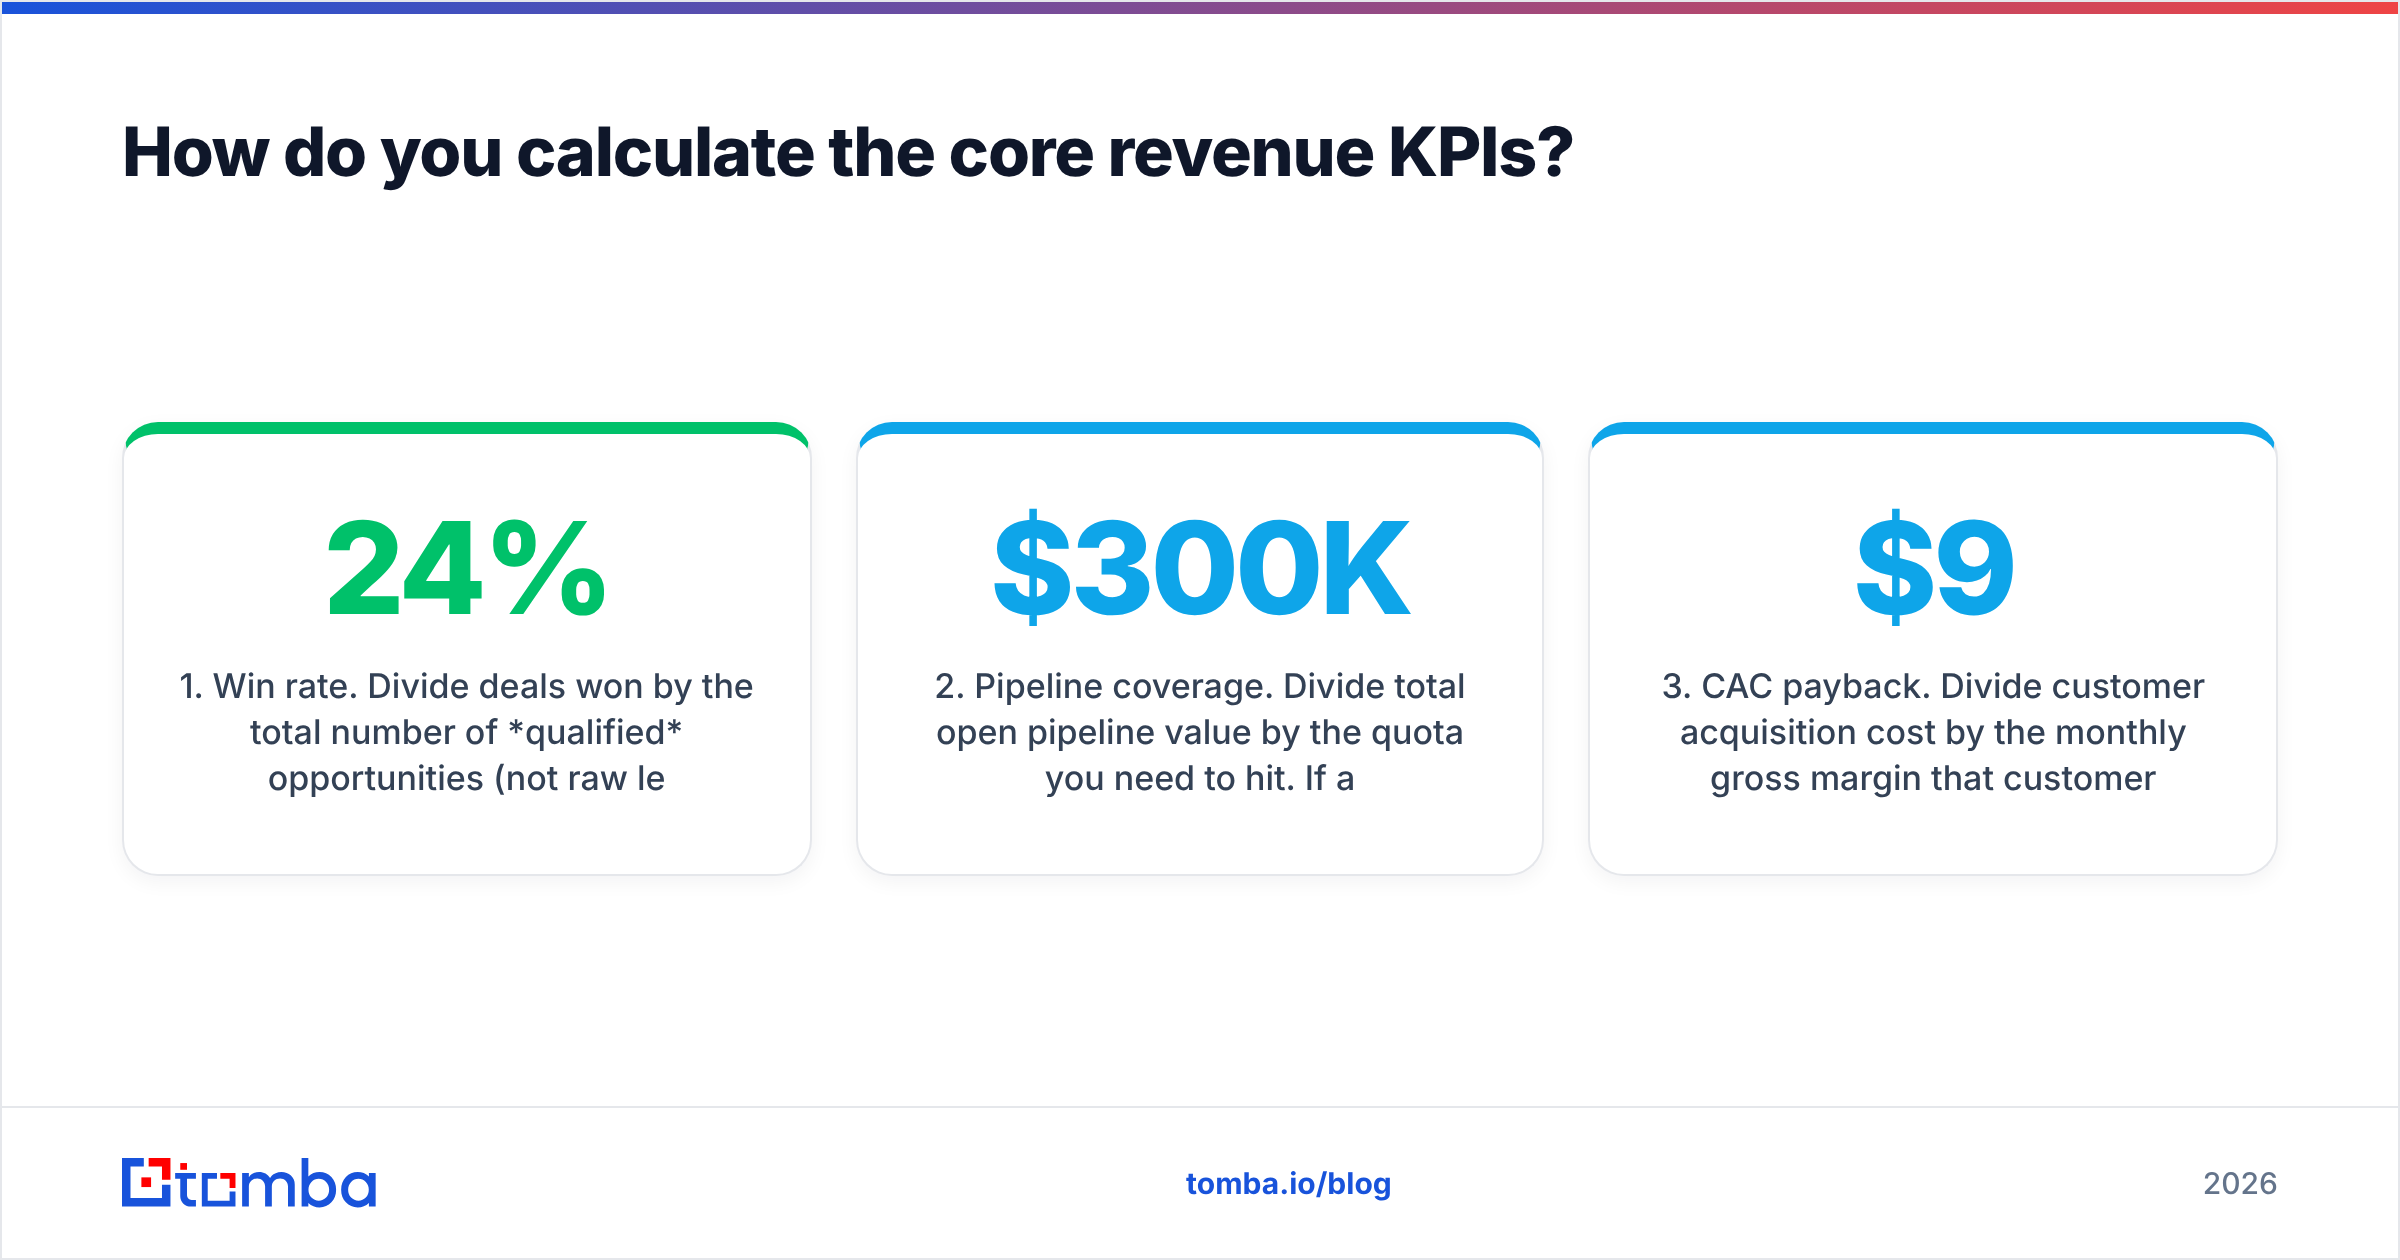
Let's go deeper on the four that matter most across nearly every B2B team.
1. Win rate. Divide deals won by the total number of qualified opportunities (not raw leads). If you closed 18 of 75 qualified deals, that's a 24% win rate. The common mistake is using total leads as the denominator, which makes the number meaningless. A declining win rate with steady volume usually signals a qualification or competitive problem — check your loss reasons. For more on this, see Tomba's glossary entry on win rate.
2. Pipeline coverage. Divide total open pipeline value by the quota you need to hit. If a rep carries a $300K quarterly quota and has $900K in open pipeline, that's 3x coverage — roughly the floor for a healthy quarter, because most pipeline doesn't close. Below 3x, you have a top-of-funnel problem that no amount of closing skill fixes.
3. CAC payback. Divide customer acquisition cost by the monthly gross margin that customer generates. If CAC is $9,000 and the customer throws off $1,000/month in gross margin, payback is 9 months. Under 12 months is the rule of thumb for efficient B2B SaaS; over 18 and growth is burning cash. Gartner and most VC benchmarks treat this as the single best efficiency gauge.
4. Lead response time. This one is brutal and underrated. The odds of qualifying an inbound lead drop sharply after the first five minutes. If your average response time is measured in hours, you're losing deals you already paid to generate. HubSpot's research has shown speed-to-lead is one of the strongest predictors of conversion — and it's almost entirely within your control.
Why do most B2B sales KPIs lie to you?#
Because they're built on dirty data. A KPI is only as honest as the records feeding it, and B2B contact data decays fast — people change jobs, companies rebrand, domains get retired. Industry estimates put B2B data decay around 30% per year. That means roughly a third of your CRM is wrong within twelve months if nobody maintains it.
Here's how bad data corrupts each metric:
- Win rate inflates or deflates when "contacted" leads were never actually reachable.
- Response rate craters when a chunk of your sends bounce — you're dividing replies by a delivered count that includes dead addresses.
- CAC looks worse than reality when you pay for leads you can never contact.
- Sales cycle length gets noisy when reps waste days chasing wrong-number, wrong-email phantoms.
The fix isn't a fancier dashboard. It's clean inputs. Verify contact data before it enters the pipeline, enrich thin records, and remove the dead weight. A verified, enriched lead list makes every downstream KPI trustworthy. This is exactly where an email verifier and data enrichment earn their keep — they protect the denominator in half your formulas.
)
What's the difference between activity KPIs and outcome KPIs?#
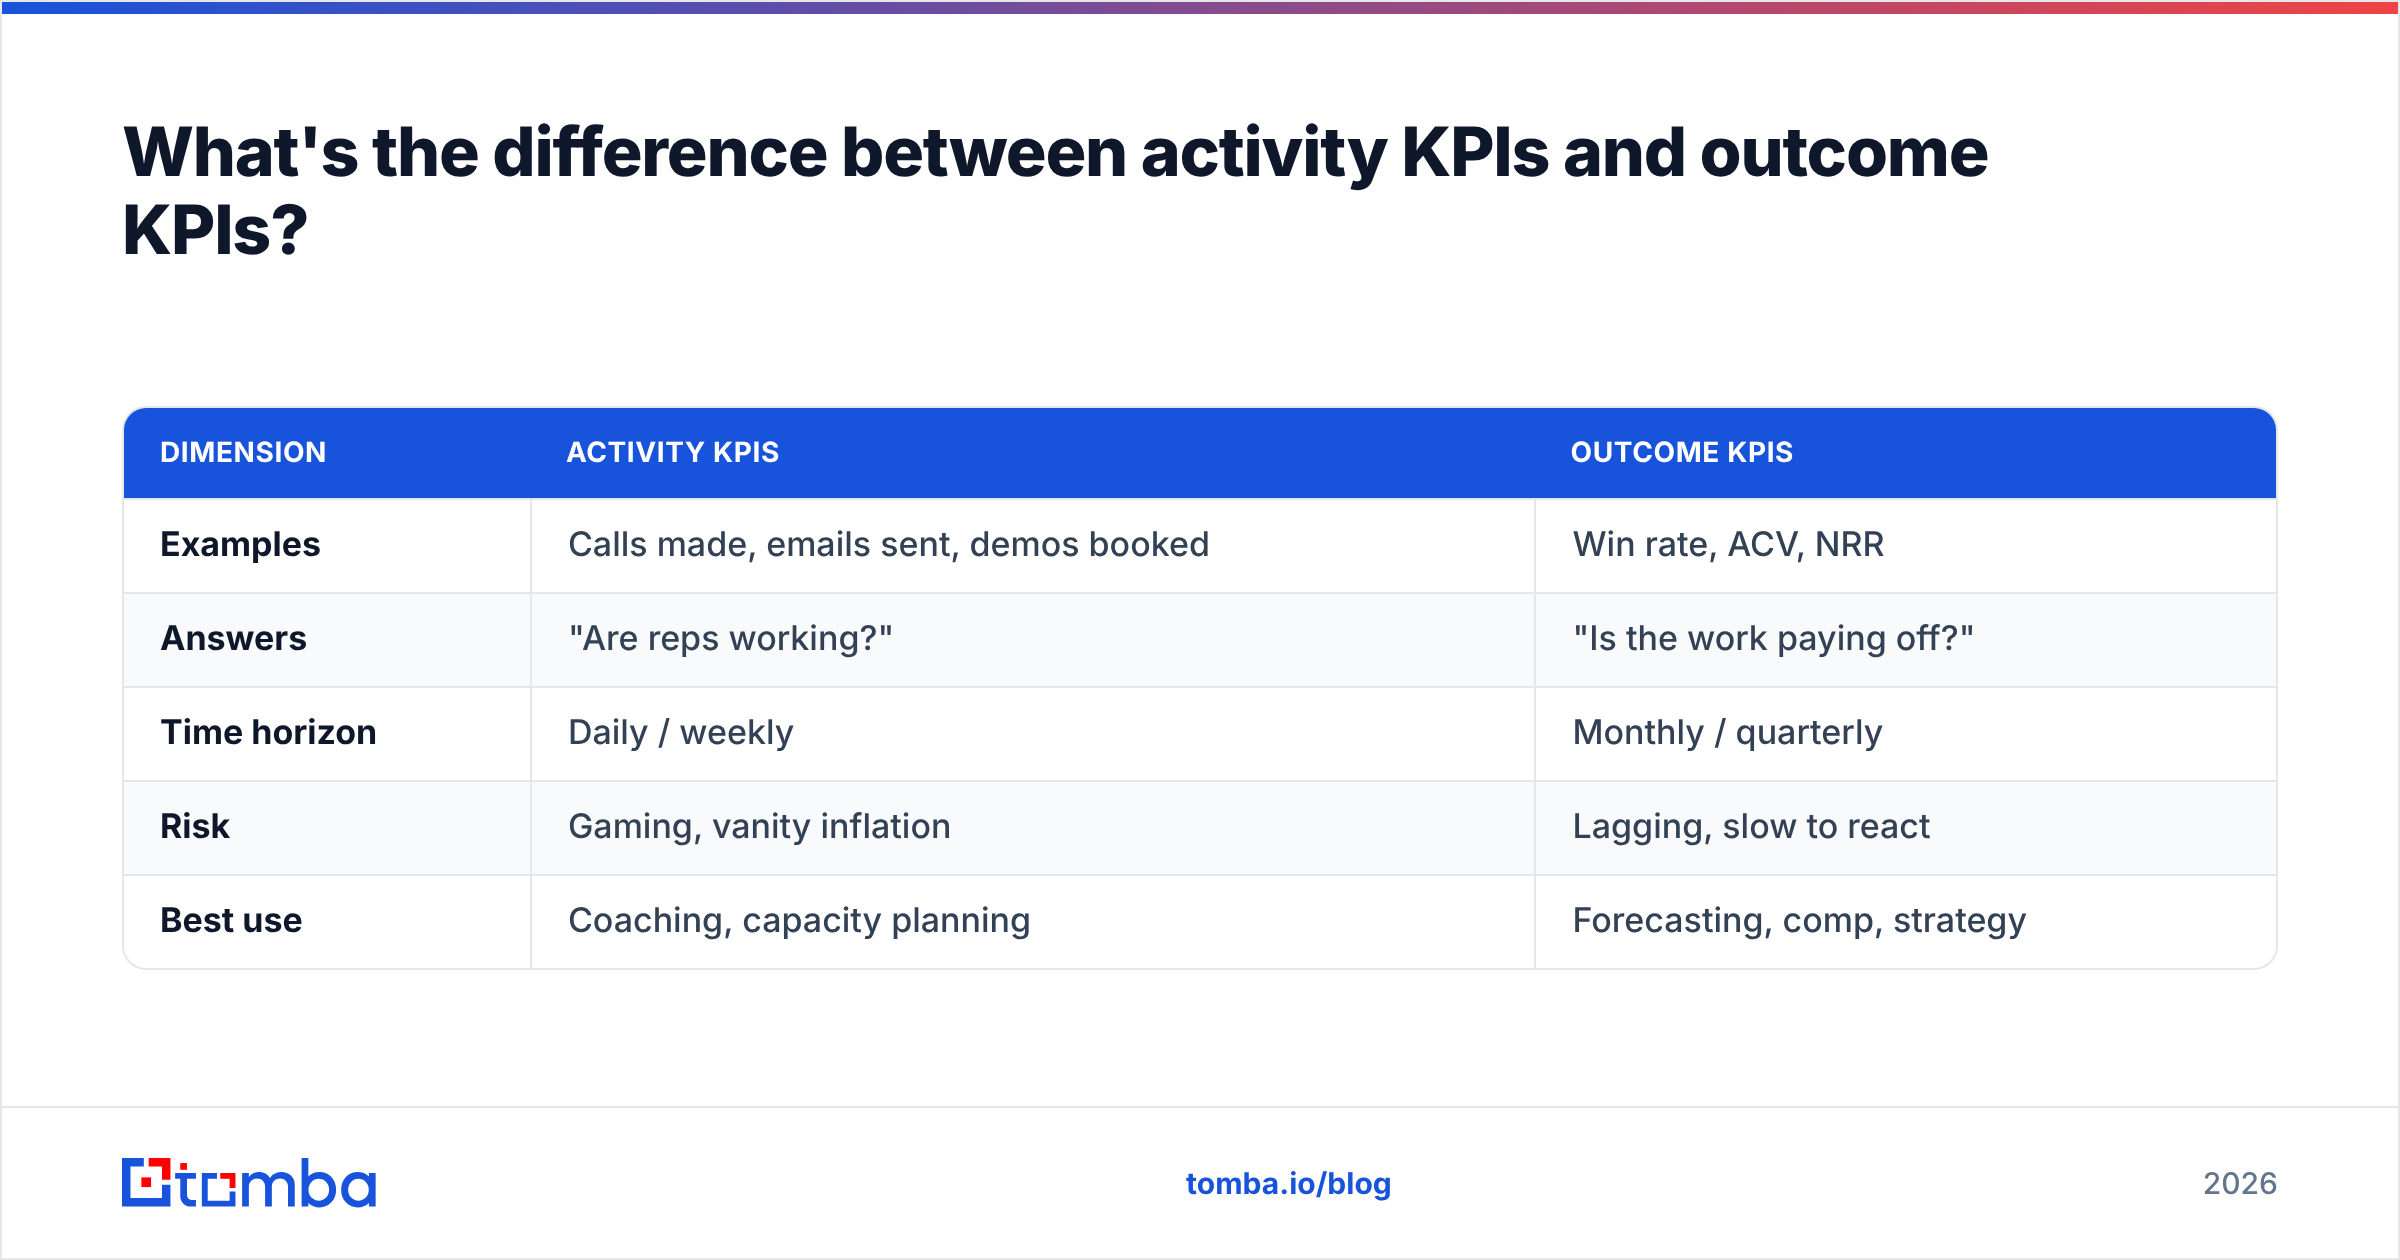
Activity KPIs measure effort; outcome KPIs measure results. Both have a place — but confusing them is how teams end up busy and broke.
| Dimension | Activity KPIs | Outcome KPIs |
|---|---|---|
| Examples | Calls made, emails sent, demos booked | Win rate, ACV, NRR |
| Answers | "Are reps working?" | "Is the work paying off?" |
| Time horizon | Daily / weekly | Monthly / quarterly |
| Risk | Gaming, vanity inflation | Lagging, slow to react |
| Best use | Coaching, capacity planning | Forecasting, comp, strategy |
The trap is rewarding activity as if it were outcome. If you comp reps on "150 calls a week," you'll get 150 low-quality calls. Track activity to diagnose — "this rep books few meetings; is it volume or messaging?" — and track outcomes to decide. The bridge between them is the activity-to-meeting ratio and response rate, which tell you whether the effort is actually landing. You can dig into the latter in Tomba's note on response rate.
How many KPIs should a B2B sales team track?#
Five to eight on the primary scorecard. More than that and nobody internalizes them; fewer and you miss blind spots.
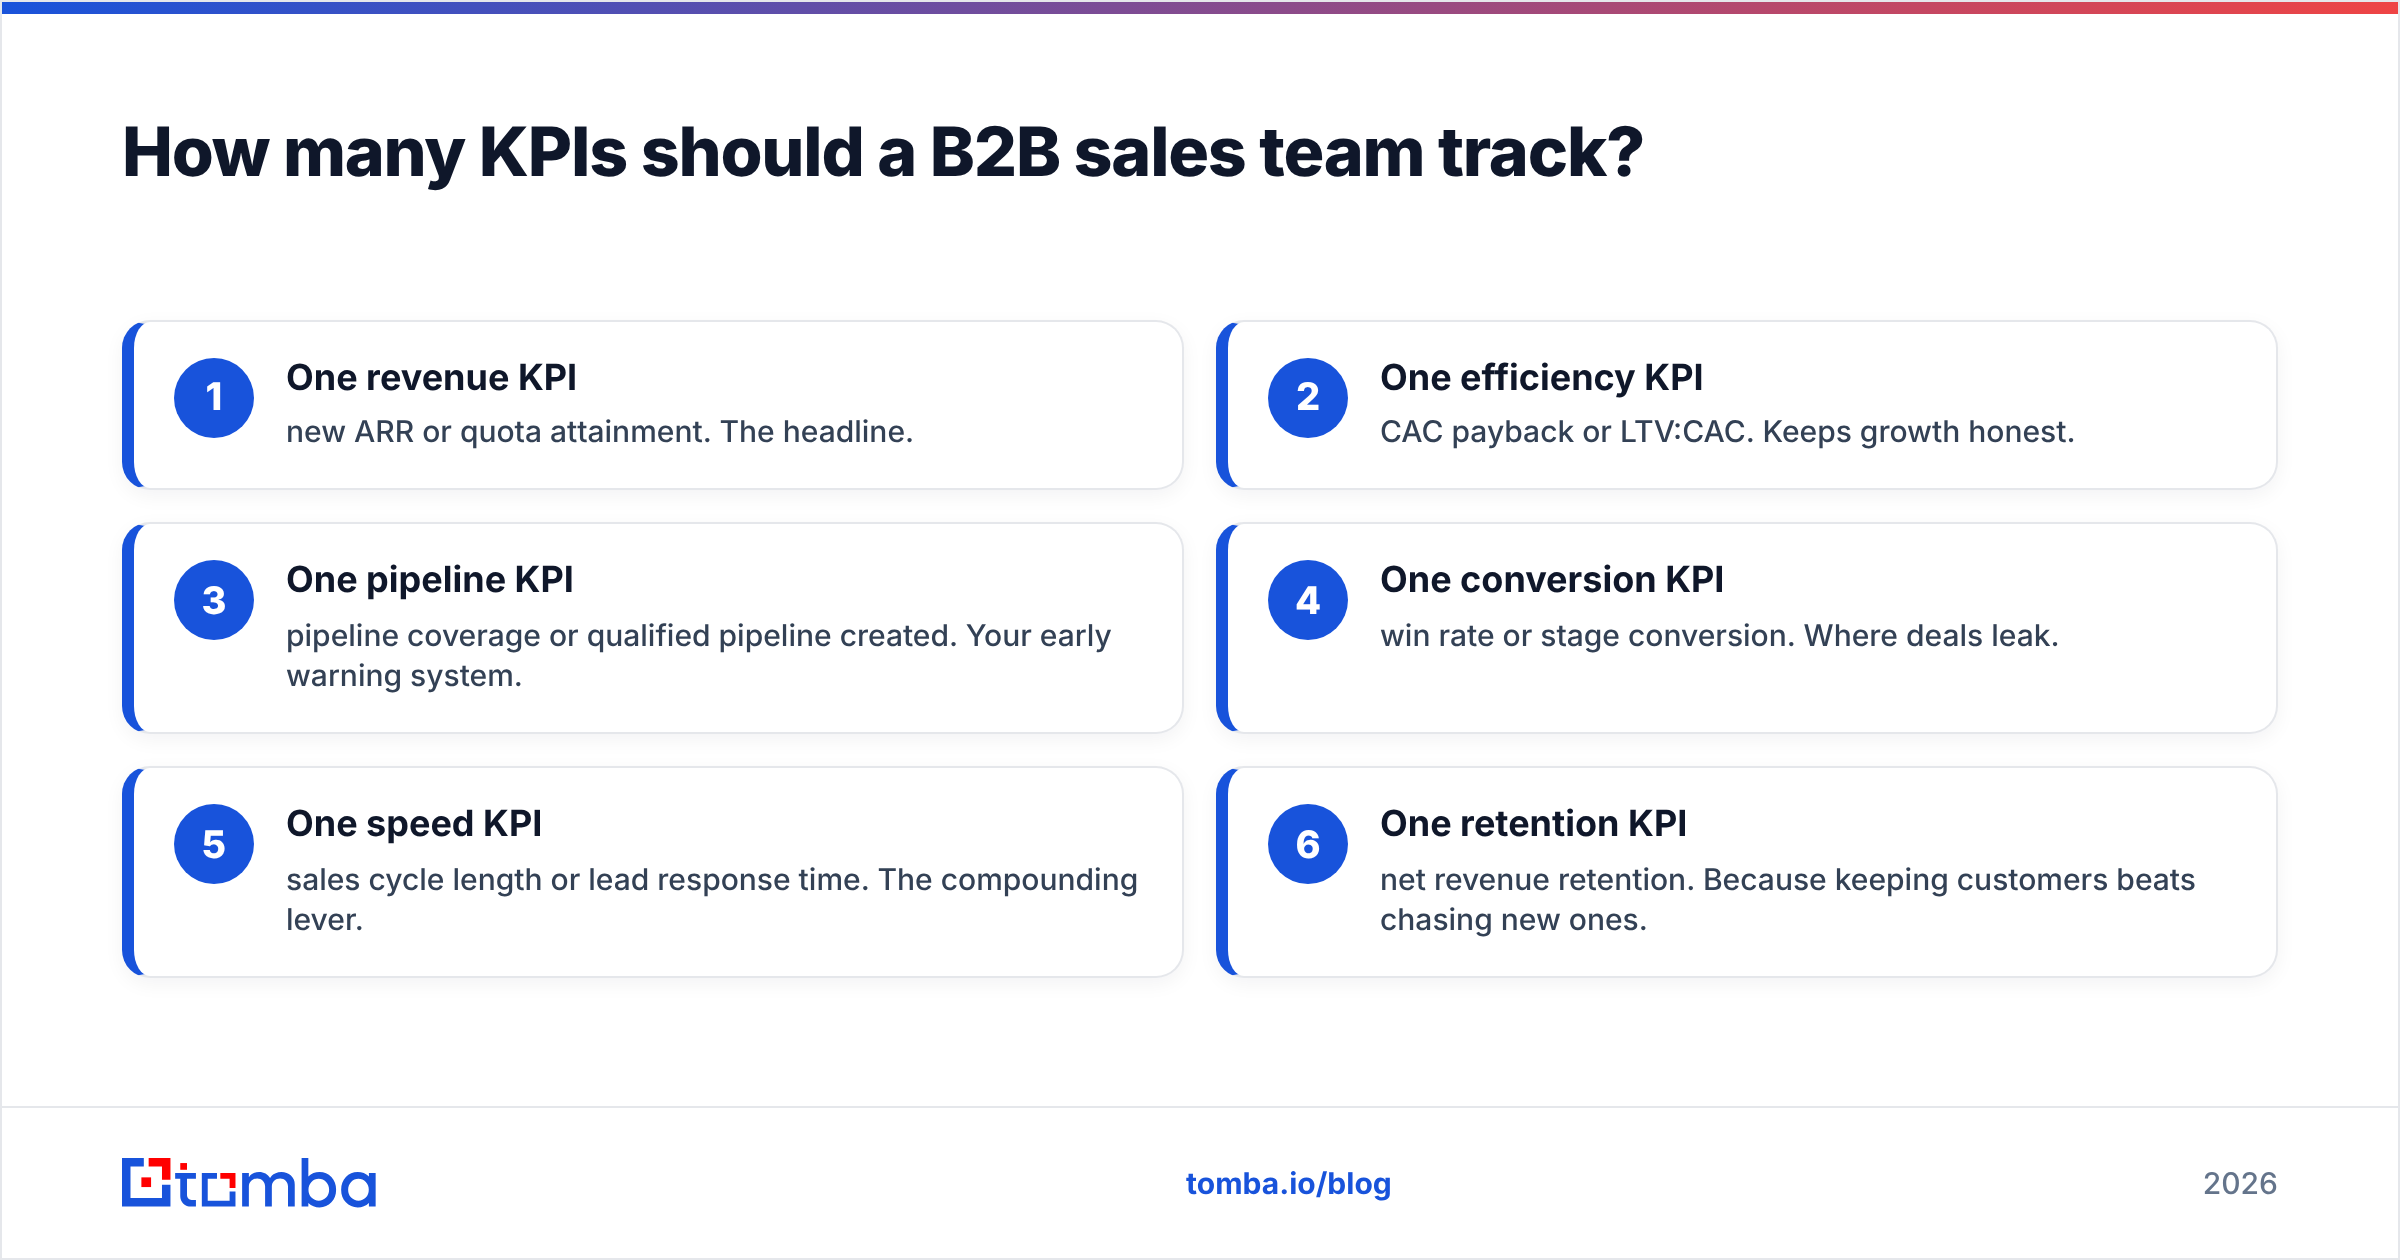
A practical structure for a quarterly sales scorecard:
- One revenue KPI — new ARR or quota attainment. The headline.
- One efficiency KPI — CAC payback or LTV:CAC. Keeps growth honest.
- One pipeline KPI — pipeline coverage or qualified pipeline created. Your early warning system.
- One conversion KPI — win rate or stage conversion. Where deals leak.
- One speed KPI — sales cycle length or lead response time. The compounding lever.
- One retention KPI — net revenue retention. Because keeping customers beats chasing new ones.
Add a couple of leading activity metrics underneath for coaching, and stop. The point of a scorecard is focus, not completeness. Salesforce's State of Sales research consistently finds that high-performing teams operate from a tight, shared set of metrics — not the longest dashboard.
How does data quality feed every KPI on this list?#
It's the foundation, full stop. Every metric above has a denominator or an input that assumes your contacts are real, current, and reachable. Break that assumption and the whole scorecard tilts.
Think of it like a kitchen scale: precise to the gram, but useless if it's not zeroed. Clean data is how you zero the scale before every measurement. Concretely, that means:
- Verify before you contact. Run new leads through verification so bounces don't pollute response rate and deliverability.
- Enrich thin records. Add firmographics, role, and direct contact details so segmentation-by-KPI actually works.
- Refresh on a cadence. Re-verify your active list quarterly to fight the ~30% annual decay.
- Find the right contact, not just any contact. A verified email for the actual decision-maker beats ten guesses at the org.
This is the unglamorous work that makes KPIs trustworthy. A reliable email finder plus a maintained B2B database means the numbers you report in the QBR reflect reality — not a CRM full of ghosts.
Common mistakes when setting B2B sales KPIs#
- Vanity over value. "LinkedIn impressions" is not a sales KPI. If it doesn't connect to pipeline or revenue, demote it.
- No baseline. A KPI without a trend line is trivia. Capture at least one prior quarter before you judge a number good or bad.
- One number, no segments. Blended averages hide the truth. Always slice by segment and source.
- Comp on the wrong metric. Tie pay to outcomes you want more of, or you'll get more of what you measured by accident.
- Set and forget. Your KPIs should evolve with your motion. The metrics that mattered at $1M ARR aren't the ones that matter at $10M.
Frequently asked questions#
What is the most important B2B sales KPI? There's no single one, but if forced to pick: pipeline coverage as a leading indicator and win rate as a lagging one. Coverage warns you early; win rate confirms whether your process works.
How often should I review sales KPIs? Leading metrics (response time, qualified pipeline created) weekly; lagging outcome metrics (win rate, NRR, CAC payback) monthly or quarterly. Reviewing lagging metrics weekly just adds noise.
What's a good win rate for B2B sales? 20–30% of qualified opportunities is a common healthy range, but it varies wildly by segment and deal size. Track your own trend rather than chasing an external benchmark.
Do KPIs differ for SMB vs. enterprise sales? Yes. SMB motions weight speed and volume (lead response time, cycle length); enterprise motions weight pipeline coverage, ACV, and forecast accuracy because deals are fewer and larger.
Build your scorecard on data you can trust#
KPIs don't fix a broken pipeline — they reveal it. But they can only reveal the truth if the data underneath is clean. Before you obsess over win rate and CAC payback, make sure the contacts feeding those numbers are real, current, and reachable.
That's the cheapest leverage you have. Start with verified, enriched leads using the Tomba Email Finder — find accurate, decision-maker email addresses by domain, name, or company, then verify and enrich them so every KPI on your scorecard reflects reality. The free tier gives you 25 searches a month to test it; paid plans start at $49/mo, and you can see full Tomba pricing before you commit. Clean inputs, honest metrics, better decisions — in that order.
Ready to find emails that actually work?
Join 150,000+ professionals who stopped guessing and started sending. Free credits on signup — no credit card required.
Get the Tomba newsletter
Practical outbound tactics and product updates — once every two weeks.
About the author