BDR KPIs in 2026: The 12 Metrics That Predict Pipeline
The BDR KPIs that actually predict pipeline in 2026 — which metrics to track, realistic benchmarks, and how to build a scorecard that drives revenue instead of vanity activity.
Most BDR teams measure the wrong things. They count dials, emails, and "activities" because those numbers are easy to pull — then wonder why a busy quarter produced no pipeline. This guide fixes that.
TL;DR#
- Outcome KPIs beat activity KPIs. Meetings booked, SQLs accepted, and pipeline sourced predict revenue; dials and emails sent do not.
- Track a balanced scorecard of three layers: activity (leading), conversion (efficiency), and outcome (lagging). Each layer explains the next.
- Realistic 2026 benchmarks: ~2–4% positive reply rate on cold email, 25–35% meeting-held rate, and 8–12 SQLs per BDR per month for mid-market.
- Data quality is a KPI multiplier. Bad contact data silently destroys every downstream number — bounce rate and connect rate are early-warning signals.
- Review weekly, coach on ratios. A BDR with low meetings but a high reply-to-meeting ratio has a targeting problem, not an effort problem.
What are BDR KPIs?#
BDR KPIs are the metrics that measure how effectively a Business Development Representative turns raw outreach into qualified pipeline. Think of a BDR as the scout ahead of the main army: their job isn't to win the deal, it's to find the right battles and hand off clean, qualified opportunities to Account Executives.
That handoff is the whole point. So the best KPIs answer one question: is this rep generating pipeline that actually closes? Everything else is a supporting indicator.
The trap most teams fall into is measuring effort instead of results. Dials and emails sent feel productive and are trivial to report, but they're inputs — not outcomes. A rep can send 300 emails a week to a garbage list and produce nothing. Another rep sends 120 to a tightly researched list and books eight meetings. If your dashboard only shows volume, you'd promote the wrong person.
What's the difference between activity, conversion, and outcome KPIs?#
Strong BDR measurement uses three layers, and each layer explains the one above it. When pipeline drops, you walk down the layers to find the broken step.
- Activity KPIs (leading indicators) — what the rep does: calls made, emails sent, LinkedIn touches, sequences started. These predict future results but guarantee nothing on their own.
- Conversion KPIs (efficiency indicators) — how well activity turns into interest: connect rate, positive reply rate, reply-to-meeting rate. These expose targeting and messaging quality.
- Outcome KPIs (lagging indicators) — what the business actually banks: meetings held, SQLs accepted by AEs, pipeline value sourced, and influenced revenue.
The magic is in the ratios between layers. High activity plus low conversion means your list or message is weak. High conversion plus low outcome means qualification or AE acceptance is broken. You can't diagnose either without all three layers.
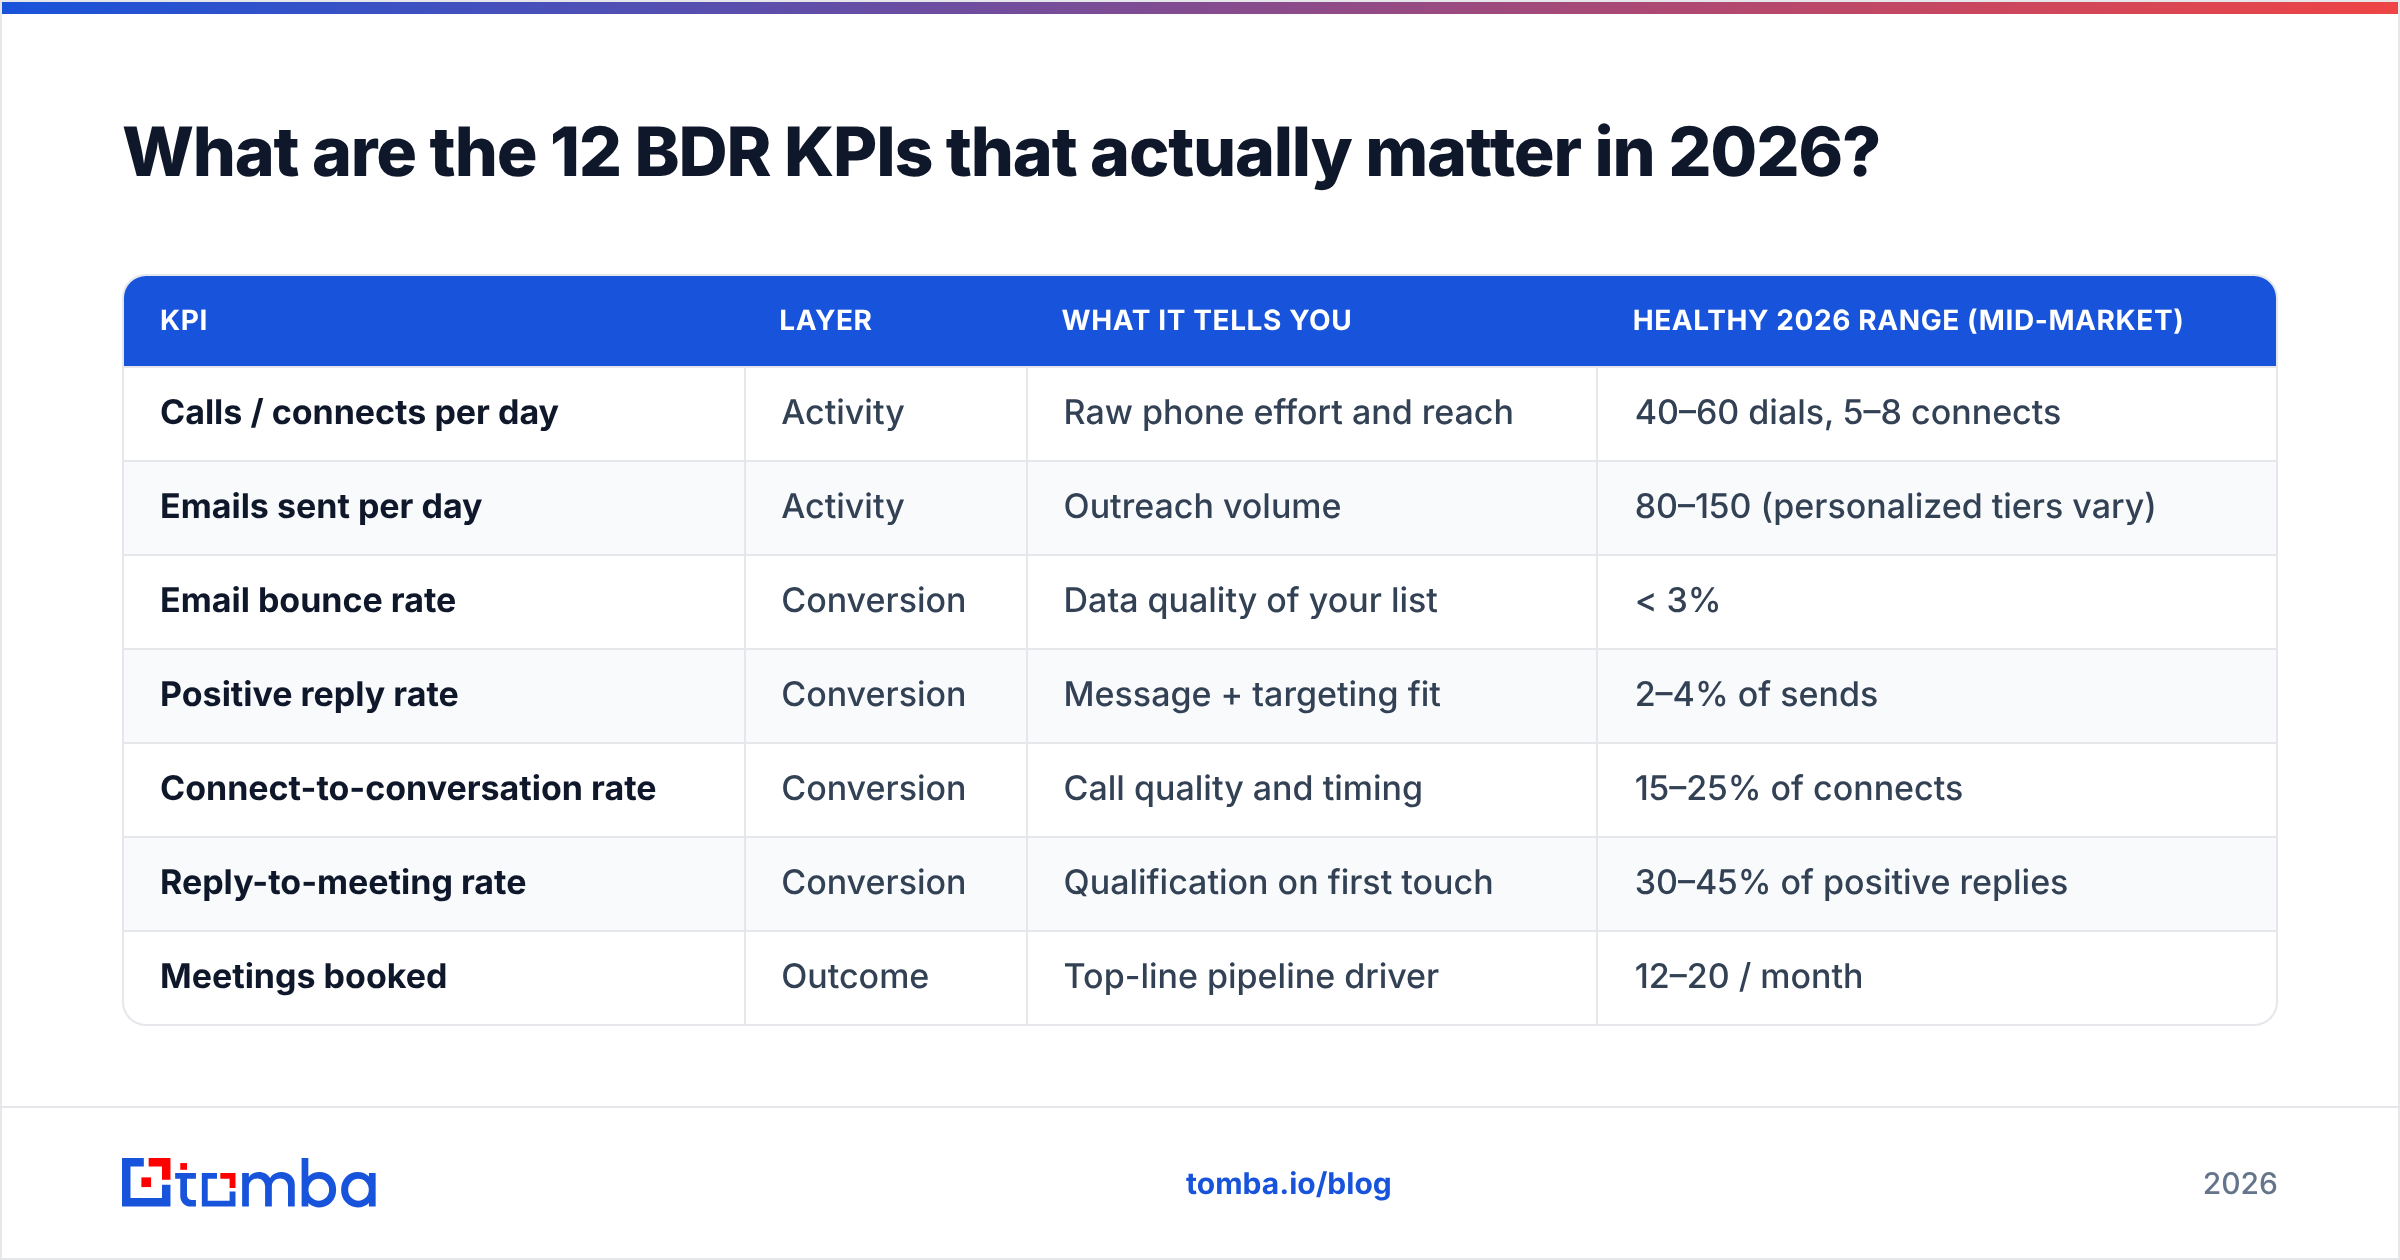
What are the 12 BDR KPIs that actually matter in 2026?#
Here's the core set. Track these and you can explain any pipeline number on your board.
| KPI | Layer | What it tells you | Healthy 2026 range (mid-market) |
|---|---|---|---|
| Calls / connects per day | Activity | Raw phone effort and reach | 40–60 dials, 5–8 connects |
| Emails sent per day | Activity | Outreach volume | 80–150 (personalized tiers vary) |
| Email bounce rate | Conversion | Data quality of your list | < 3% |
| Positive reply rate | Conversion | Message + targeting fit | 2–4% of sends |
| Connect-to-conversation rate | Conversion | Call quality and timing | 15–25% of connects |
| Reply-to-meeting rate | Conversion | Qualification on first touch | 30–45% of positive replies |
| Meetings booked | Outcome | Top-line pipeline driver | 12–20 / month |
| Meeting-held (show) rate | Outcome | Lead quality + confirmation process | 70–80% |
| SQLs accepted by AE | Outcome | True qualified pipeline | 8–12 / month |
| Opportunity conversion rate | Outcome | SQL → real opportunity | 60–75% |
| Pipeline value sourced | Outcome | Dollar contribution | Varies by ACV |
| Speed-to-lead (inbound) | Conversion | Follow-up discipline | < 5 minutes |
You don't need a fourteenth metric. You need these twelve, reviewed honestly. Adding more usually means hiding the uncomfortable ones.
Why bounce rate is the canary in the coal mine#
Bounce rate looks like an email-ops detail, but it's actually a leading indicator for everything downstream. A 12% bounce rate means one in eight prospects never saw your message, your sender reputation is eroding, and your connect rate is quietly collapsing. High bounces also signal that the rest of your data — titles, phone numbers, company info — is probably stale too.
This is where data sourcing becomes a KPI lever, not a back-office task. Before a sequence ever starts, verifying contacts with an email verifier keeps bounce rate under 3% and protects every conversion metric that follows. Clean inputs are the cheapest way to lift outcome numbers.
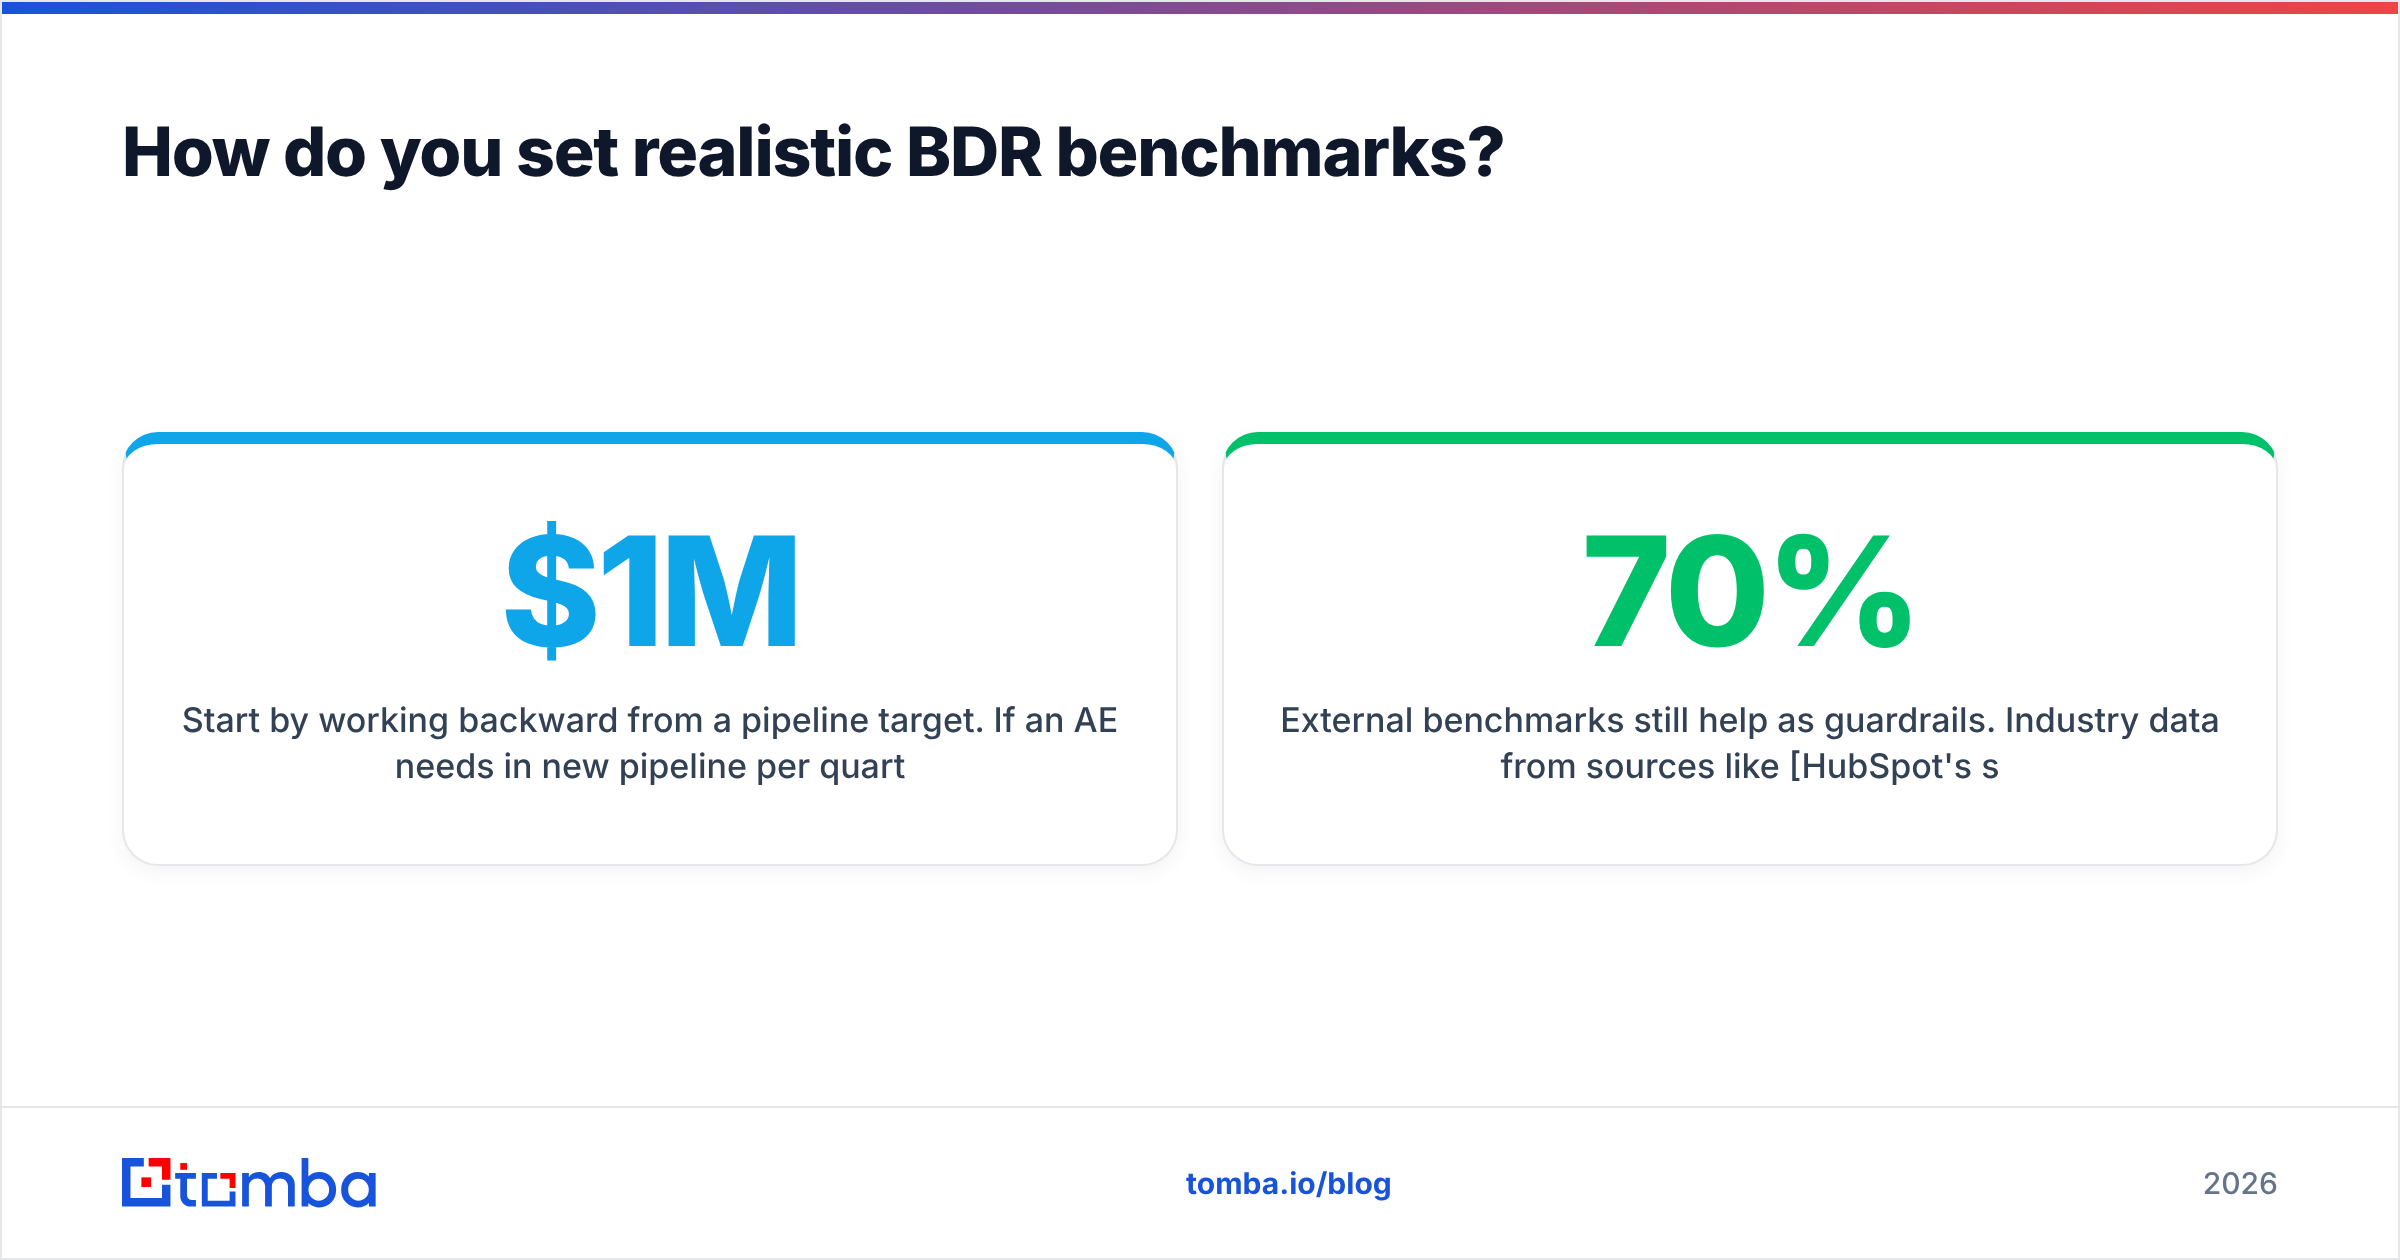
How do you set realistic BDR benchmarks?#
Conclusion first: benchmark against your own funnel math, then sanity-check against industry ranges — never the reverse.
Start by working backward from a pipeline target. If an AE needs $1M in new pipeline per quarter and your average opportunity is $25K, that's 40 opportunities. At a 65% SQL-to-opportunity rate, you need ~62 SQLs. At 10 SQLs per BDR per month, that's roughly two BDRs feeding that AE. Now you know whether your problem is headcount, conversion, or targeting — before you blame anyone.
External benchmarks still help as guardrails. Industry data from sources like HubSpot's sales research and peer review sites such as G2 consistently show cold-email positive reply rates clustering in the low single digits and meeting-held rates in the 70% range. If your numbers are wildly outside those bands, dig in before celebrating or panicking.
Three rules for honest benchmarking:
- Segment by motion. Outbound cold, inbound follow-up, and event-driven outreach have completely different conversion curves. Blending them produces a meaningless average.
- Use rolling windows. A single week is noise. Look at trailing 4-week and 12-week trends to separate signal from a bad Monday.
- Benchmark ratios, not raw counts. "20 meetings" means nothing without the activity it took to get them.
Which BDR KPIs are vanity metrics?#
A KPI is vanity when it goes up without the business getting better. Watch for these:
- Total activities. A blended "activity score" that mixes emails, calls, and tasks rewards motion over results. Drop it.
- Emails sent (in isolation). Easy to inflate, says nothing about quality. Only meaningful next to reply and bounce rates.
- Sequence enrollments. Enrolling 500 contacts is not pipeline. Enrolling the right 200 is.
- Raw LinkedIn views. Visibility ≠ interest. Track response rate, not impressions.
The fix is cultural as much as analytical. When reps know meetings-held and accepted SQLs are what matter, they self-correct toward better lists and tighter messaging. When they're graded on dials, they dial — into voicemail, all day.
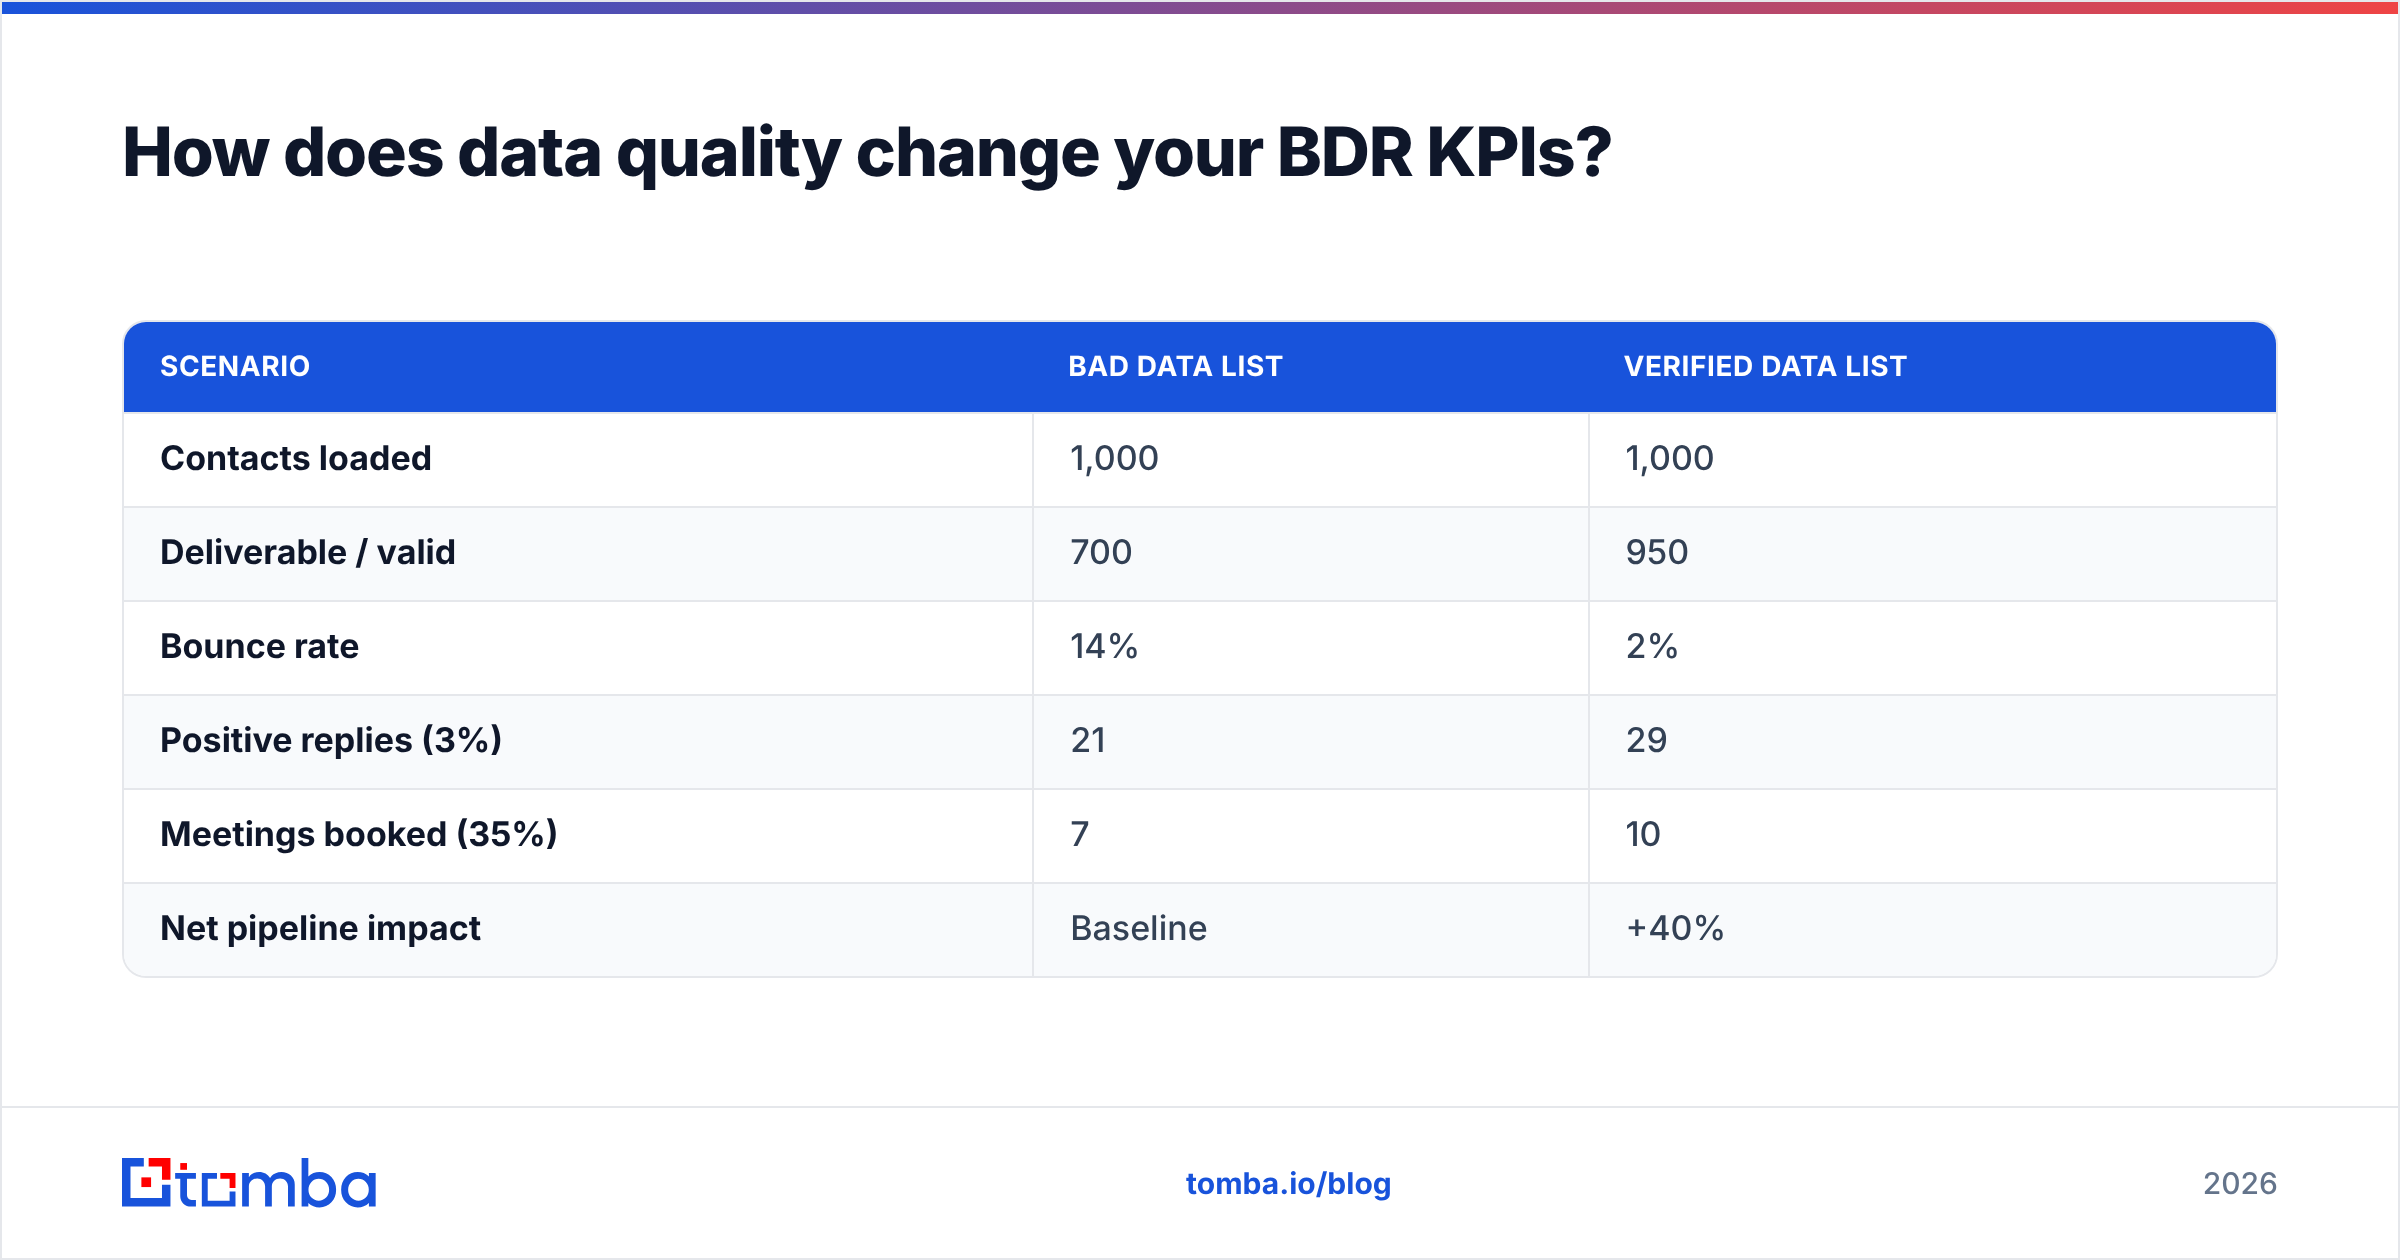
How does data quality change your BDR KPIs?#
Data quality is the silent multiplier on every BDR metric. You can't out-hustle a bad list, and you can't coach your way past contacts who don't exist.
Consider two reps with identical effort and skill. Rep A works a list with 92% deliverable, accurate contacts. Rep B works a list at 70% accuracy. Rep B loses three in ten touches before the message is even read — and those losses compound through every downstream ratio. Same effort, half the pipeline. The gap isn't talent; it's inputs.
| Scenario | Bad data list | Verified data list |
|---|---|---|
| Contacts loaded | 1,000 | 1,000 |
| Deliverable / valid | 700 | 950 |
| Bounce rate | 14% | 2% |
| Positive replies (3%) | 21 | 29 |
| Meetings booked (35%) | 7 | 10 |
| Net pipeline impact | Baseline | +40% |
That +40% came from no extra activity — just better inputs. This is why mature teams treat sourcing as part of the KPI system. Tools like the Tomba Email Finder and domain search let BDRs build verified lists by company and role, while bulk lead generation keeps large campaigns clean before launch. For phone-heavy teams, accurate B2B phone numbers do the same thing for connect rate.
How do you build a BDR scorecard that drives behavior?#
A scorecard is the contract between what you measure and how reps act. Build it to reward outcomes, surface diagnostics, and stay simple enough to read in thirty seconds.
The three-tier scorecard:
- One north-star outcome — accepted SQLs or pipeline sourced. This is what the role exists to produce.
- Two or three conversion ratios — positive reply rate, reply-to-meeting rate, meeting-held rate. These show how the outcome was earned and where coaching applies.
- Activity as a floor, not a goal — a minimum bar (e.g., 100 quality touches/week) that flags disengagement, never the headline number.
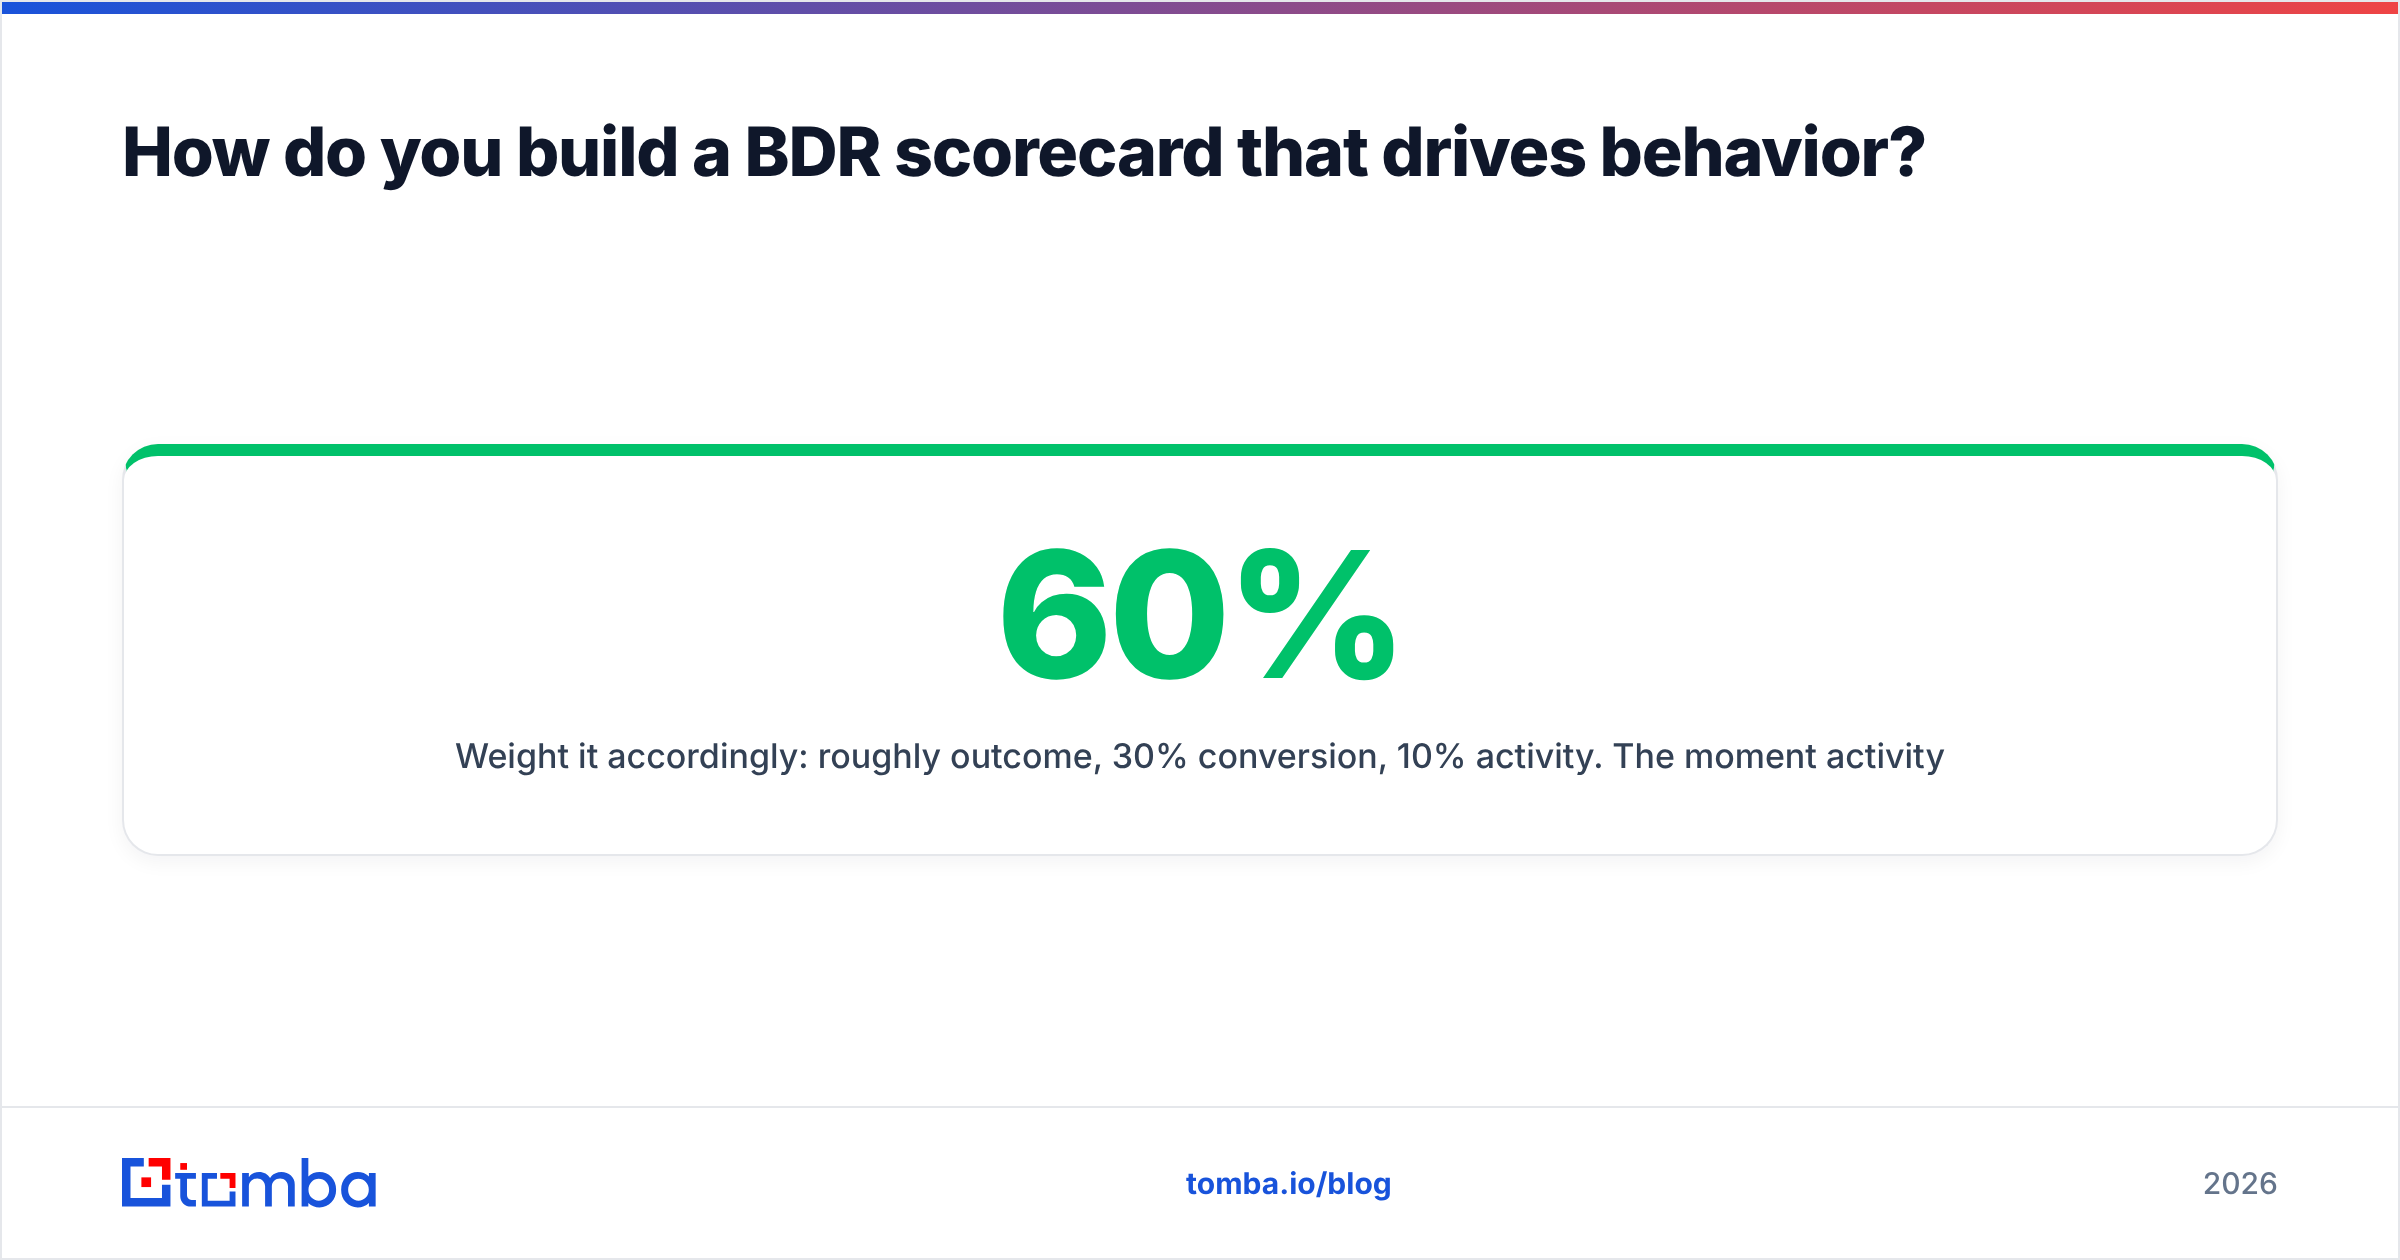
Weight it accordingly: roughly 60% outcome, 30% conversion, 10% activity. The moment activity dominates the weighting, you've recreated the vanity-metric trap.
Review cadence that works:
- Daily: reps self-check activity floor and speed-to-lead.
- Weekly: manager reviews conversion ratios per rep, coaches the weakest ratio.
- Monthly: review outcomes and pipeline contribution against target.
- Quarterly: re-benchmark ranges and adjust targets to reality.
Coach on the ratio, not the symptom. A rep with low meetings but a strong reply-to-meeting ratio is reaching too few of the right people — a list problem you solve with better data and contact enrichment, not a motivation problem you solve with a pep talk.
How often should you review BDR KPIs?#
Weekly for conversion, monthly for outcomes. Conclusion first because the instinct to review everything daily does more harm than good — daily outcome reviews turn normal variance into panic and push reps toward short-term gaming.
The rhythm matters because each KPI layer moves at a different speed. Activity changes hour to hour. Conversion stabilizes over a week. Outcomes only make sense over a month because deal cycles and AE acceptance introduce lag. Reviewing a lagging metric on a leading cadence is like weighing yourself hourly to track a diet — all noise, no signal.
One discipline separates good RevOps teams: they review KPIs together with the data feeding them. A dip in meetings booked always gets traced back through reply rate and bounce rate before anyone touches the script. Half the time the real culprit is list decay, fixed faster with a refreshed source than a rewritten email.
Common BDR KPI mistakes to avoid#
- Grading everyone on the same numbers. A new rep and a tenured rep need different targets. Use ramp-adjusted benchmarks for the first 90 days.
- Ignoring meeting-held rate. Booked meetings that no-show are vanity in disguise. The held rate, plus a confirmation process, is the real number.
- Decoupling BDRs from AE feedback. If AEs reject half the SQLs, your qualification bar is broken — track accepted SQLs, not just submitted ones.
- Letting data rot. Lists decay ~2–3% per month as people change jobs. Without ongoing verification, your KPIs degrade even if behavior is perfect.
- Over-instrumenting. Twenty KPIs means no KPIs. Pick the twelve above, master them, then revisit.
The bottom line#
BDR KPIs only earn their keep when they predict pipeline. Anchor your scorecard to outcomes, use conversion ratios to diagnose, treat activity as a floor, and protect every metric with clean, verified data. Do that and your dashboard stops being a report card and becomes a steering wheel.
Ready to lift the numbers at the top of your funnel? Most BDR conversion problems start with the list, not the rep. Build verified, role-targeted prospect lists with the Tomba Email Finder — find accurate professional emails by domain, name, or company, verify them before you send, and watch bounce rate fall while meetings-held climbs. Start free with 25 searches a month, or compare Tomba pricing when your team is ready to scale.
Ready to find emails that actually work?
Join 150,000+ professionals who stopped guessing and started sending. Free credits on signup — no credit card required.
Get the Tomba newsletter
Practical outbound tactics and product updates — once every two weeks.
About the author