BDR Metrics in 2026: The 12 KPIs That Actually Predict Pipeline
Most BDR dashboards track activity nobody acts on. Here are the 12 BDR metrics that actually predict pipeline in 2026 — with benchmarks, formulas, and the leading indicators worth your weekly review.
Most BDR scorecards measure motion, not results. A rep can hit 80 dials and 50 emails a day for a quarter and still source zero revenue — and a dashboard full of green activity bars will never tell you why. The fix is not more metrics. It is the right metrics, read in the right order.
TL;DR#
- Activity is an input, not a result. Track dials and emails to diagnose effort, but judge BDRs on pipeline sourced and meetings held.
- The single most predictive BDR metric is qualified meetings held, not booked — no-shows quietly destroy 20–40% of "booked" numbers.
- Conversion rates between stages (contact → meeting → opportunity → pipeline) tell you exactly where a rep is leaking, faster than any volume count.
- Data quality is an upstream metric. Bad contact data inflates bounce rates, kills connect rates, and makes every downstream number lie.
- Review leading indicators weekly, lagging indicators monthly. Confusing the two is why most BDR coaching arrives a quarter too late.
What are BDR metrics, and why do most teams measure the wrong ones?#
BDR metrics are the quantitative measures of how effectively a Business Development Representative turns raw outbound effort into qualified pipeline. Think of them like a car dashboard: speed and fuel (activity) tell you the engine is running, but distance toward the destination (pipeline) tells you whether you'll actually arrive.
The mistake nearly every team makes is treating the speedometer as the destination. Counting 100 dials a day feels productive and is easy to chart, but it answers the wrong question. The real question is: of everything this rep did, how much became revenue the company can forecast?
Metrics fall into three layers, and you need all three working together:
- Activity metrics — dials, emails sent, social touches, sequences started. These are inputs. Useful for diagnosing effort, dangerous as goals.
- Efficiency metrics — connect rate, reply rate, meeting conversion. These show how well the activity is working.
- Outcome metrics — qualified meetings held, opportunities created, pipeline sourced. These are what the business actually pays for.
When leadership only watches layer one, reps optimize for the thing being watched — they spray volume, burn good accounts, and torch deliverability. You get the activity you reward, which is exactly the problem.

Which BDR metrics actually predict pipeline?#
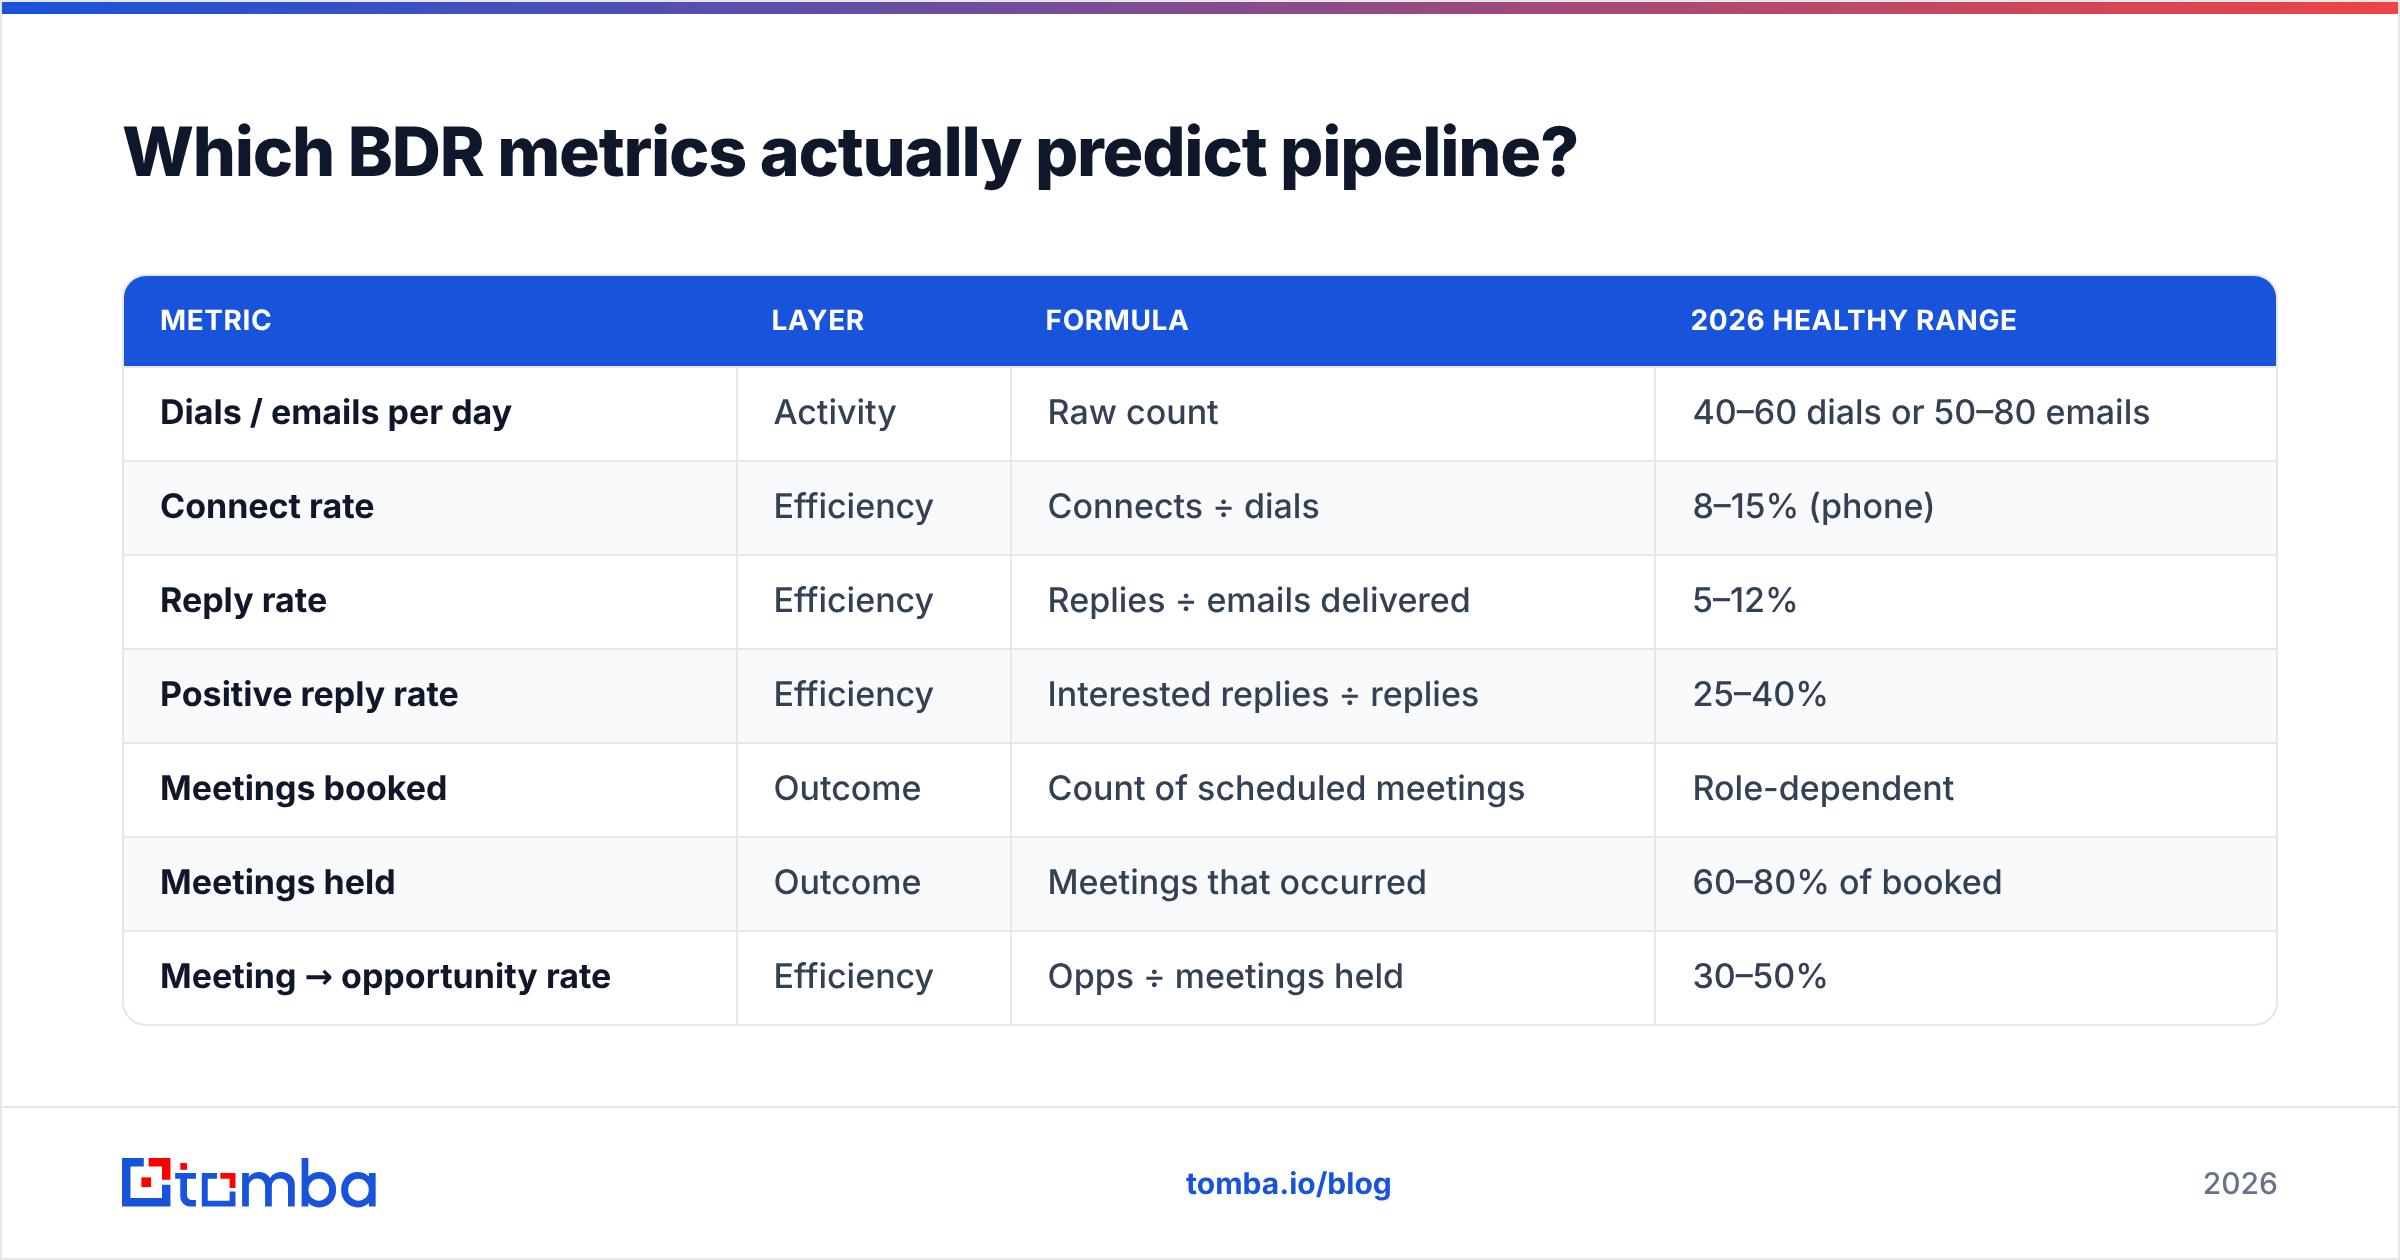
Here are the twelve that earn a place on a real scorecard, grouped by layer, with how to read each one.
| Metric | Layer | Formula | 2026 healthy range |
|---|---|---|---|
| Dials / emails per day | Activity | Raw count | 40–60 dials or 50–80 emails |
| Connect rate | Efficiency | Connects ÷ dials | 8–15% (phone) |
| Reply rate | Efficiency | Replies ÷ emails delivered | 5–12% |
| Positive reply rate | Efficiency | Interested replies ÷ replies | 25–40% |
| Meetings booked | Outcome | Count of scheduled meetings | Role-dependent |
| Meetings held | Outcome | Meetings that occurred | 60–80% of booked |
| Meeting → opportunity rate | Efficiency | Opps ÷ meetings held | 30–50% |
| Qualified opportunities created | Outcome | Count accepted by AE | Quota-driven |
| Pipeline sourced ($) | Outcome | Sum of opp value | Quota-driven |
| Bounce rate | Data quality | Bounces ÷ emails sent | < 3% |
| Sequence completion rate | Efficiency | Finished ÷ started | > 70% |
| Ramp time | Management | Days to first sourced opp | 30–60 days |
A few of these deserve special attention because they are where teams most often fool themselves.
Meetings held vs. meetings booked. This is the one that quietly wrecks forecasts. A BDR can "book" 20 meetings and have 12 actually happen. If you compensate and report on booked, you are paying for calendar invites, not conversations. Always track held as the primary number and use the held-to-booked ratio as a no-show diagnostic.
Positive reply rate. A 12% reply rate looks great until you learn 80% of those replies are "unsubscribe" or "wrong person." Splitting positive from total replies turns a vanity number into a coaching signal.
Pipeline sourced in dollars. This is the metric that connects a BDR to revenue. Two reps can create the same number of opportunities while one sources triple the pipeline value because they target better accounts. Volume hides this; dollar value exposes it.
How do you calculate the conversion rates between stages?#
Conversion rates are where coaching becomes surgical. Instead of telling a rep to "do more," you can point at the exact step where their funnel leaks.
Walk the funnel as a sequence of ratios:
- Contacted → Connected: did the message land and get a response at all?
- Connected → Meeting Booked: can they turn a conversation into a calendar hold?
- Meeting Booked → Meeting Held: are they confirming and reminding well?
- Meeting Held → Opportunity: is the meeting quality high enough that AEs accept it?
- Opportunity → Pipeline value: are they targeting accounts worth real money?
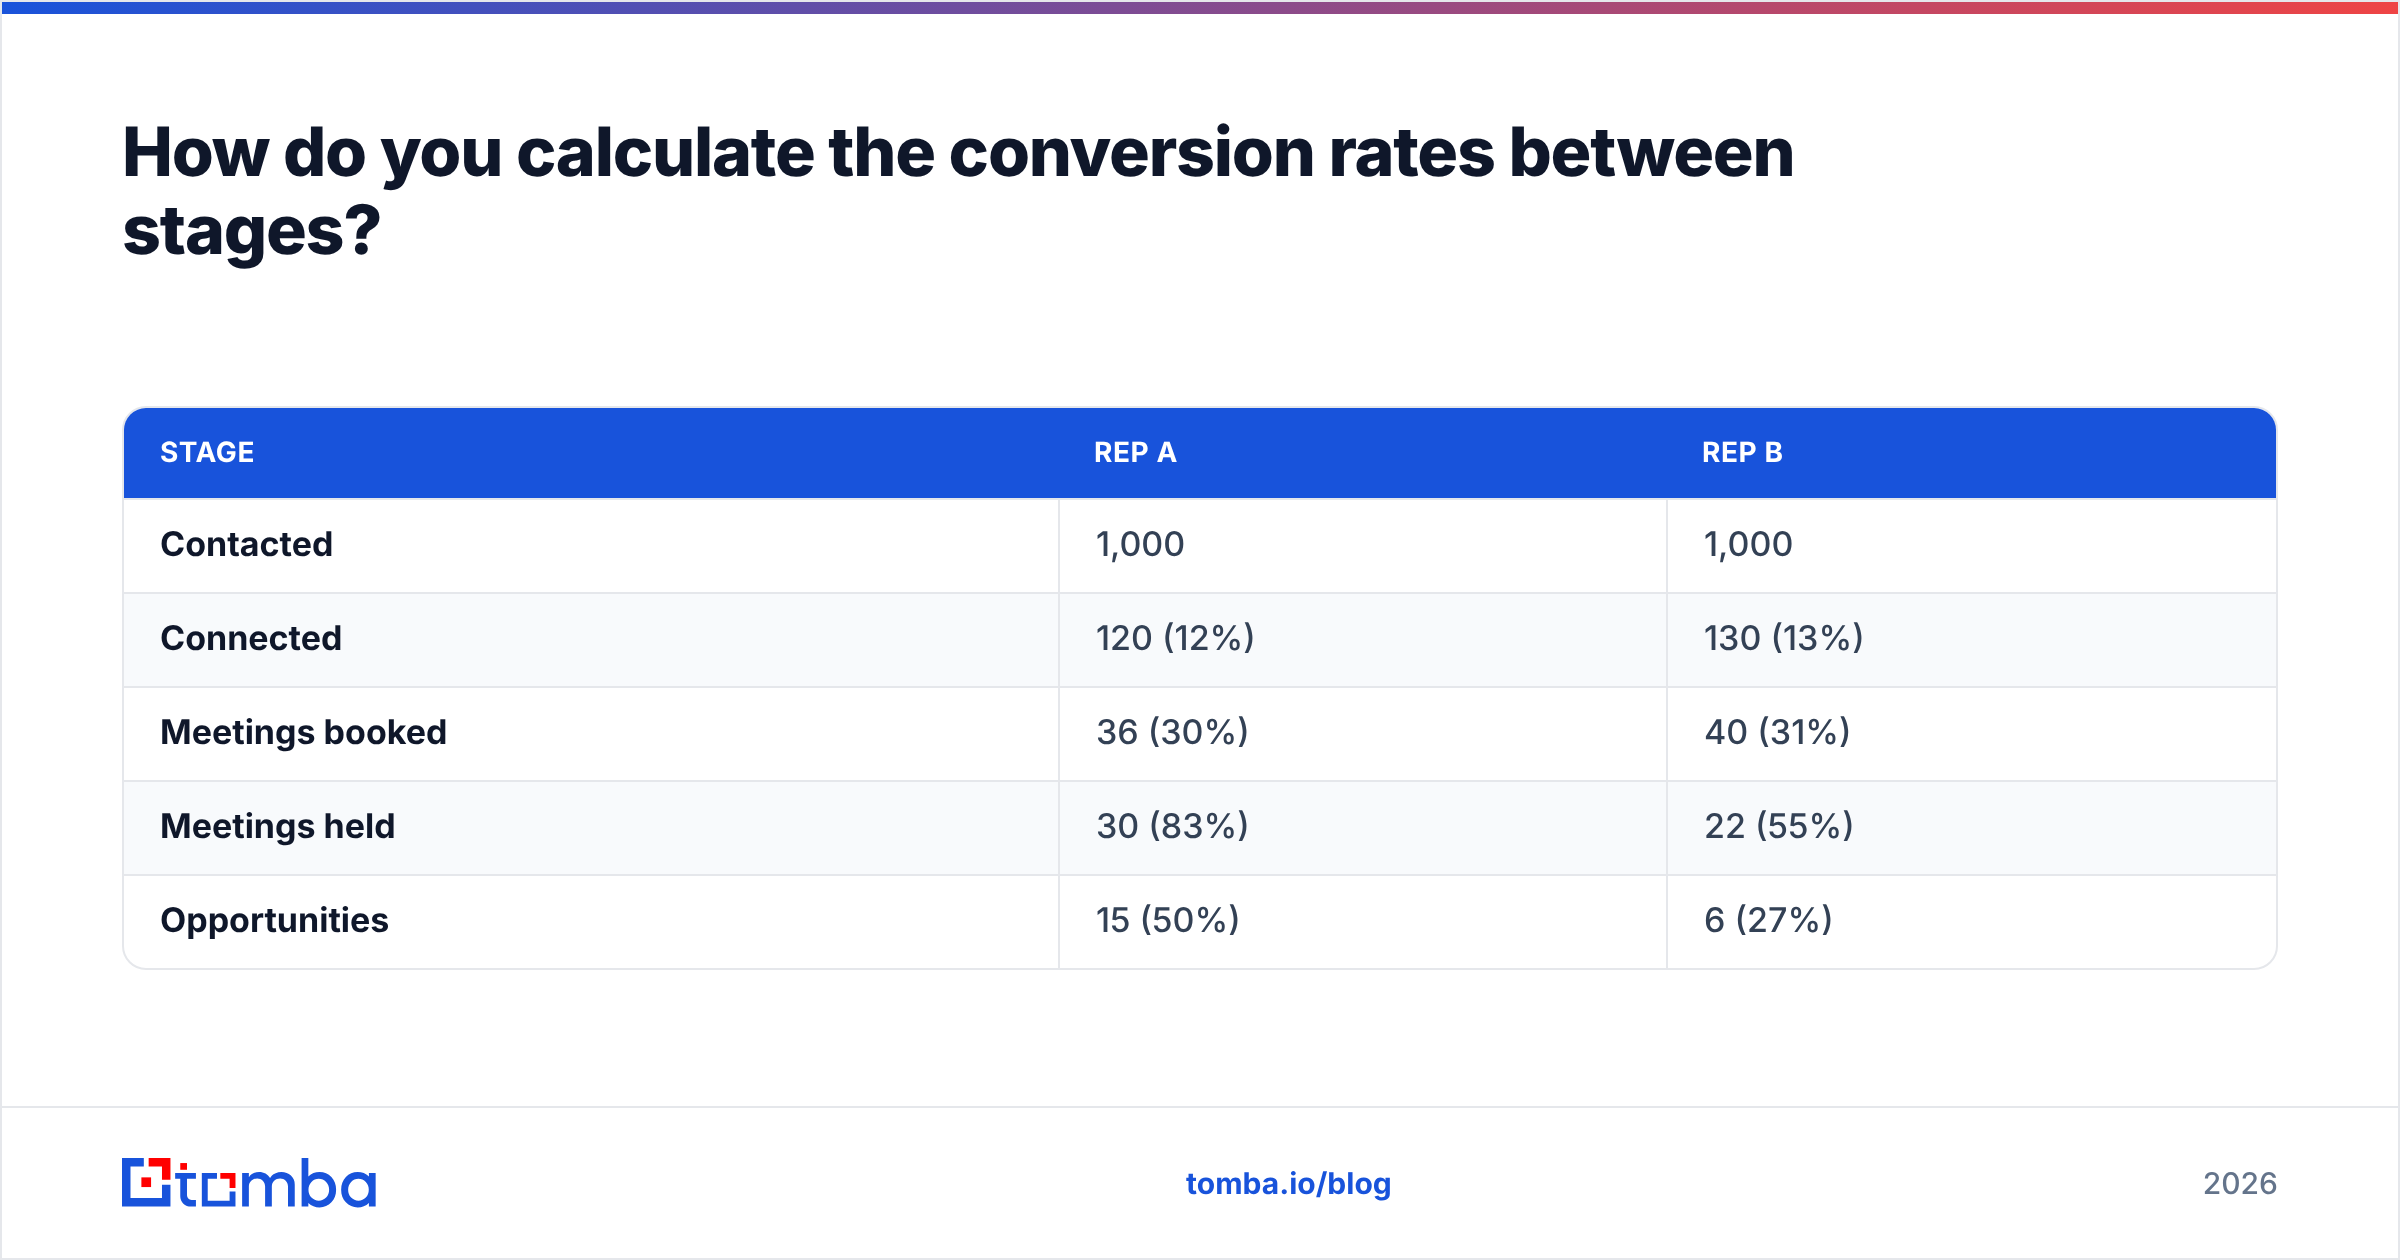
A worked example makes the diagnostic power obvious. Say two BDRs each contact 1,000 prospects in a month:
| Stage | Rep A | Rep B |
|---|---|---|
| Contacted | 1,000 | 1,000 |
| Connected | 120 (12%) | 130 (13%) |
| Meetings booked | 36 (30%) | 40 (31%) |
| Meetings held | 30 (83%) | 22 (55%) |
| Opportunities | 15 (50%) | 6 (27%) |
On activity, the two reps look identical. But Rep B is leaking at held (a confirmation/reminder problem) and again at opportunity (a qualification problem). No amount of "make more calls" fixes that — Rep B needs a confirmation cadence and tighter qualification, and the metric told you precisely that. This is why a win rate discussion that starts at the BDR layer is far more useful than one that starts at the deal stage.
For deeper benchmarks on what "good" looks like by segment, the Salesforce State of Sales report is a credible neutral reference, and G2's sales engagement category is useful for tooling baselines.
Why is data quality a BDR metric, not just an ops problem?#
Bad data corrupts every other number on this list — so contact data accuracy belongs on the BDR scorecard, not buried in a RevOps ticket queue.
Here is the chain reaction. A BDR works a list where 25% of the emails are wrong or outdated. Those messages bounce, which drags down sender reputation. Lower reputation means even the correct emails start landing in spam, so reply rate drops. The rep, seeing low replies, sends more volume to compensate, which accelerates the reputation damage. Within weeks, a data problem looks like a performance problem, and you coach the rep instead of fixing the list.
You can measure data quality directly:
- Bounce rate — keep it under 3%. Anything higher is a list-hygiene emergency, not a copywriting issue.
- Catch-all percentage — domains that accept everything hide invalid addresses; flag them so reps don't trust a "valid" status blindly.
- Enrichment coverage — what share of your target accounts have a verified direct contact versus a generic info@ address?
- Data freshness — B2B contact data decays roughly 2–3% per month as people change jobs, so a list from last year is materially wrong today.
This is where tooling earns its keep. Running prospects through an email verifier before a sequence starts keeps bounce rates low and protects the deliverability of every rep on the domain. Pulling contacts with a verified email finder instead of guessing patterns means reps spend time on conversations, not on bounced sends. And a catch-all verifier closes the most common blind spot in B2B lists. Clean inputs make every other BDR metric trustworthy.
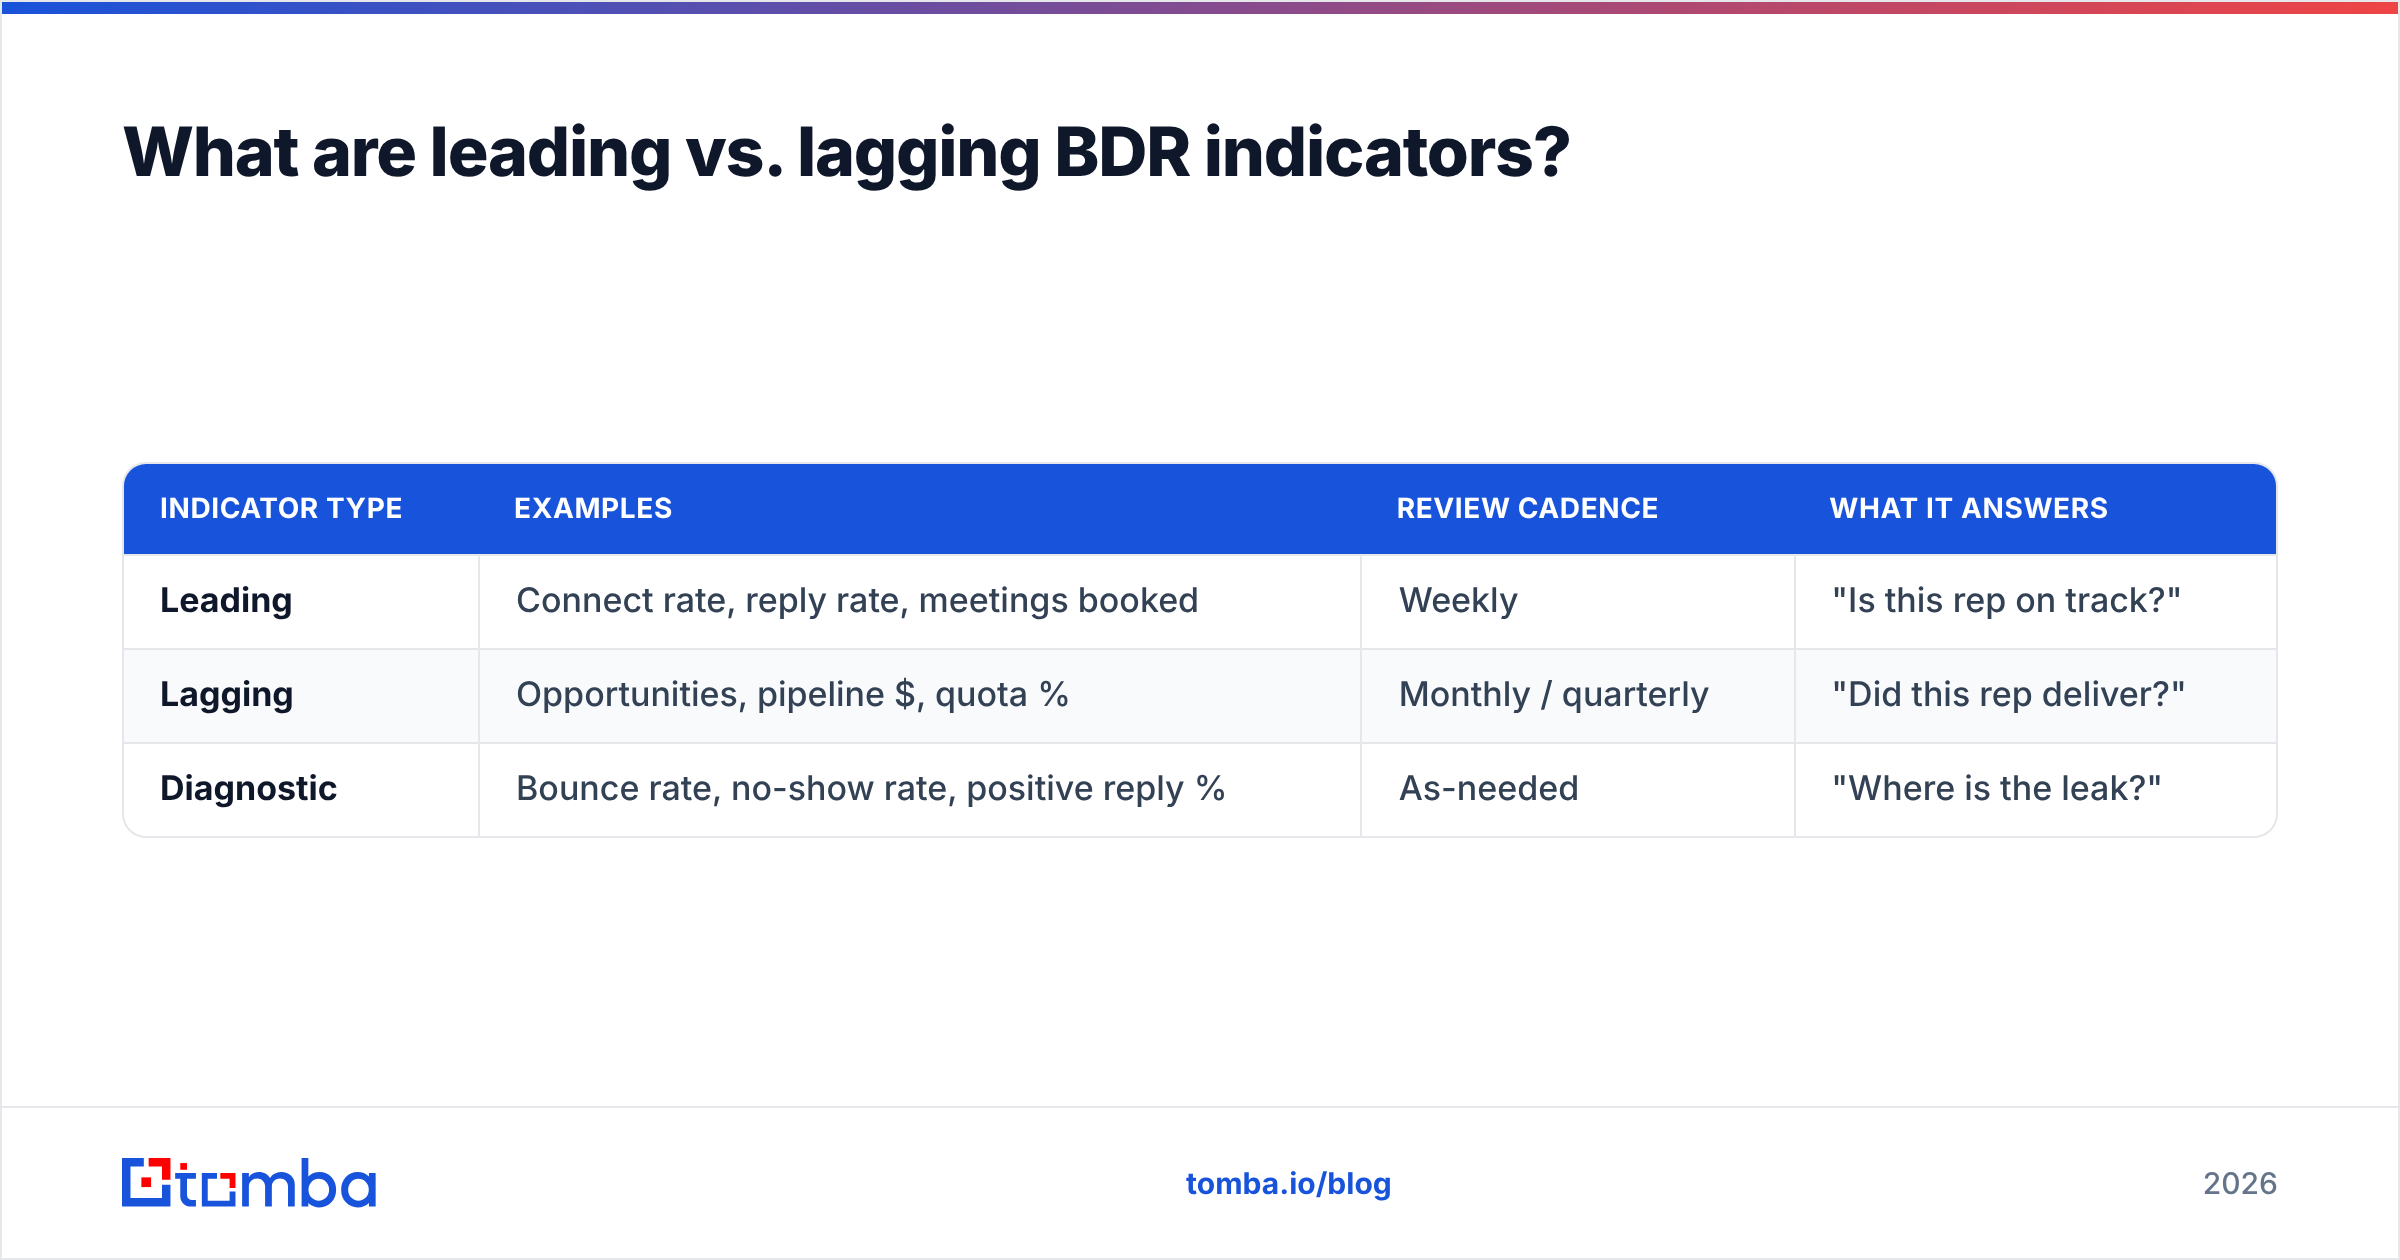
What are leading vs. lagging BDR indicators?#
Leading indicators predict the future; lagging indicators report the past. Reading them on the wrong cadence is why so much BDR coaching arrives too late to matter.
Leading indicators change daily and forecast next month's pipeline:
- Activity volume and consistency
- Connect and reply rates
- Meeting booking rate
- Sequence completion rate
Lagging indicators confirm what already happened:
- Qualified opportunities created
- Pipeline sourced in dollars
- Closed-won revenue influenced
- Quota attainment
The practical rule: review leading indicators weekly, lagging indicators monthly. If a rep's connect rate craters in week one, you can intervene before the month is lost. If you wait for end-of-month pipeline numbers to notice, you have already burned 30 days of bad activity. A weekly one-on-one anchored on three leading metrics beats a monthly review of lagging ones every time.
| Indicator type | Examples | Review cadence | What it answers |
|---|---|---|---|
| Leading | Connect rate, reply rate, meetings booked | Weekly | "Is this rep on track?" |
| Lagging | Opportunities, pipeline $, quota % | Monthly / quarterly | "Did this rep deliver?" |
| Diagnostic | Bounce rate, no-show rate, positive reply % | As-needed | "Where is the leak?" |
How should you build a BDR scorecard that drives behavior?#
Build the scorecard around outcomes, weight it toward what the business pays for, and keep it short enough that a rep can recite it from memory.
A scorecard with twenty metrics is a scorecard with zero priorities. Pick one outcome metric as the headline, support it with two or three efficiency metrics, and use activity only as a diagnostic floor. A workable weighting:
- 50% — Pipeline sourced (or qualified meetings held). The headline. This is the job.
- 30% — Conversion efficiency (meeting → opportunity rate). Rewards quality over spray.
- 20% — Activity floor. Not a target to maximize, a minimum to clear. Below it, nothing else is possible; above it, more volume isn't the point.
Two principles keep the scorecard honest. First, never compensate purely on activity — you will get activity theater. Second, pair every volume metric with a quality metric so reps can't game one without the other. If you reward meetings booked, also track meetings held and opportunity conversion, or you will drown AEs in junk meetings.
For tooling, the right stack feeds the scorecard automatically. Pull and verify contacts with a domain search and bulk email finder, push them into your sequencer, and let your CRM roll the outcomes up. When the data layer is clean, the scorecard reflects rep skill instead of list quality. Standard sales automation closes the loop so reps spend their hours selling, not maintaining spreadsheets.
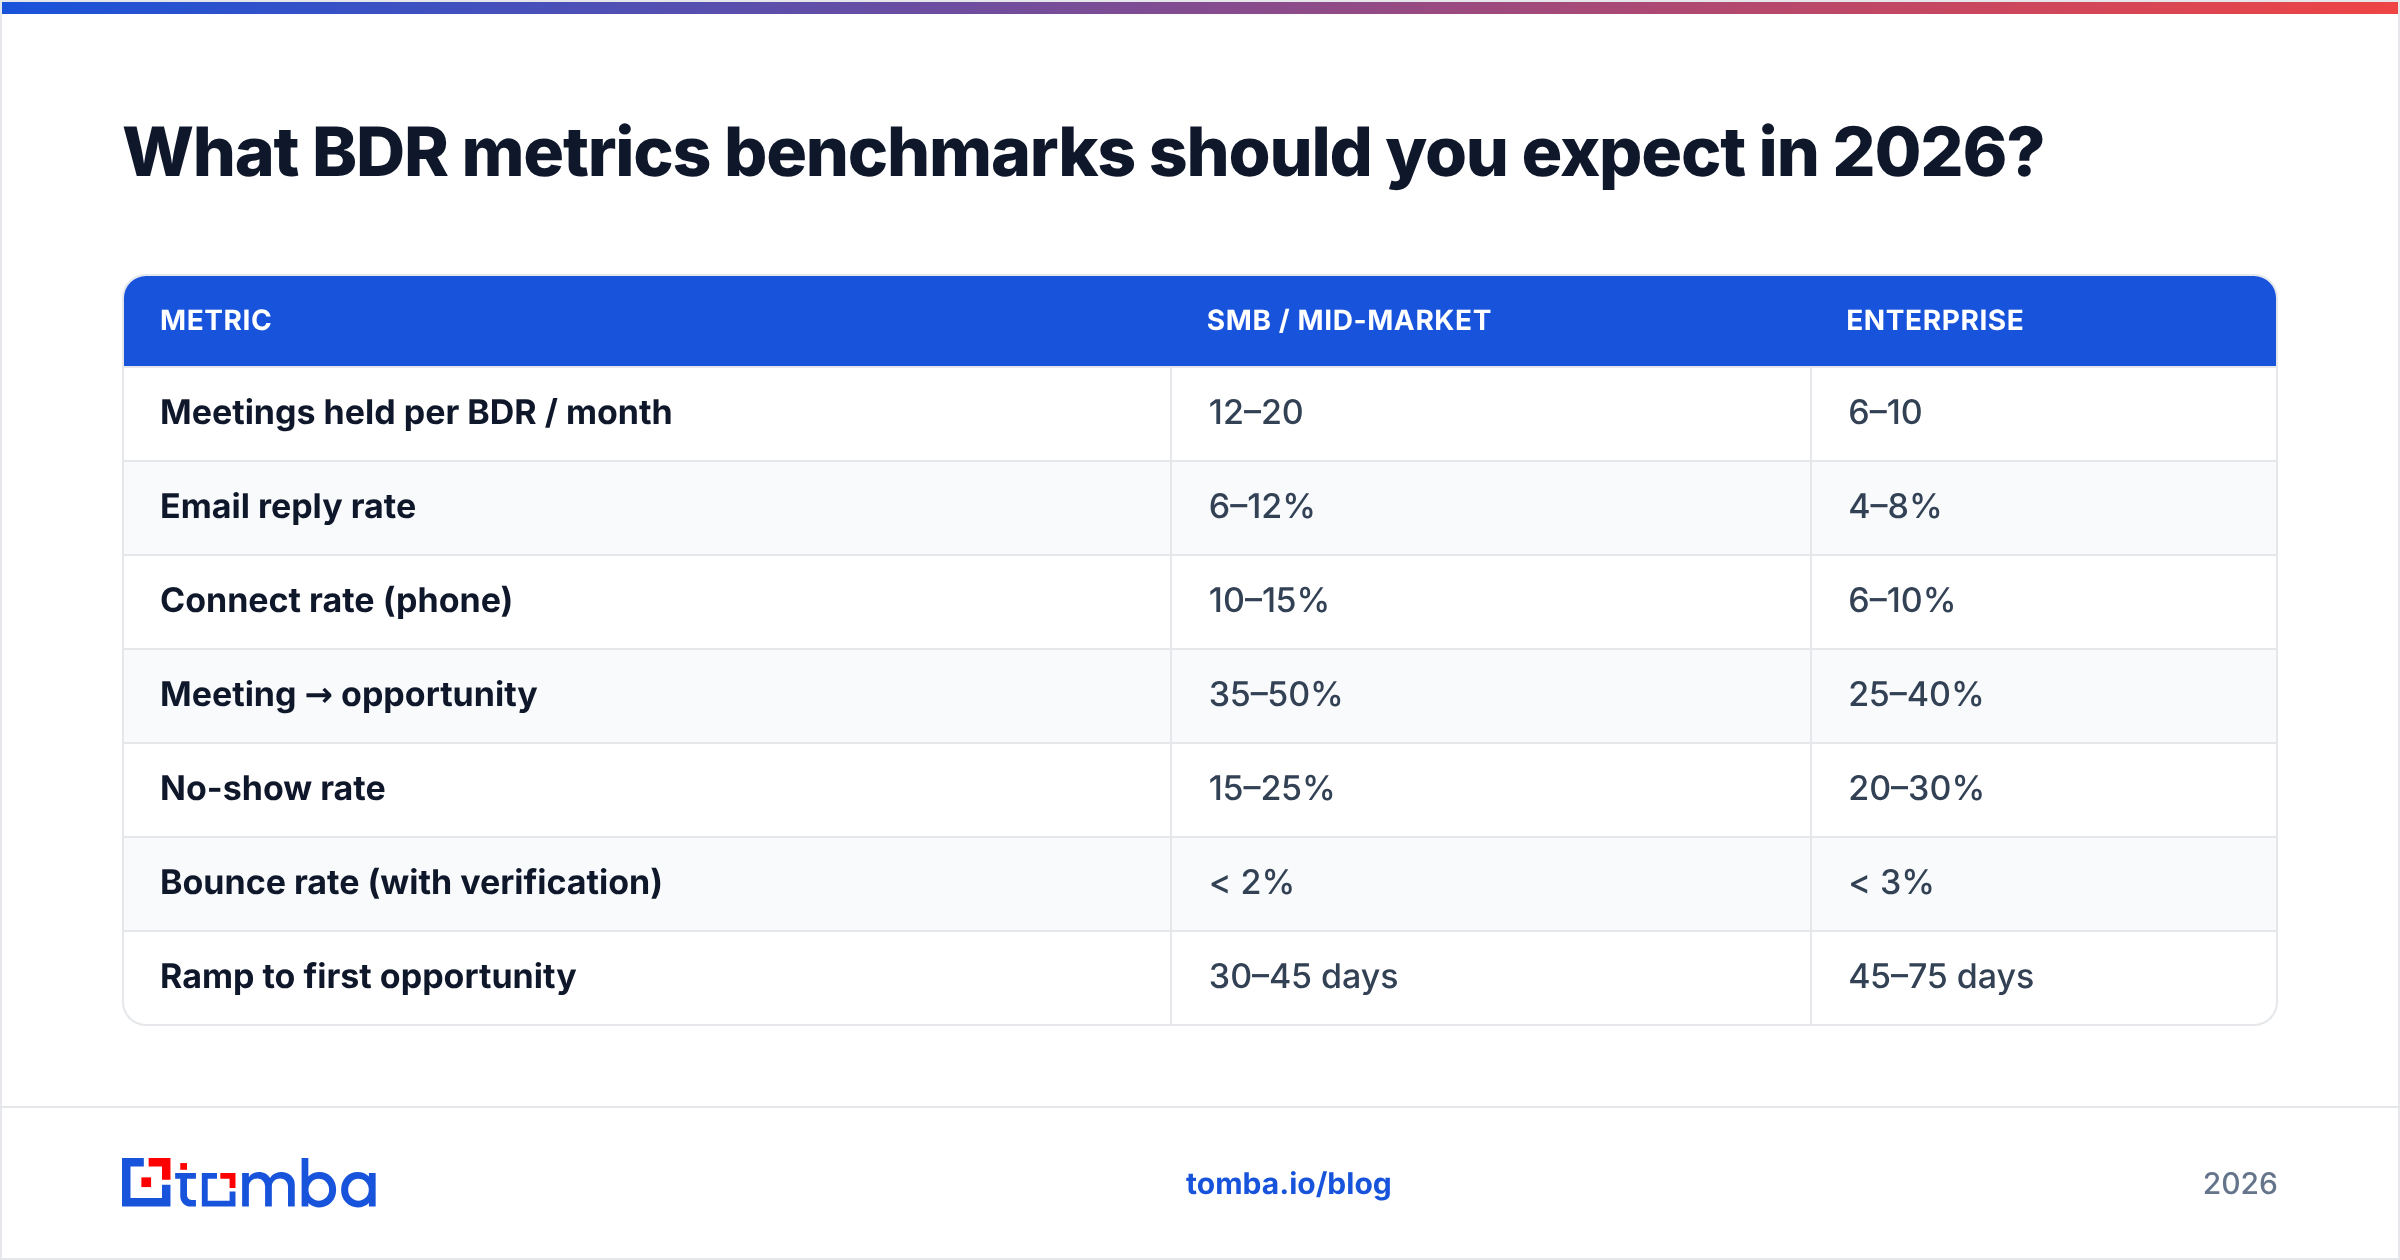
What BDR metrics benchmarks should you expect in 2026?#
Benchmarks vary by motion — enterprise outbound looks nothing like SMB inbound — but these ranges hold for most B2B teams running blended cold outbound in 2026:
| Metric | SMB / Mid-market | Enterprise |
|---|---|---|
| Meetings held per BDR / month | 12–20 | 6–10 |
| Email reply rate | 6–12% | 4–8% |
| Connect rate (phone) | 10–15% | 6–10% |
| Meeting → opportunity | 35–50% | 25–40% |
| No-show rate | 15–25% | 20–30% |
| Bounce rate (with verification) | < 2% | < 3% |
| Ramp to first opportunity | 30–45 days | 45–75 days |
Two trends are reshaping these numbers. AI-assisted personalization has pushed top-quartile reply rates higher while average reply rates fall — the spread between good and bad outreach is widening. And signal-based outbound (intent, job changes, funding) is producing meeting-to-opportunity rates well above the table above, because the timing is better. Both trends reward clean, enriched data over raw volume.
If your numbers sit below these ranges, resist the urge to assume your reps are the problem. Check data quality first, conversion rates second, and activity last. The leak is almost never where the volume dashboard points.
Frequently asked questions#
What is the most important BDR metric? Qualified meetings held, or pipeline sourced in dollars if you can attribute it cleanly. Both measure outcomes the business pays for, unlike activity counts.
How often should BDR metrics be reviewed? Leading indicators (connect rate, reply rate, meetings booked) weekly; lagging indicators (opportunities, pipeline, quota) monthly. Weekly leading-indicator reviews let you coach before a month is lost.
Should BDRs be paid on activity? No. Use an activity floor as a minimum, but tie variable comp to held meetings and sourced pipeline. Paying on activity produces activity theater.
Why is bounce rate a BDR metric? Because high bounce rates from bad data destroy sender reputation, which suppresses replies on your valid contacts too. It corrupts every downstream number, so it belongs on the scorecard.
Where Tomba fits#
Every BDR metric on this page depends on one thing you control before a single email goes out: the quality of your contact data. Inflated bounce rates, low connect rates, and unreliable conversion numbers almost always trace back to bad inputs. Start your reps with verified, enriched contacts using the Tomba Email Finder — find professional emails by domain, name, or company, verify them before they hit a sequence, and keep your deliverability (and your dashboards) honest. Explore Tomba pricing, starting free with 25 searches a month and scaling to a $49/mo Starter plan, and give your BDR metrics a clean foundation to stand on.
Ready to find emails that actually work?
Join 150,000+ professionals who stopped guessing and started sending. Free credits on signup — no credit card required.
Get the Tomba newsletter
Practical outbound tactics and product updates — once every two weeks.
About the author