Contact Rate in Outbound Sales: The 2026 Benchmark Guide
Most teams blame the script when outbound stalls. The data says otherwise: contact rate collapses at the list, not the pitch. Here are the 2026 benchmarks, the math, and the fixes that actually move the number.
TL;DR
- Contact rate in outbound sales = the percentage of targeted prospects you actually reach a human at, divided by everyone you attempted. It sits between "attempted" and "engaged" — and it's the metric most teams silently miscount.
- A healthy 2026 range: 8–15% for cold email, 4–8% for cold calling, 12–25% for multichannel sequences hitting the same person on email + phone + LinkedIn.
- Roughly 60–70% of a low contact rate traces back to data, not copy. Bad addresses, dead numbers, wrong titles, and stale job data kill reach before a single word gets read.
- The fastest lever is not a new script. It's verifying every address before send, sourcing direct dials instead of switchboards, and re-enriching your list every 90 days.
- Track contact rate per channel and per list source — a blended number hides which supplier is selling you decay.
What is contact rate in outbound sales?#
Contact rate is the share of your outbound attempts that result in an actual human interaction — a reply, a live conversation, a "no thanks," a booked meeting, even a hostile hang-up. The person on the other end registered your existence and responded.
Think of it like knocking on doors in a neighborhood. Your delivery rate is how many doors you got to without tripping on the sidewalk. Your contact rate is how many doors someone actually opened. You can knock beautifully on 500 empty houses and score a 0% contact rate with a flawless script.
That distinction matters because the two failure modes need opposite fixes. If nobody answers, you have a list problem. If people answer and hang up, you have a message problem. Teams that don't separate the two spend six months A/B testing subject lines against a database that was accurate in 2023.
Contact rate is also the metric that quietly caps everything downstream. Pipeline is a chain: attempted → delivered → contacted → engaged → qualified → booked. Doubling contact rate doubles the pool that your (unchanged) close rate operates on. Improving close rate does nothing for the 88% you never reached.
How do you calculate contact rate correctly?#
The formula is simple. The definitions are where teams cheat themselves.
Contact Rate = (Unique prospects who responded / Unique prospects attempted) × 100Four rules make the number honest:
- Count people, not touches. If you emailed one VP four times and she replied once, that's 1 contact out of 1 attempt — not 1 out of 4. Sequence-level math inflates your denominator and makes a healthy list look sick.
- Bounces stay in the denominator. This is the big one. Most CRM dashboards quietly exclude hard bounces from "attempted," which means a list that's 30% garbage reports the same contact rate as a clean one. Keep them in. The pain is the point.
- A response is any human signal. Auto-replies, out-of-office, and "unsubscribe" all count as contact. They prove a real person is behind the address. Negative contact is still contact — and a rising unsubscribe rate with a rising contact rate means your data got better and your targeting got worse.
- Segment by channel before you blend. A 6% blended rate could be 14% email and 2% phone, or 3% and 9%. Those are completely different diagnoses.
Here's a worked example. You load 1,000 prospects. 120 hard bounce. 880 deliver. 71 humans respond in any form.
- Honest contact rate: 71 / 1,000 = 7.1%
- Flattering contact rate (bounces excluded): 71 / 880 = 8.1%
That 1-point gap looks trivial. At 40,000 attempts a quarter it's 400 conversations you told your board you had.
What is a good contact rate in 2026?#
There's no universal target — a 30-person healthtech list and a 30,000-person SMB list live in different physics. But these ranges hold up across mid-market B2B outbound teams running modern, permissioned data:
| Channel | Weak | Acceptable | Strong | Primary constraint |
|---|---|---|---|---|
| Cold email (single-channel) | < 4% | 8–12% | 15%+ | Address accuracy + deliverability |
| Cold calling (direct dial) | < 2% | 4–6% | 8%+ | Dial accuracy + call window |
| Cold calling (switchboard only) | < 1% | 1–2% | 3%+ | Gatekeeper penetration |
| LinkedIn outreach | < 5% | 10–15% | 20%+ | Connection acceptance + relevance |
| Multichannel (email + phone + LI) | < 8% | 12–18% | 25%+ | Sequencing + list freshness |
| Warm/inbound-sourced follow-up | < 15% | 25–35% | 45%+ | Speed to lead |
Two caveats before you screenshot this table.
Seniority moves everything. A C-suite list at a 5,000-person enterprise will run 3–5x lower contact rate than a manager-level list at a 50-person startup. Don't benchmark a CRO campaign against an SDR-to-ops-manager campaign.
Deliverability is a hard ceiling. In 2026, Google and Microsoft's bulk-sender enforcement means a domain with a bad reputation simply won't reach the inbox, no matter how accurate the address is. If your email deliverability is compromised, your contact rate ceiling is set before you write a word. HubSpot's sales research has tracked this same split for years: reach problems and persuasion problems are separate diseases with separate cures.
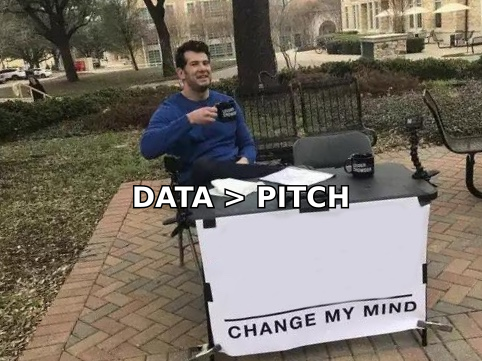
Sorry — I'll say it plainly: your copy is probably fine. Your list probably isn't.
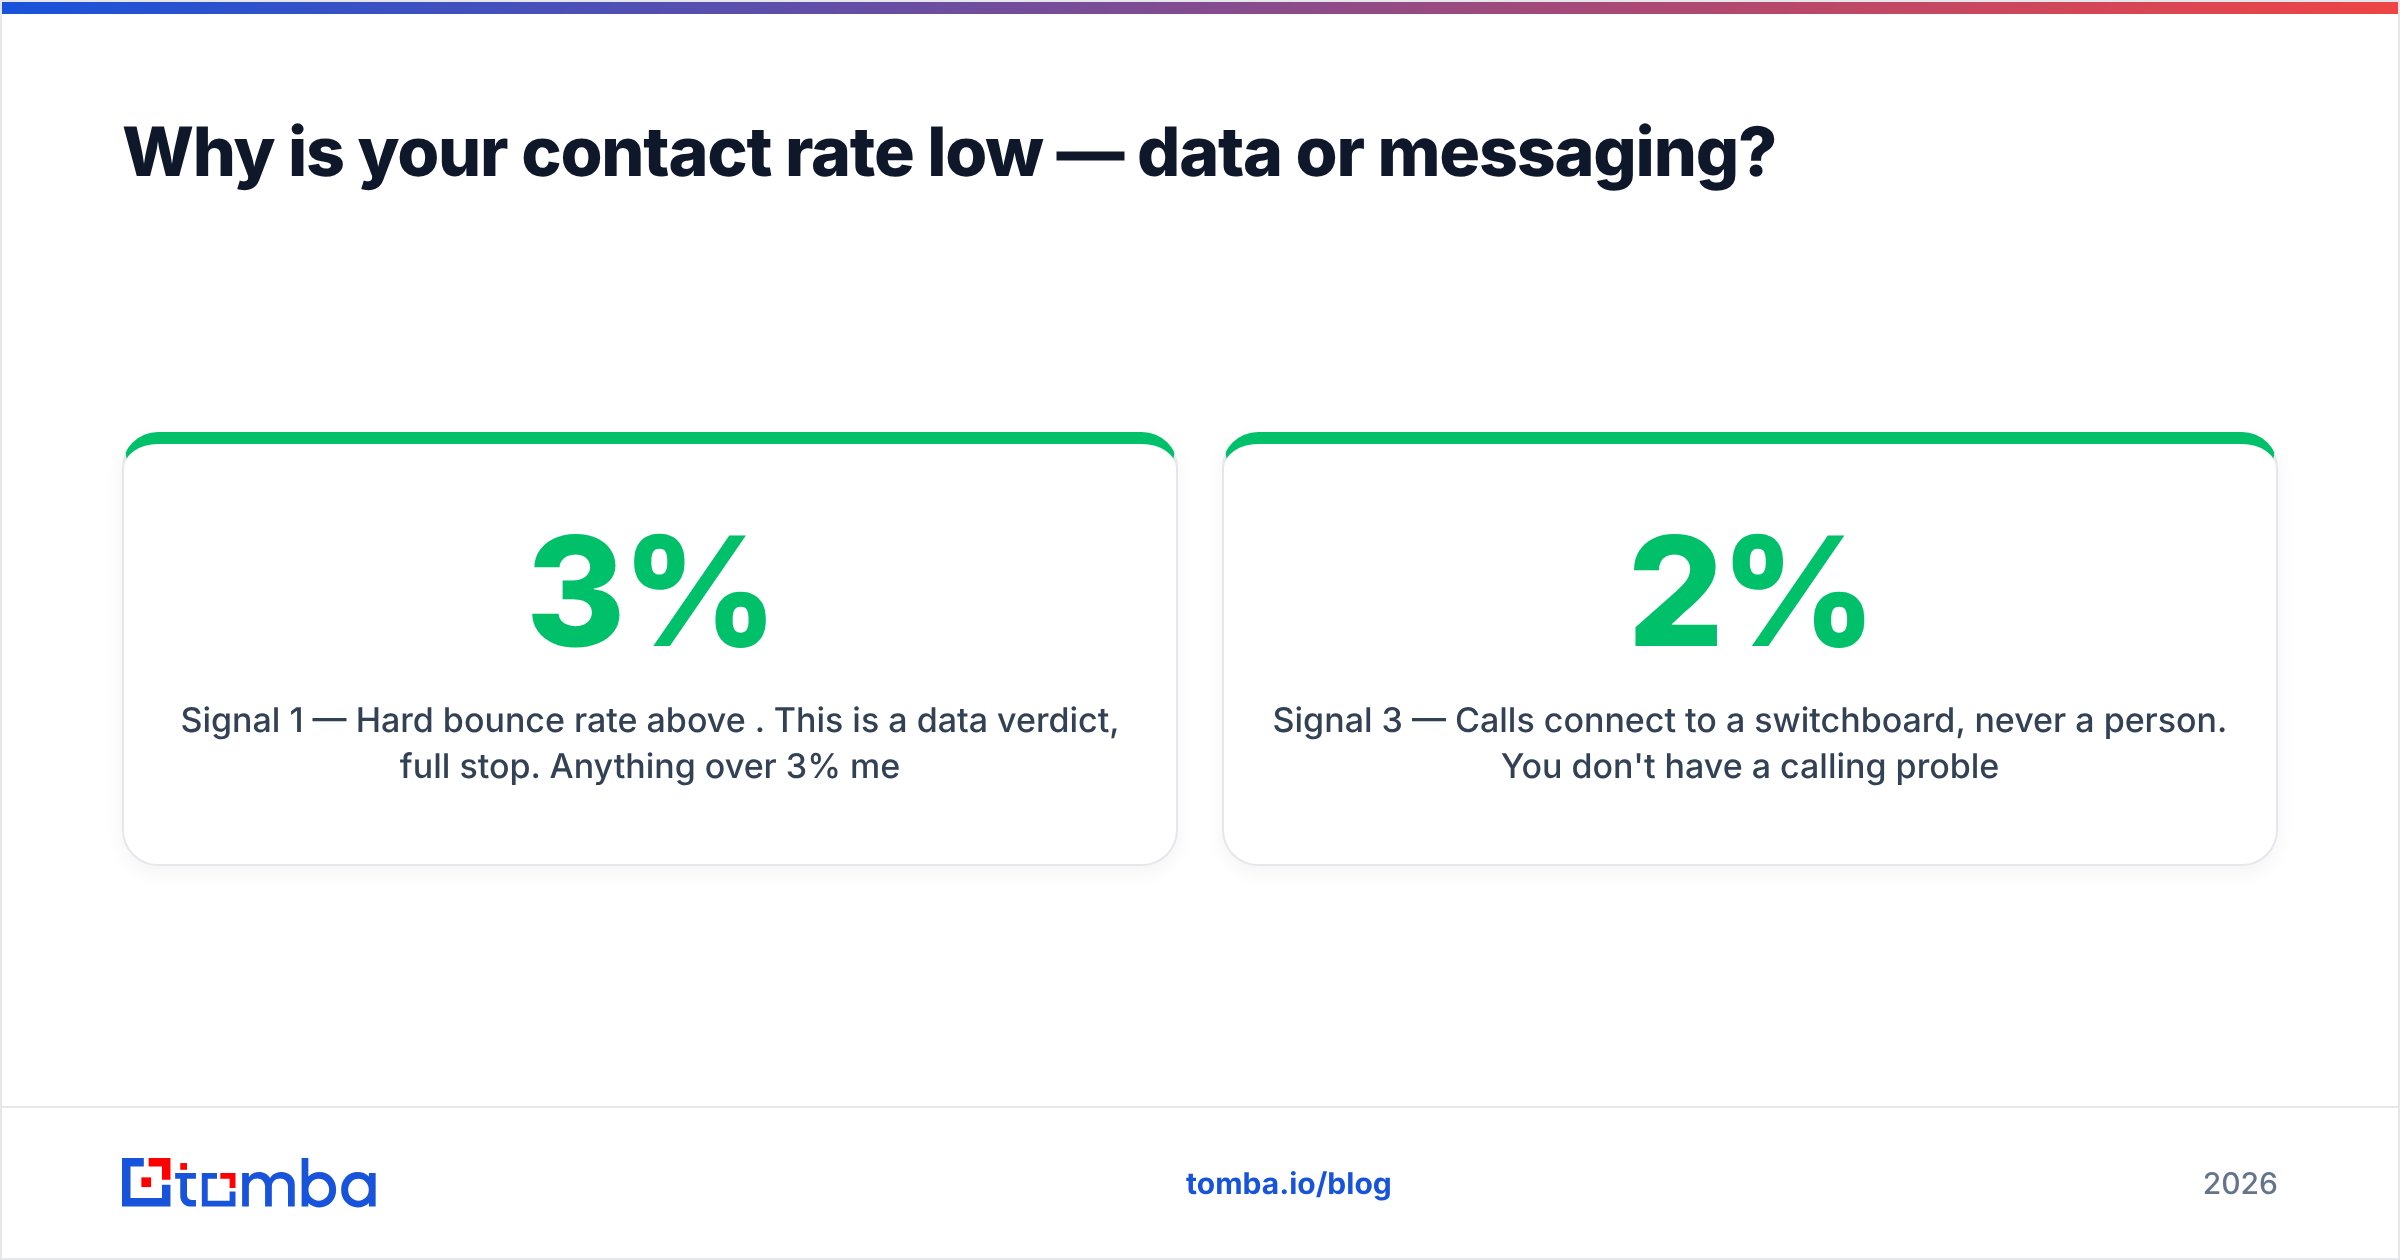
Why is your contact rate low — data or messaging?#
Run this diagnostic before you touch a single sentence of your sequence.
Signal 1 — Hard bounce rate above 3%. This is a data verdict, full stop. Anything over 3% means your source is selling decay. Above 8% and you're actively damaging sender reputation, which drags down the contact rate of every valid address in the same campaign. Fix: run the list through an email verifier before it ever enters your sending tool.
Signal 2 — High delivery, near-zero response. Emails land, nobody says a word, no bounces. That's the classic catch-all-domain trap: the server accepts everything and routes most of it to a black hole. Catch-all addresses inflate your "delivered" number while contributing nothing. A dedicated catch-all verifier separates the real mailboxes from the accept-all façade.
Signal 3 — Calls connect to a switchboard, never a person. You don't have a calling problem, you have a direct-dial problem. Company mainlines have collapsed as a contact channel post-remote-work. If your dialer list is full of +1-800 numbers, your contact rate is capped around 1–2% regardless of talent. Sourcing mobile and direct lines via a phone finder is usually worth 3–4x more than any script change.
Signal 4 — Replies say "I don't handle this." Now, finally, you have a targeting problem. The data reached a human; the human was wrong. Fix the ICP filter and title mapping, not the deliverability stack.
Signal 5 — Replies say "not interested" fast. Congratulations. Your data is working. This is where copy testing starts paying off.
Notice the order. Four out of five low-contact-rate diagnoses are data. Only the fifth is a writing problem — and you can't even see it until the first four are cleared.
How does contact rate compare to the other outbound metrics?#
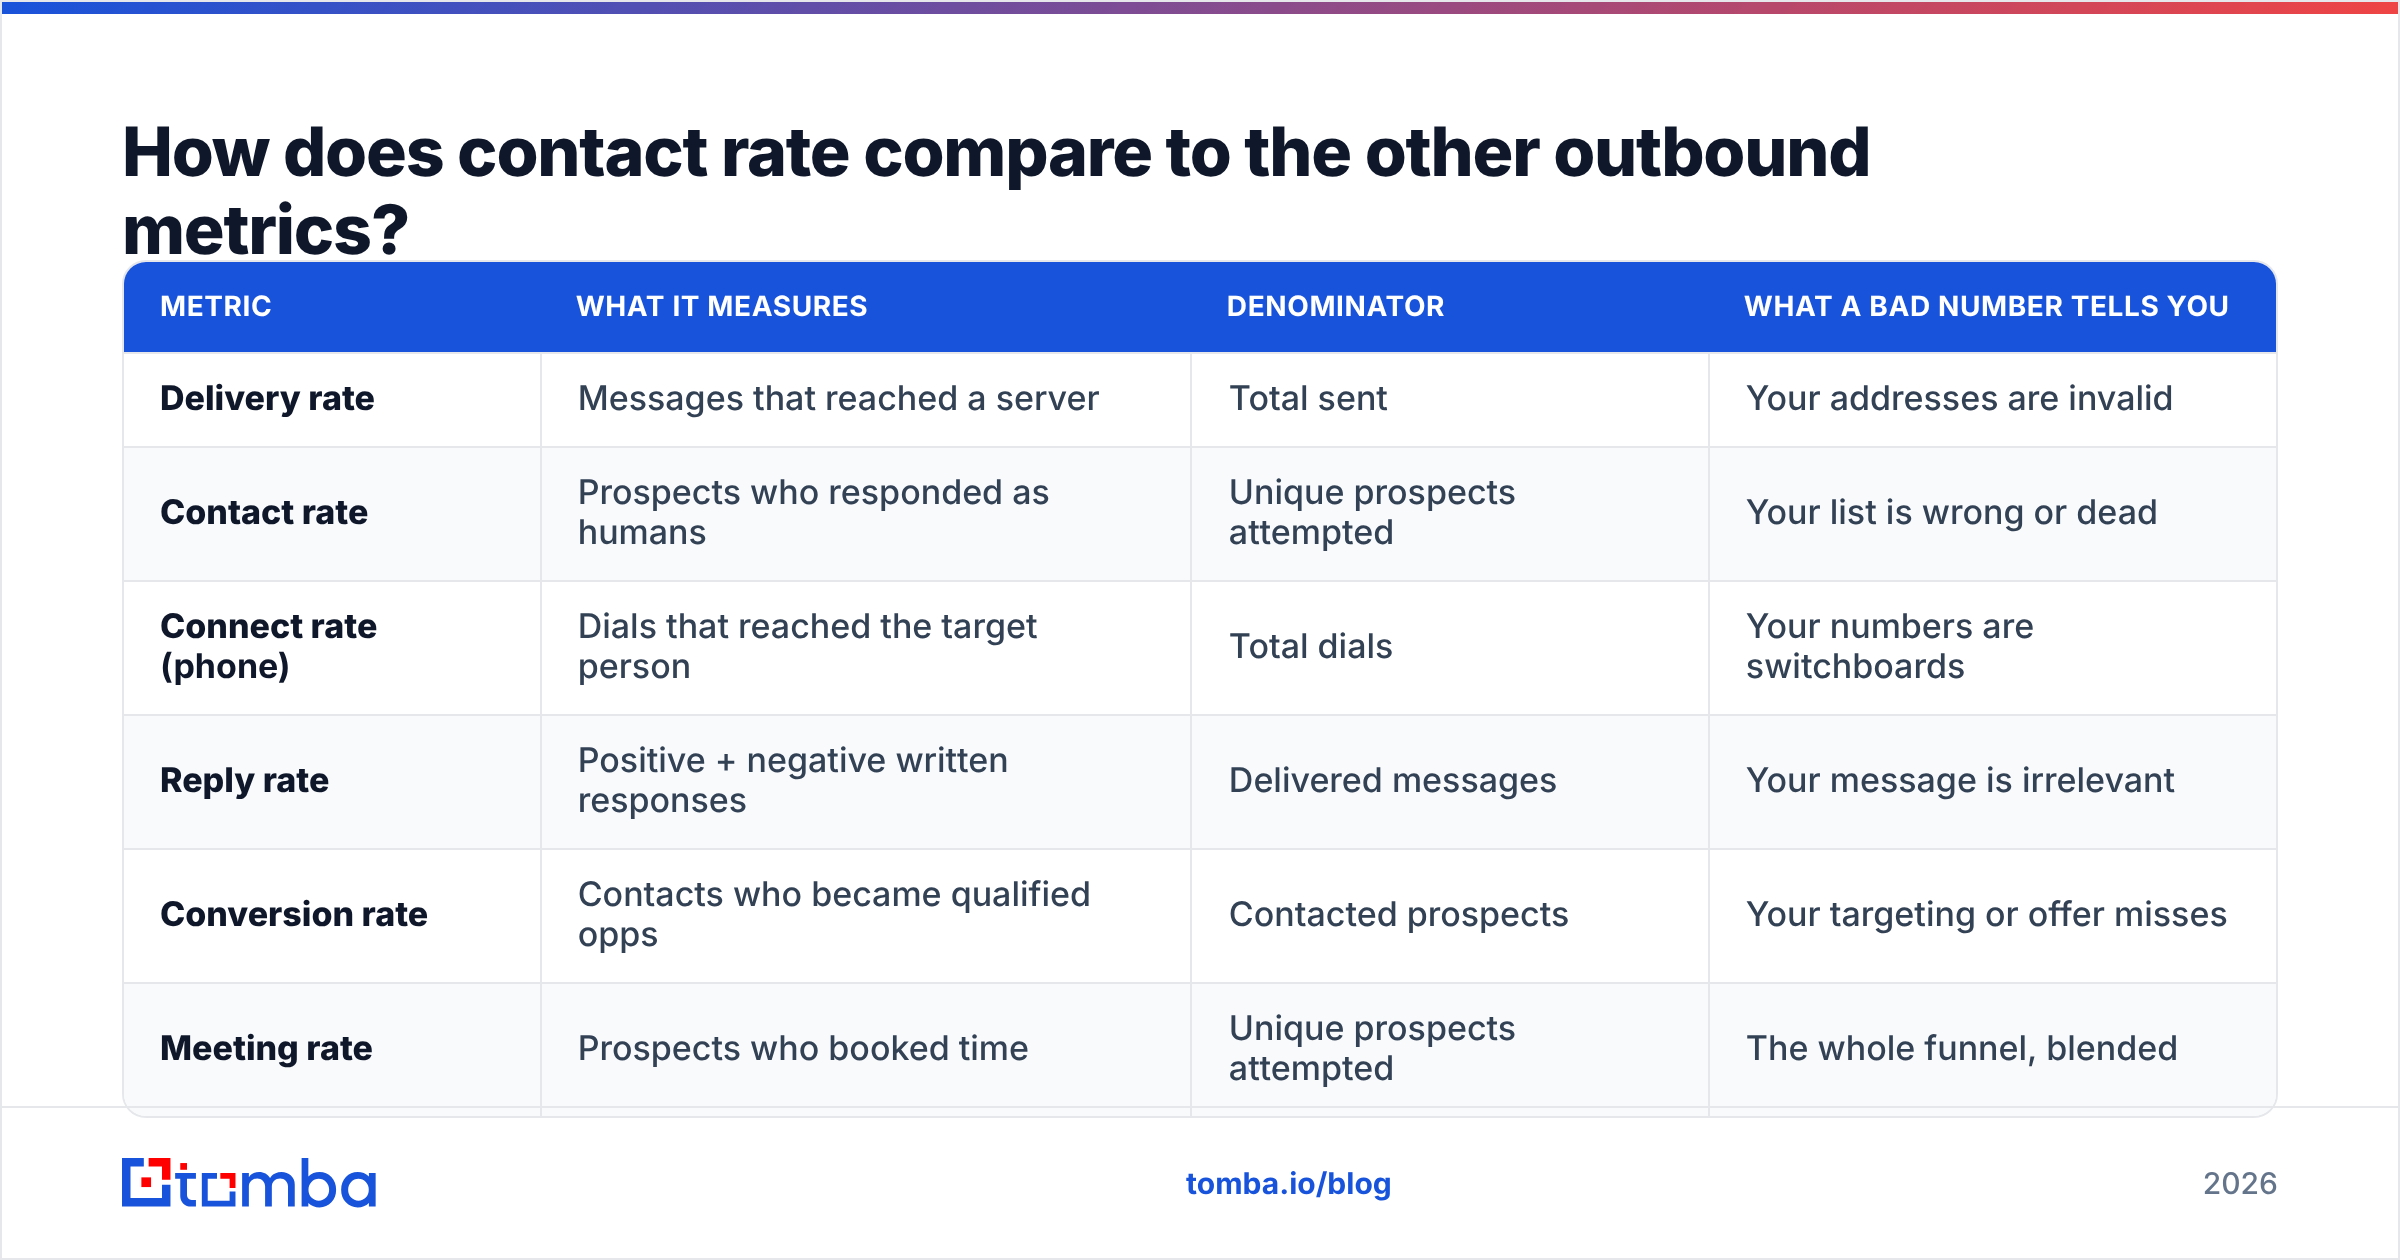
Teams conflate contact rate with connect rate, reply rate, and conversion rate, then argue about numbers that measure different things. Here's the separation:
| Metric | What it measures | Denominator | What a bad number tells you |
|---|---|---|---|
| Delivery rate | Messages that reached a server | Total sent | Your addresses are invalid |
| Contact rate | Prospects who responded as humans | Unique prospects attempted | Your list is wrong or dead |
| Connect rate (phone) | Dials that reached the target person | Total dials | Your numbers are switchboards |
| Reply rate | Positive + negative written responses | Delivered messages | Your message is irrelevant |
| Conversion rate | Contacts who became qualified opps | Contacted prospects | Your targeting or offer misses |
| Meeting rate | Prospects who booked time | Unique prospects attempted | The whole funnel, blended |
The useful move is to compute contact rate and response rate side by side. A high contact rate with a low conversion rate means you're reaching the wrong humans efficiently. A low contact rate with a high conversion rate means the few people you do reach love you — which is the best possible problem, because it's purely a scaling and data problem, and data is buyable.
How do you increase contact rate in outbound sales?#
Six levers, ranked by return per hour of effort.
Verify before you send, not after. Every address goes through verification at import, not at bounce time. This single step typically moves contact rate 2–4 points because it protects the deliverability of the whole domain, not just the individual sends. Bounces are contagious.
Source direct dials, not company numbers. Switching a call list from switchboard to mobile/direct is usually the single largest contact-rate jump available to a phone-heavy team. Nothing about the script changes.
Re-enrich on a 90-day clock. B2B contact data decays at roughly 2–3% per month — people change jobs, titles, and domains. A list built in January is meaningfully wrong by April. Scheduled data enrichment treats your database as a perishable asset, which is what it is. Gartner's go-to-market research has been blunt about this for years: data decay, not seller effort, is the dominant cause of coverage loss.
Go multichannel on the same person, not more people. Three touches across email, phone, and LinkedIn on 300 prospects beats one email to 900. Contact rate is a function of surface area per person, and each channel has an independent failure mode.
Fix your sending infrastructure before you scale volume. SPF, DKIM, DMARC, a warmed domain, and sane daily volume. Reaching more people with a burned domain is arithmetic that only goes one way.
Kill the addresses you're guessing. Permutated addresses (
first.last@,flast@,f.last@) inflate volume and torch reputation. If you can't verify it, don't send to it. An 800-address verified list outperforms a 3,000-address guessed one on every metric that matters — including total meetings, not just percentages.

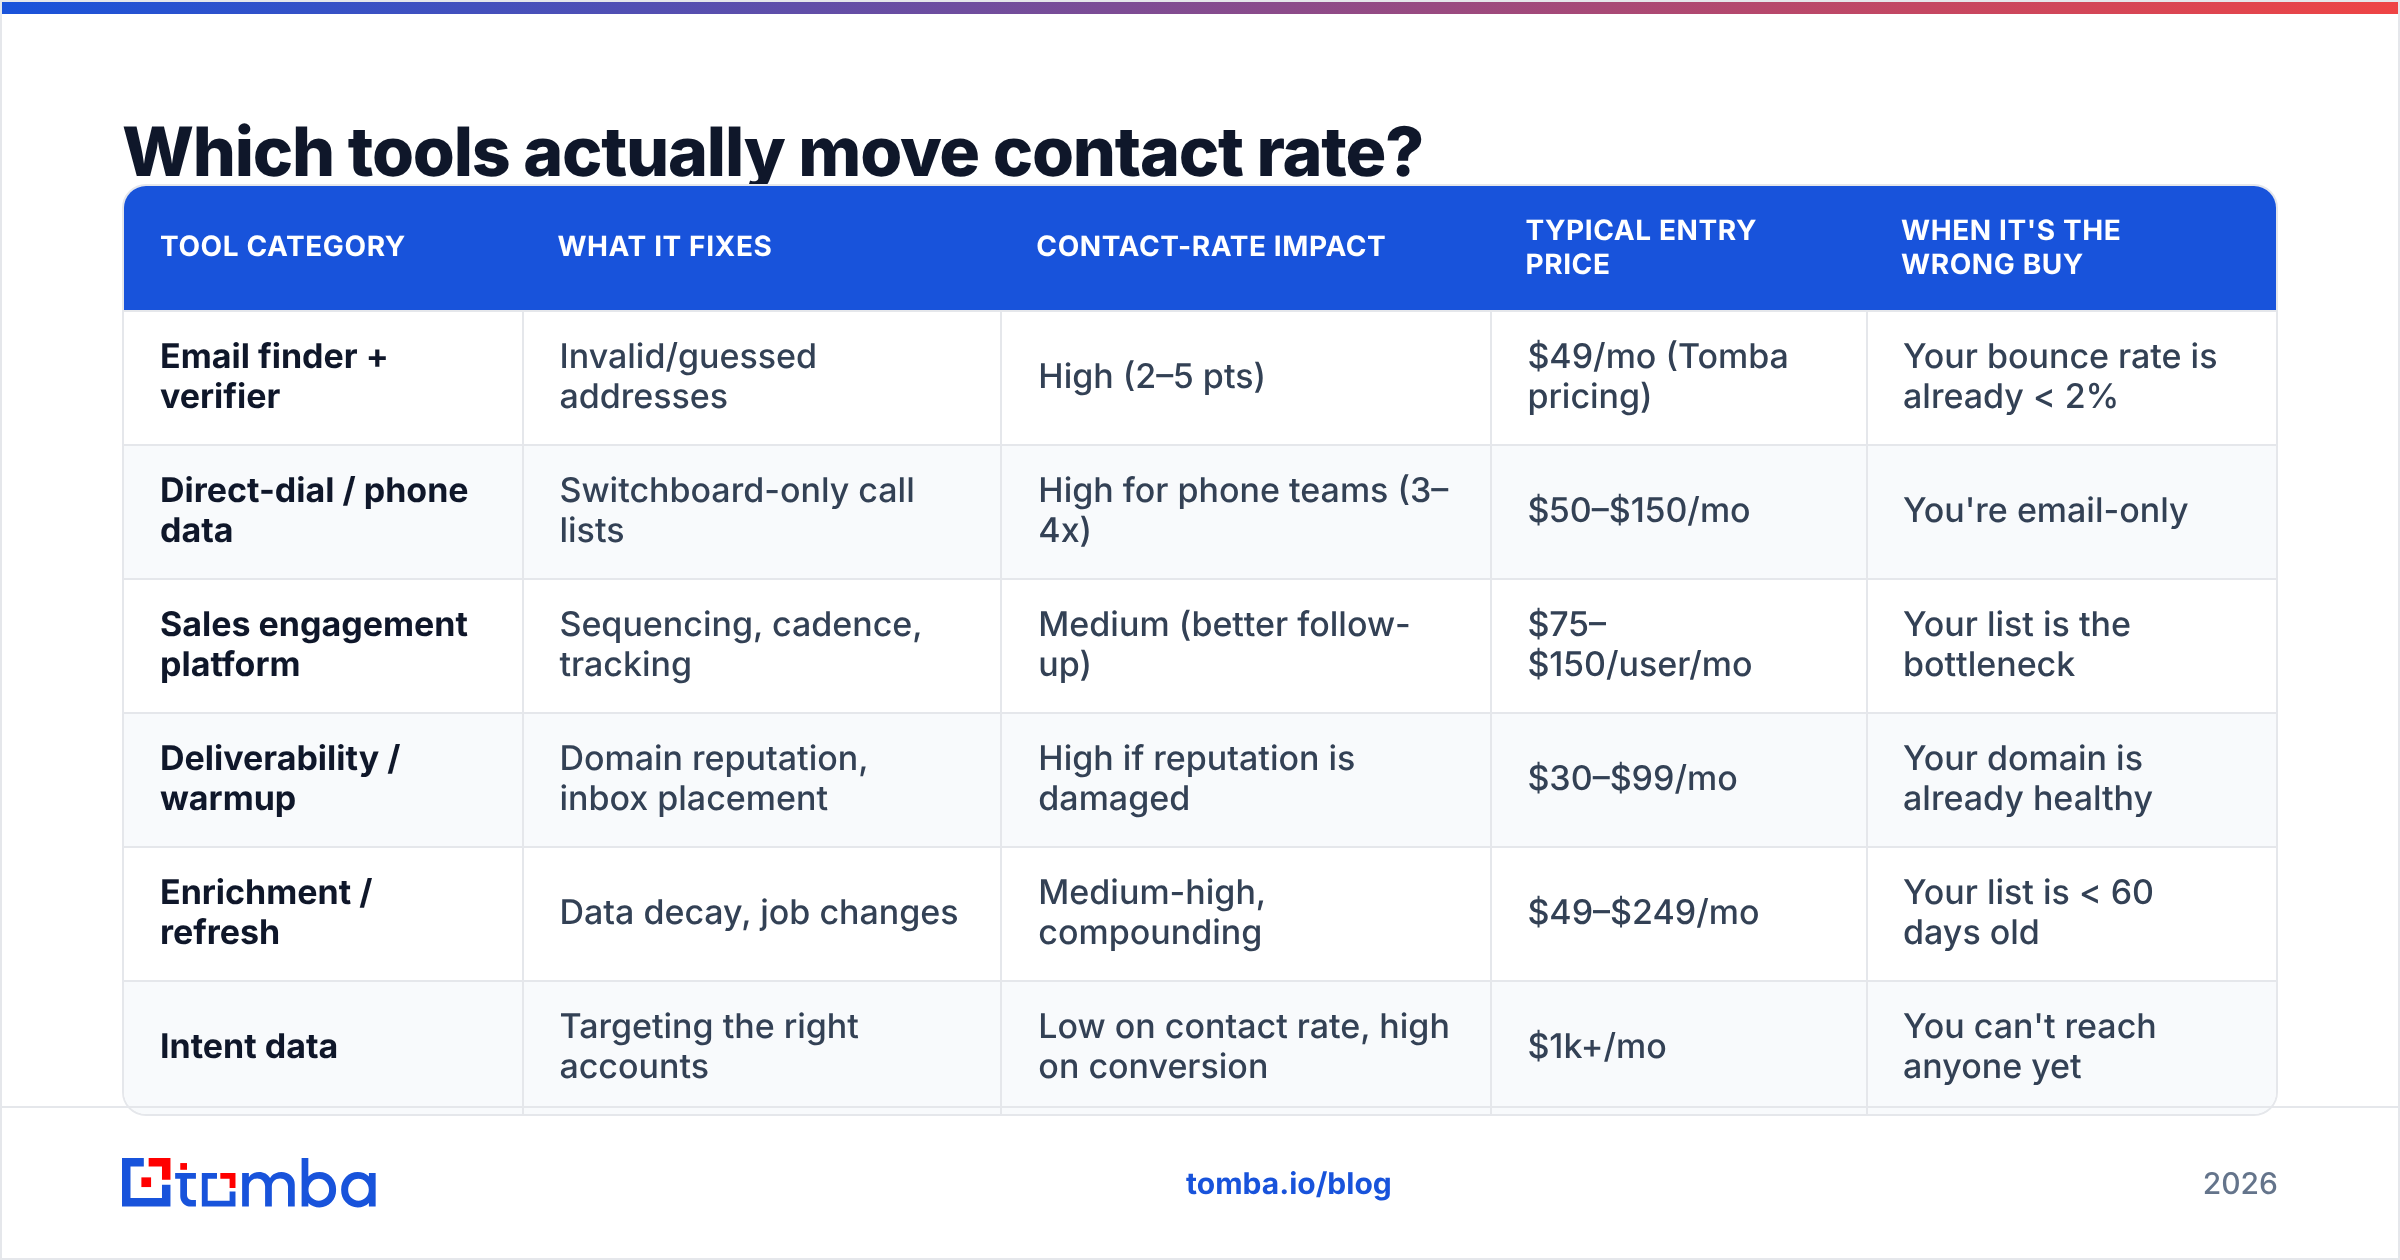
Which tools actually move contact rate?#
Different tools attack different parts of the chain. Buying the wrong category is how teams spend $30k and move the number by nothing.
| Tool category | What it fixes | Contact-rate impact | Typical entry price | When it's the wrong buy |
|---|---|---|---|---|
| Email finder + verifier | Invalid/guessed addresses | High (2–5 pts) | $49/mo (Tomba pricing) | Your bounce rate is already < 2% |
| Direct-dial / phone data | Switchboard-only call lists | High for phone teams (3–4x) | $50–$150/mo | You're email-only |
| Sales engagement platform | Sequencing, cadence, tracking | Medium (better follow-up) | $75–$150/user/mo | Your list is the bottleneck |
| Deliverability / warmup | Domain reputation, inbox placement | High if reputation is damaged | $30–$99/mo | Your domain is already healthy |
| Enrichment / refresh | Data decay, job changes | Medium-high, compounding | $49–$249/mo | Your list is < 60 days old |
| Intent data | Targeting the right accounts | Low on contact rate, high on conversion | $1k+/mo | You can't reach anyone yet |
The pattern: the top three rows fix reach, the bottom row fixes relevance. Intent data is genuinely valuable — but it improves who you want to talk to, not your ability to actually get them on the phone. Buying intent before fixing reach is buying a better map for a car with no wheels. Cross-check any vendor's real-world accuracy claims on G2 rather than their own landing page; the gap between marketed and observed accuracy is where most contact-rate disappointment lives.
Tools like BookYourData are a reasonable fit when you want a pre-built, human-verified list handed to you rather than assembling one. Tools like Tomba fit better when you're finding contacts continuously from domains, LinkedIn profiles, or an existing account list and need verification in the same pass. Both approaches beat scraping and guessing.
How do you track contact rate without lying to yourself?#
Build one table. Update it weekly. Refuse to blend.
- Rows: list source (vendor A, vendor B, self-sourced, inbound).
- Columns: attempted, hard bounces, delivered, human responses, contact rate, cost per contact.
- Rule: any source below your channel benchmark for two consecutive weeks gets cut, not "optimized."
Cost per contact is the number that ends arguments. A $0.10/record list with a 4% contact rate costs $2.50 per human reached. A $0.40/record list with a 14% contact rate costs $2.86 — nearly identical, except the second one didn't burn your sending domain to get there. Cheap data isn't cheap; it's financed, and the interest is paid in deliverability.
One last discipline: log why a contact failed. Bounce, no response, wrong person, gatekeeper, unsubscribed. Five buckets, one dropdown. After 500 attempts you'll know exactly which of the five diagnoses above is yours, and you'll stop rewriting subject lines to solve a phone-number problem.
Where to start this week#
Pick your worst-performing sequence. Export the list. Run it through verification and check the bounce rate — if it's over 3%, you found your answer in ten minutes, and no amount of copywriting was ever going to fix it. Then re-source the invalid ones properly instead of guessing them, and re-run the same sequence with the same words. If contact rate jumps, you've just proven where the leverage lives.
That's the whole loop, and it's cheap to test. Tomba's Email Finder gives you 25 free searches a month to run exactly this diagnostic — find and verify addresses by domain, name, or company, with the verifier built into the same call so nothing unverified ever reaches your sending tool. Paid plans start at $49/mo when you're ready to run it across the whole list. Fix the reach first. The pitch can wait its turn.
Related guides#
Ready to find emails that actually work?
Join 150,000+ professionals who stopped guessing and started sending. Free credits on signup — no credit card required.
Get the Tomba newsletter
Practical outbound tactics and product updates — once every two weeks.
About the author