Cold Email Metrics in 2026: The Only Numbers That Matter
Open rates went blind, bounce rates went political, and reply rate got harder to fake. Here's the metric stack that actually predicts pipeline in 2026 — and the vanity numbers quietly wasting your quarter.
TL;DR
- Open rate is no longer a measurement — it's noise. Apple Mail Privacy Protection, Gmail image proxying, and security scanners inflate it by 15–40% depending on your list. Stop reporting it as a primary KPI.
- The four metrics that actually correlate with pipeline: bounce rate, reply rate, positive reply rate, and meetings booked per 100 contacted.
- Bounce rate above 3% is not a data problem, it's a deliverability emergency. Google and Yahoo's bulk sender rules made spam complaints (>0.3%) an existential threat, not a nuisance.
- Benchmarks are directional, not diagnostic. A 2% reply rate is excellent for a $250k ACV enterprise motion and terrible for a $99/mo SaaS tool.
- Measure at the sequence level, not the email level. Step 1 opens tell you nothing; step-3-to-reply conversion tells you whether the sequence has legs.
Why do most cold email metrics lie to you?#
Because they were designed for marketing email, and cold outbound is not marketing email.
Think of it like judging a restaurant by how many people walked past the window. That number moves with the weather, the sidewalk construction, and whether there's a bus stop out front. It has almost nothing to do with whether the food is good. Open rate is the window count.
Three things broke open-rate tracking, and none of them are reversing:
Apple Mail Privacy Protection (MPP). Since iOS 15, Apple Mail pre-fetches tracking pixels on Apple's servers whether or not the human opens the message. If a meaningful share of your prospects read mail in Apple Mail — and in most B2B lists it's 30–50% — those contacts register as "opened" on delivery.
Gmail image proxying. Google caches images through its own proxy. You get an open event, but you lose location and device signal, and repeated cache hits can fire multiple times.
Security appliances. Proofpoint, Mimecast, Barracuda, and similar gateways click every link and load every image in an inbound message to sandbox it. Enterprise prospects — exactly the ones you want — are the most likely to sit behind one. Your "opens" and even your "clicks" from those domains are robots.
The net effect: open rate went up while replies went flat. Teams that didn't notice spent 2024 and 2025 optimizing subject lines against a metric that had stopped measuring subject lines.
Which cold email metrics actually matter in 2026?#
Here's the working hierarchy. Each tier feeds the one below it, and a problem at the top makes every number underneath it meaningless.
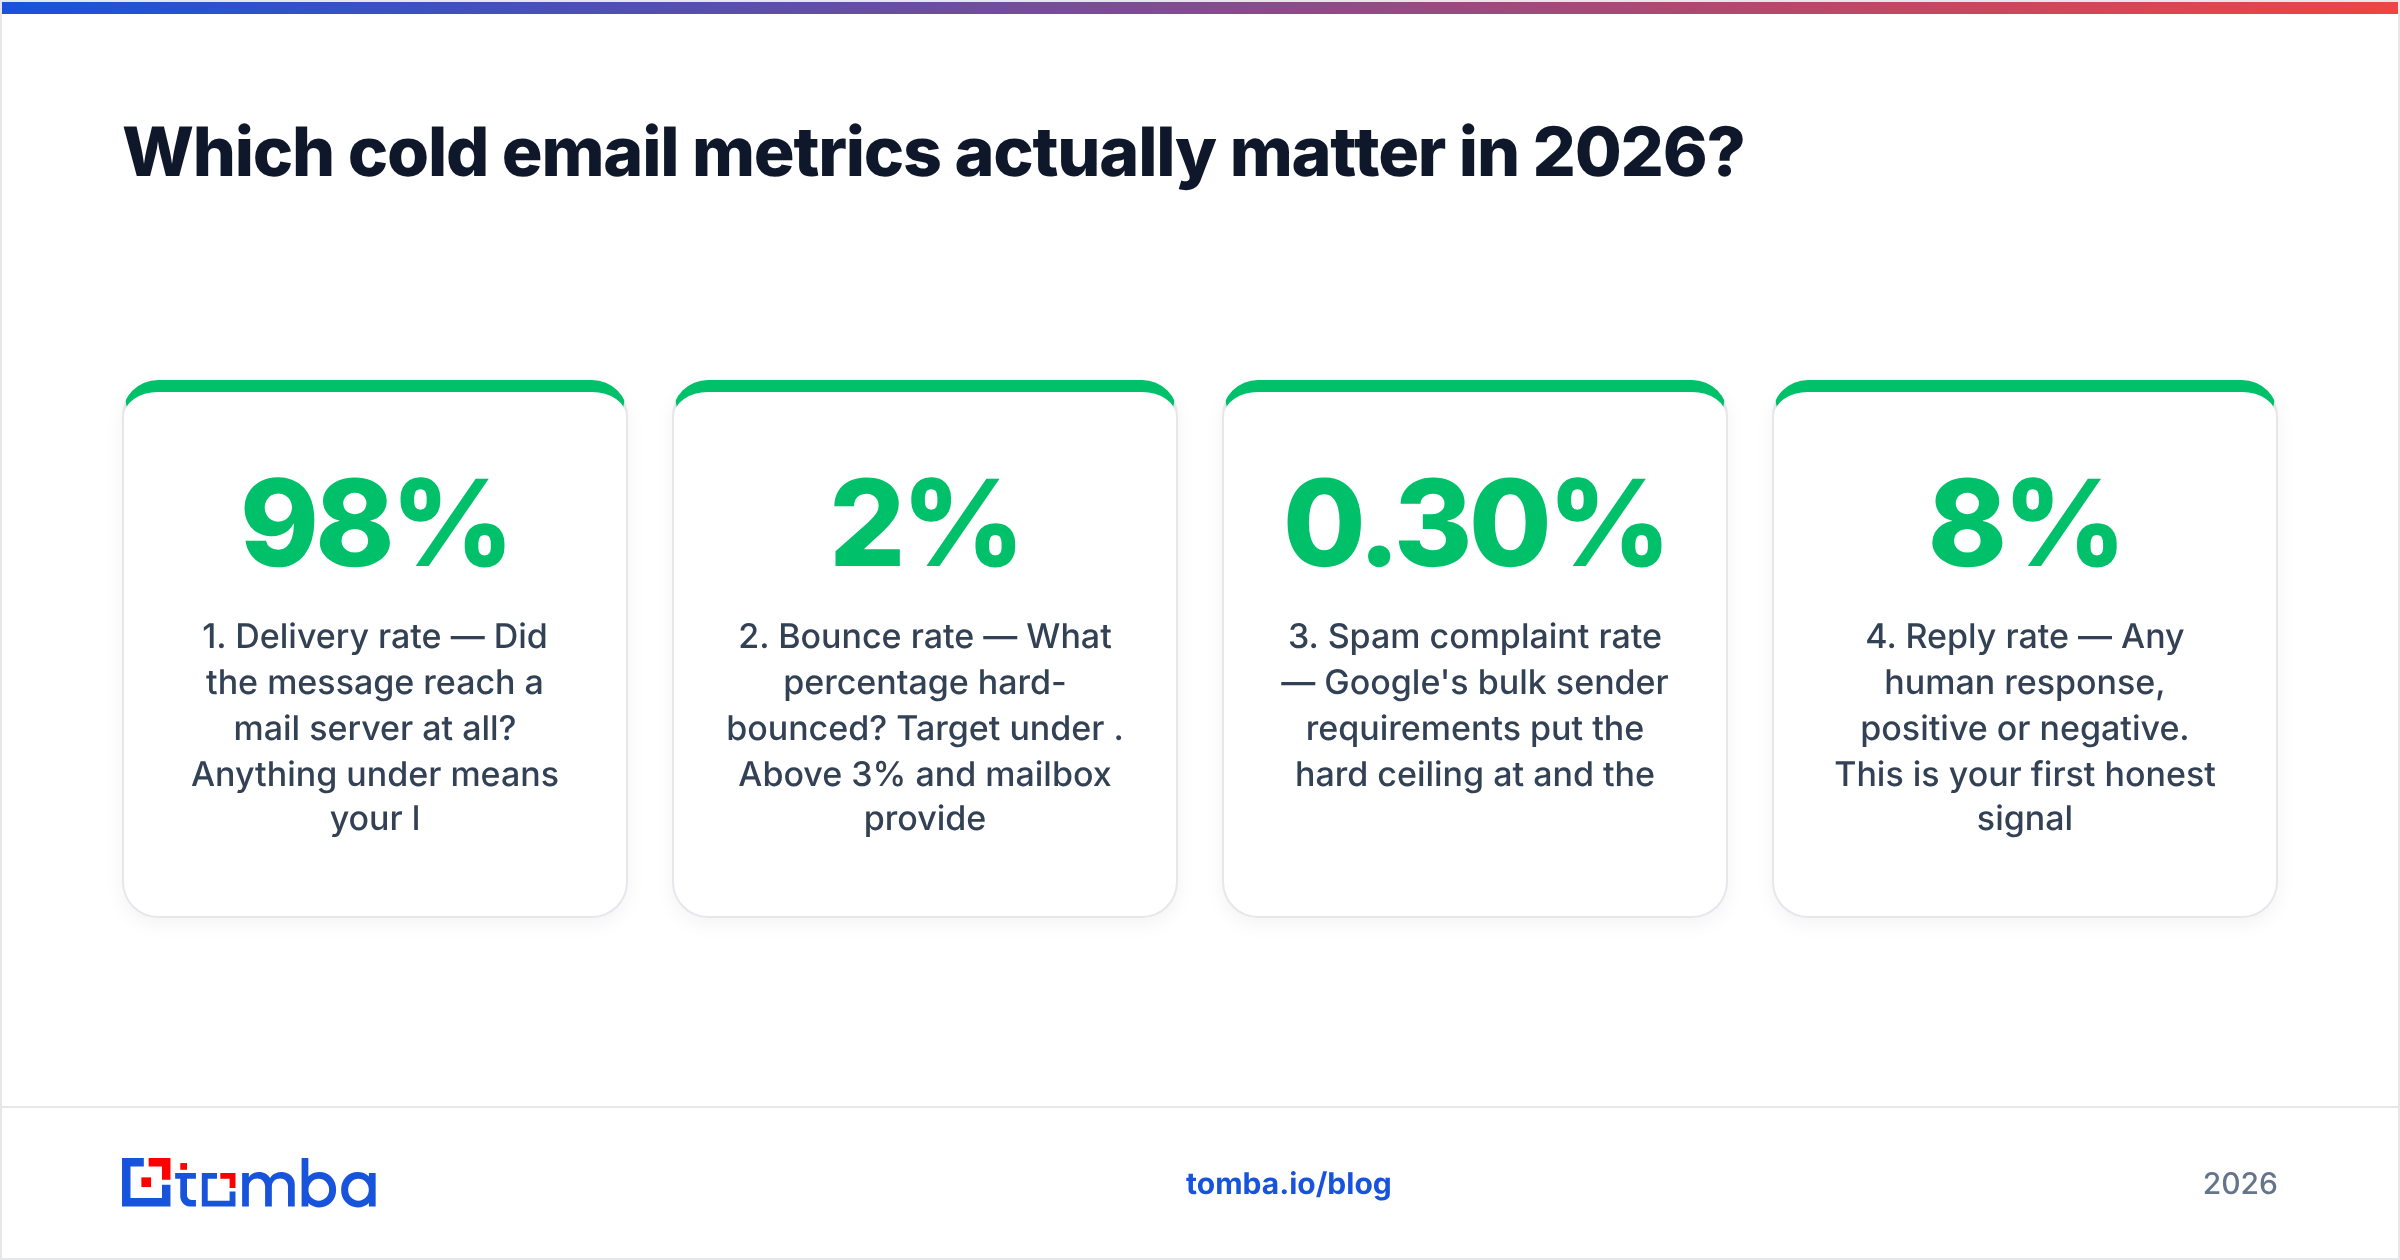
- Delivery rate — Did the message reach a mail server at all? Anything under 98% means your list has garbage in it or your domain is in trouble. This is the foundation; nothing below matters if it's cracked.
- Bounce rate — What percentage hard-bounced? Target under 2%. Above 3% and mailbox providers start treating you as a list-buyer. Under 1% if you're doing verification properly.
- Spam complaint rate — Google's bulk sender requirements put the hard ceiling at 0.30% and the "stay well below this" target at 0.10%. This is the metric that can kill a domain in a week.
- Reply rate — Any human response, positive or negative. This is your first honest signal that a person read the thing and reacted. Benchmark: 3–8% for a well-targeted sequence.
- Positive reply rate — Replies that express interest, ask a question, or request a call. Typically 20–35% of total replies. This is the number to put on the board.
- Meetings booked per 100 contacted — The only metric your CRO cares about. Everything above is instrumentation; this is the outcome.
Notice what isn't on the list. Open rate. Click rate (unless you're running a link-heavy motion and have filtered out gateway clicks by timestamp clustering). Unsubscribe rate (useful, but a lagging indicator of a targeting problem you should have caught upstream).
What do good cold email benchmarks look like by motion?#
The single biggest mistake in metric reporting is comparing a 500-person enterprise list against a 50,000-person SMB blast and concluding the enterprise sequence "underperformed."
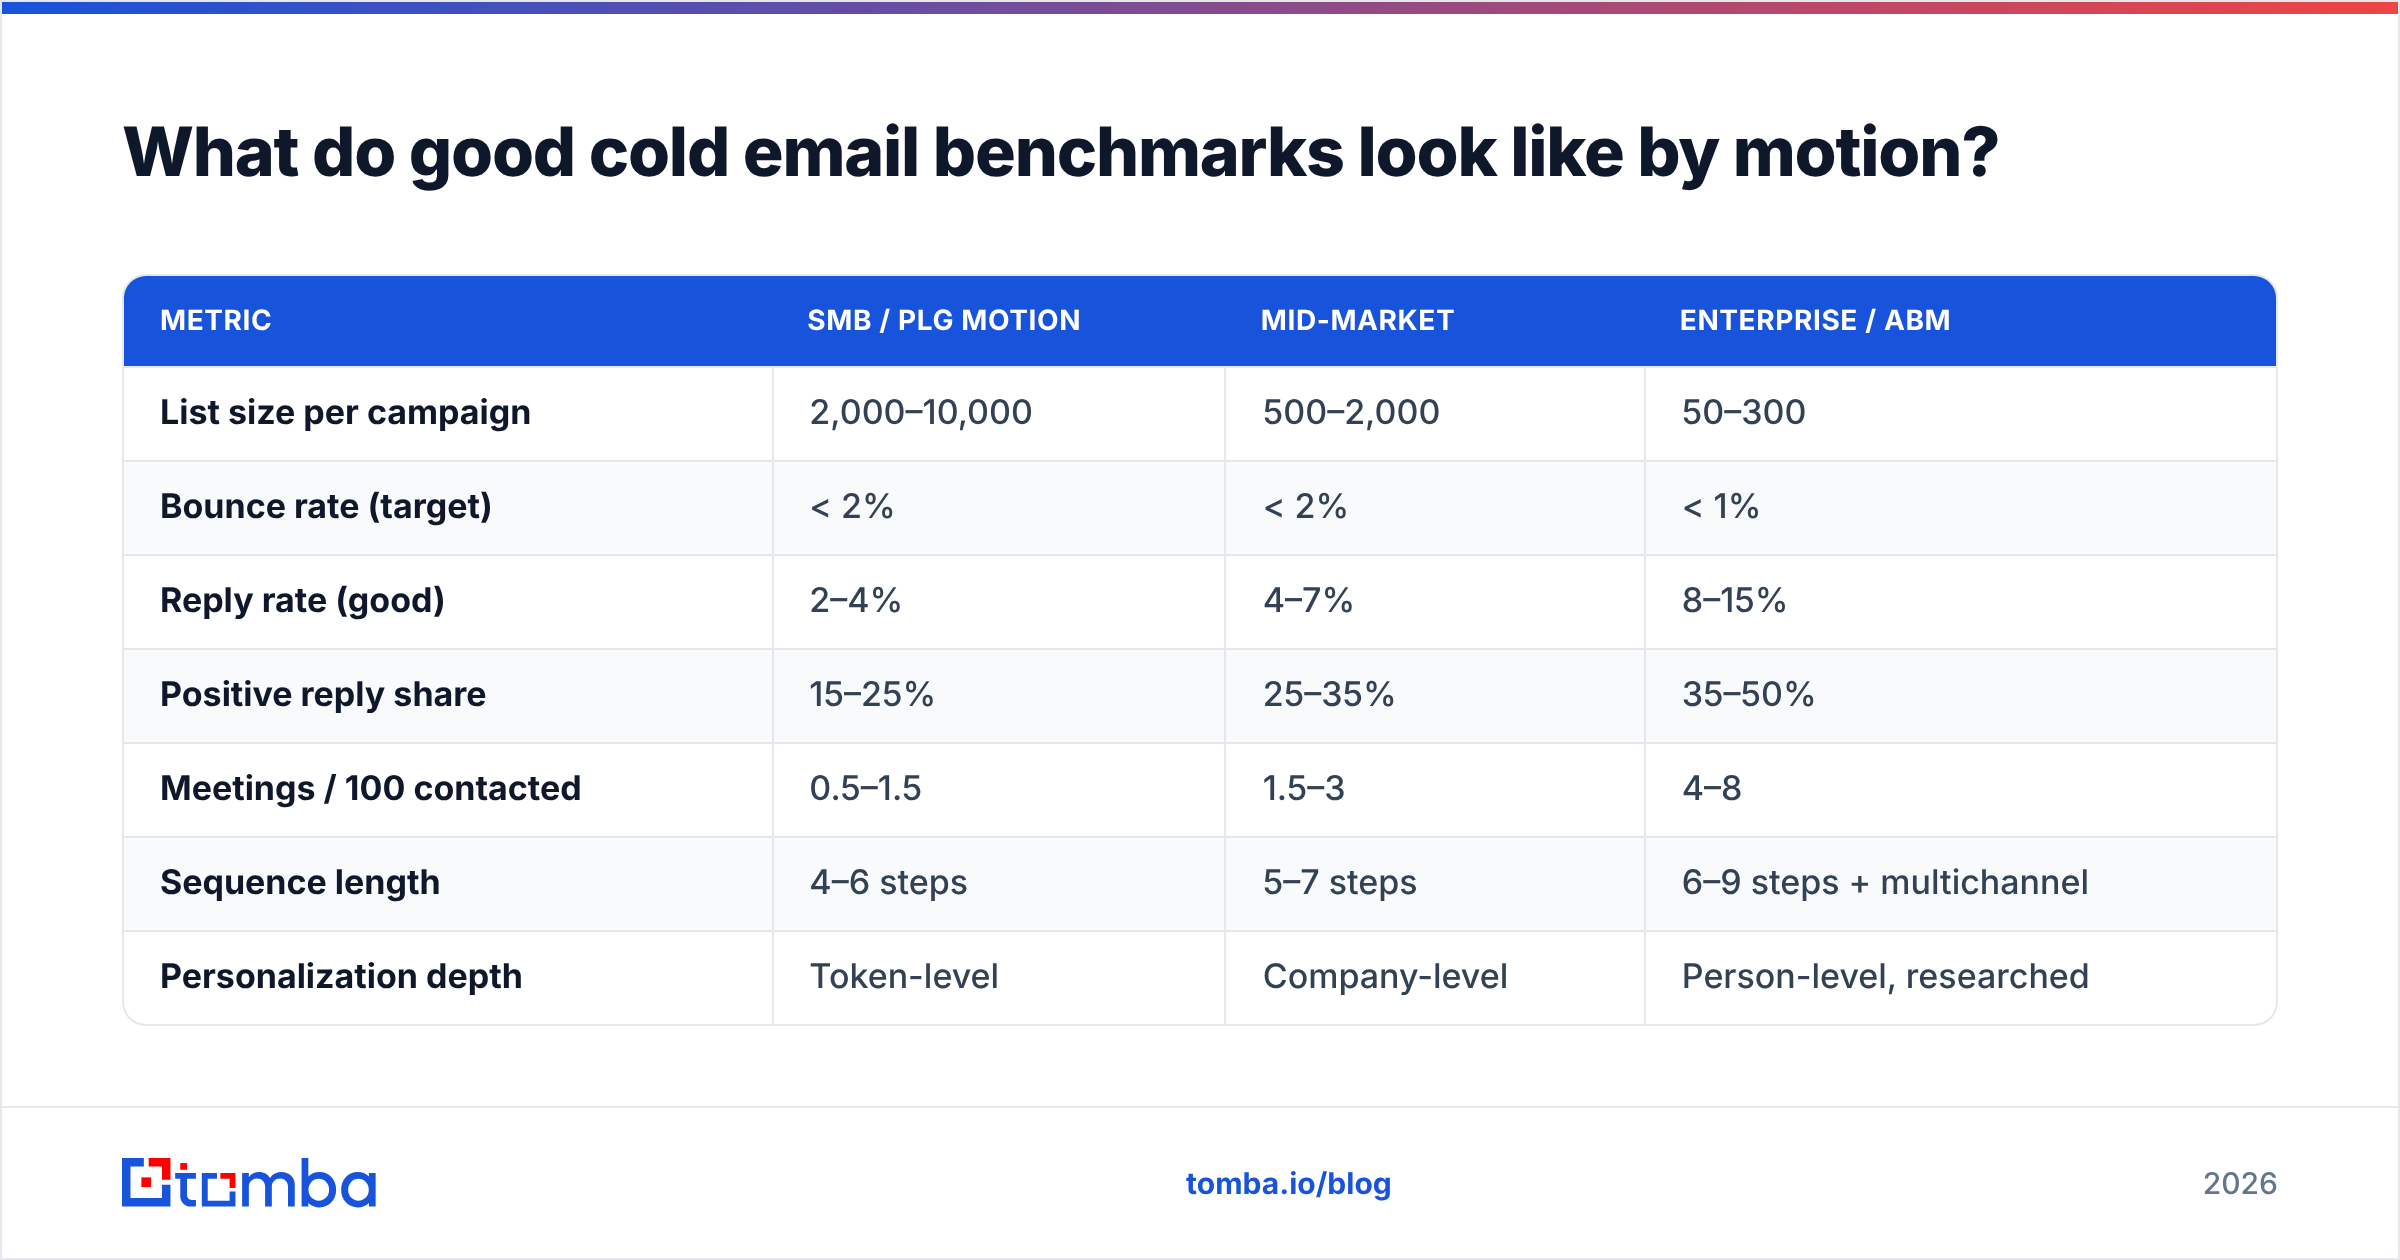
| Metric | SMB / PLG motion | Mid-market | Enterprise / ABM |
|---|---|---|---|
| List size per campaign | 2,000–10,000 | 500–2,000 | 50–300 |
| Bounce rate (target) | < 2% | < 2% | < 1% |
| Reply rate (good) | 2–4% | 4–7% | 8–15% |
| Positive reply share | 15–25% | 25–35% | 35–50% |
| Meetings / 100 contacted | 0.5–1.5 | 1.5–3 | 4–8 |
| Sequence length | 4–6 steps | 5–7 steps | 6–9 steps + multichannel |
| Personalization depth | Token-level | Company-level | Person-level, researched |
| Acceptable CAC per meeting | $40–90 | $90–250 | $250–900 |
Read that table sideways, not down. An enterprise rep sending 80 emails a month and booking 5 meetings is outperforming an SMB rep sending 8,000 and booking 60 — on cost, on pipeline value, and on domain health.
The second mistake: reporting reply rate on emails sent instead of contacts reached. A six-step sequence to 1,000 people sends 4,200 emails (people drop out as they reply). If you divide replies by 4,200 you'll report a 1.2% reply rate and panic. Divide by 1,000 contacts and you get 5% — which is fine. Always normalize to unique contacts.
How does bounce rate destroy every other metric?#
Bounce rate isn't a data-quality metric. It's a reputation metric wearing a data-quality costume.
When you hard-bounce, the receiving mail server logs it. Enough hard bounces from the same sending domain, in a short enough window, and the server's filter learns a simple rule: this sender does not know who they are emailing, therefore this sender bought a list, therefore this sender is a spammer. That classification then applies to every message you send — including the ones going to perfectly valid addresses.
The mechanics are worth understanding. A bounce message carries an SMTP status code. 550 5.1.1 (user unknown) is a hard bounce and counts against you. 452 (mailbox full) is soft and mostly doesn't. 550 5.7.1 — blocked by policy — isn't a bounce at all in the useful sense; it means you're already being filtered, and it should trigger a full stop.
This is why the cheapest thing you can do to improve reply rate is not rewrite your copy. It's clean your list.
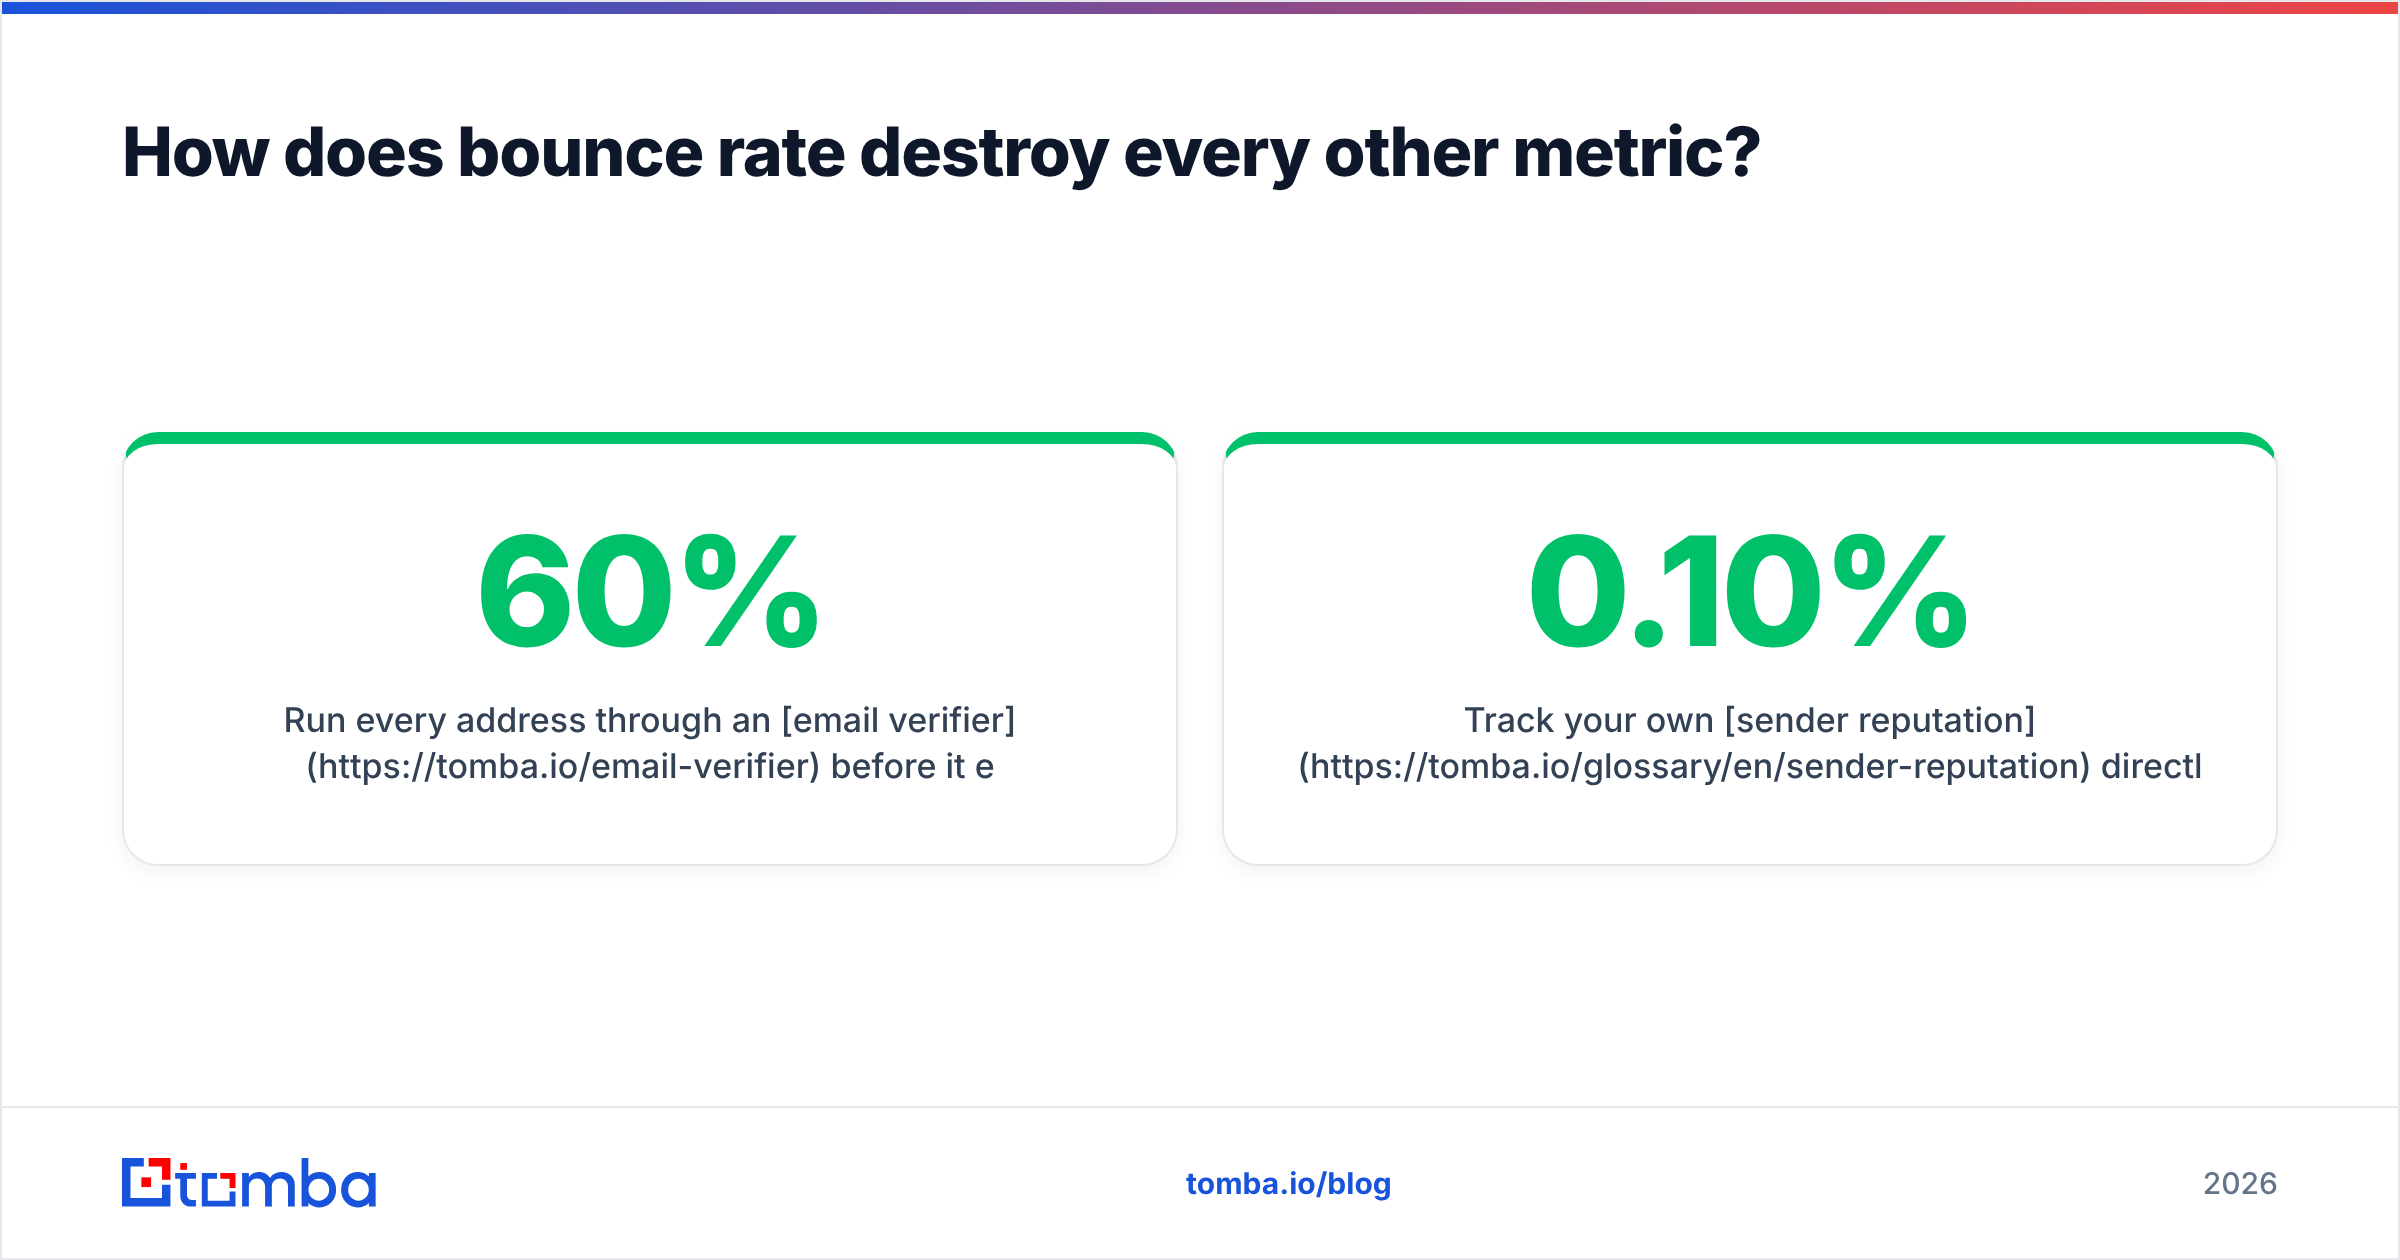
Run every address through an email verifier before it enters a sequence. For lists over a few thousand rows, bulk verify in one pass rather than verifying on send — verifying at send time means you've already burned the sequence slot on a dead contact. Catch-all domains deserve their own treatment: a catch-all verifier can distinguish "this domain accepts everything so we can't tell" from "this specific mailbox is real," which is the difference between a 60% and a 90% confidence bet on an enterprise account.

Track your own sender reputation directly rather than inferring it. Google Postmaster Tools gives you domain reputation, IP reputation, spam rate, and authentication pass rates for anything you send to Gmail — which is most of B2B. If your spam rate line crosses 0.10%, pause the sequence. If it crosses 0.30%, you have days, not weeks.
How should you measure reply quality, not just reply volume?#
Reply rate is easy to game. Write a subject line that says "quick question about your invoice" and you'll get replies. They'll all say "who are you and how did you get this address."
Split replies into four buckets and track the mix as your real health metric:
- Positive — asks a question, requests a call, forwards internally, asks for pricing. Target: 25–35% of replies.
- Neutral / defer — "not right now, circle back in Q3," "send me info." Target: 20–30%.
- Negative — "not interested," "wrong person," "we already use X." Target: 30–40%. This is healthy. Negative replies mean the message was clear enough to reject.
- Hostile — "stop emailing me," "how did you get this," spam complaint. Target: under 5% of replies. Above 10% and your targeting or your copy is wrong.
The hostile bucket is your early warning system for the spam complaint rate. It moves first, and it moves in units you can read without waiting for postmaster data to populate.
One more distinction worth building into your reporting: referral replies. "Not me, talk to Dana" is scored as negative by most tools and is in practice your single highest-converting outcome. If your sequence produces referrals at 3%+ of contacts, your targeting is one level too senior and you should stop optimizing and start scaling.
What's the right way to instrument a sequence?#
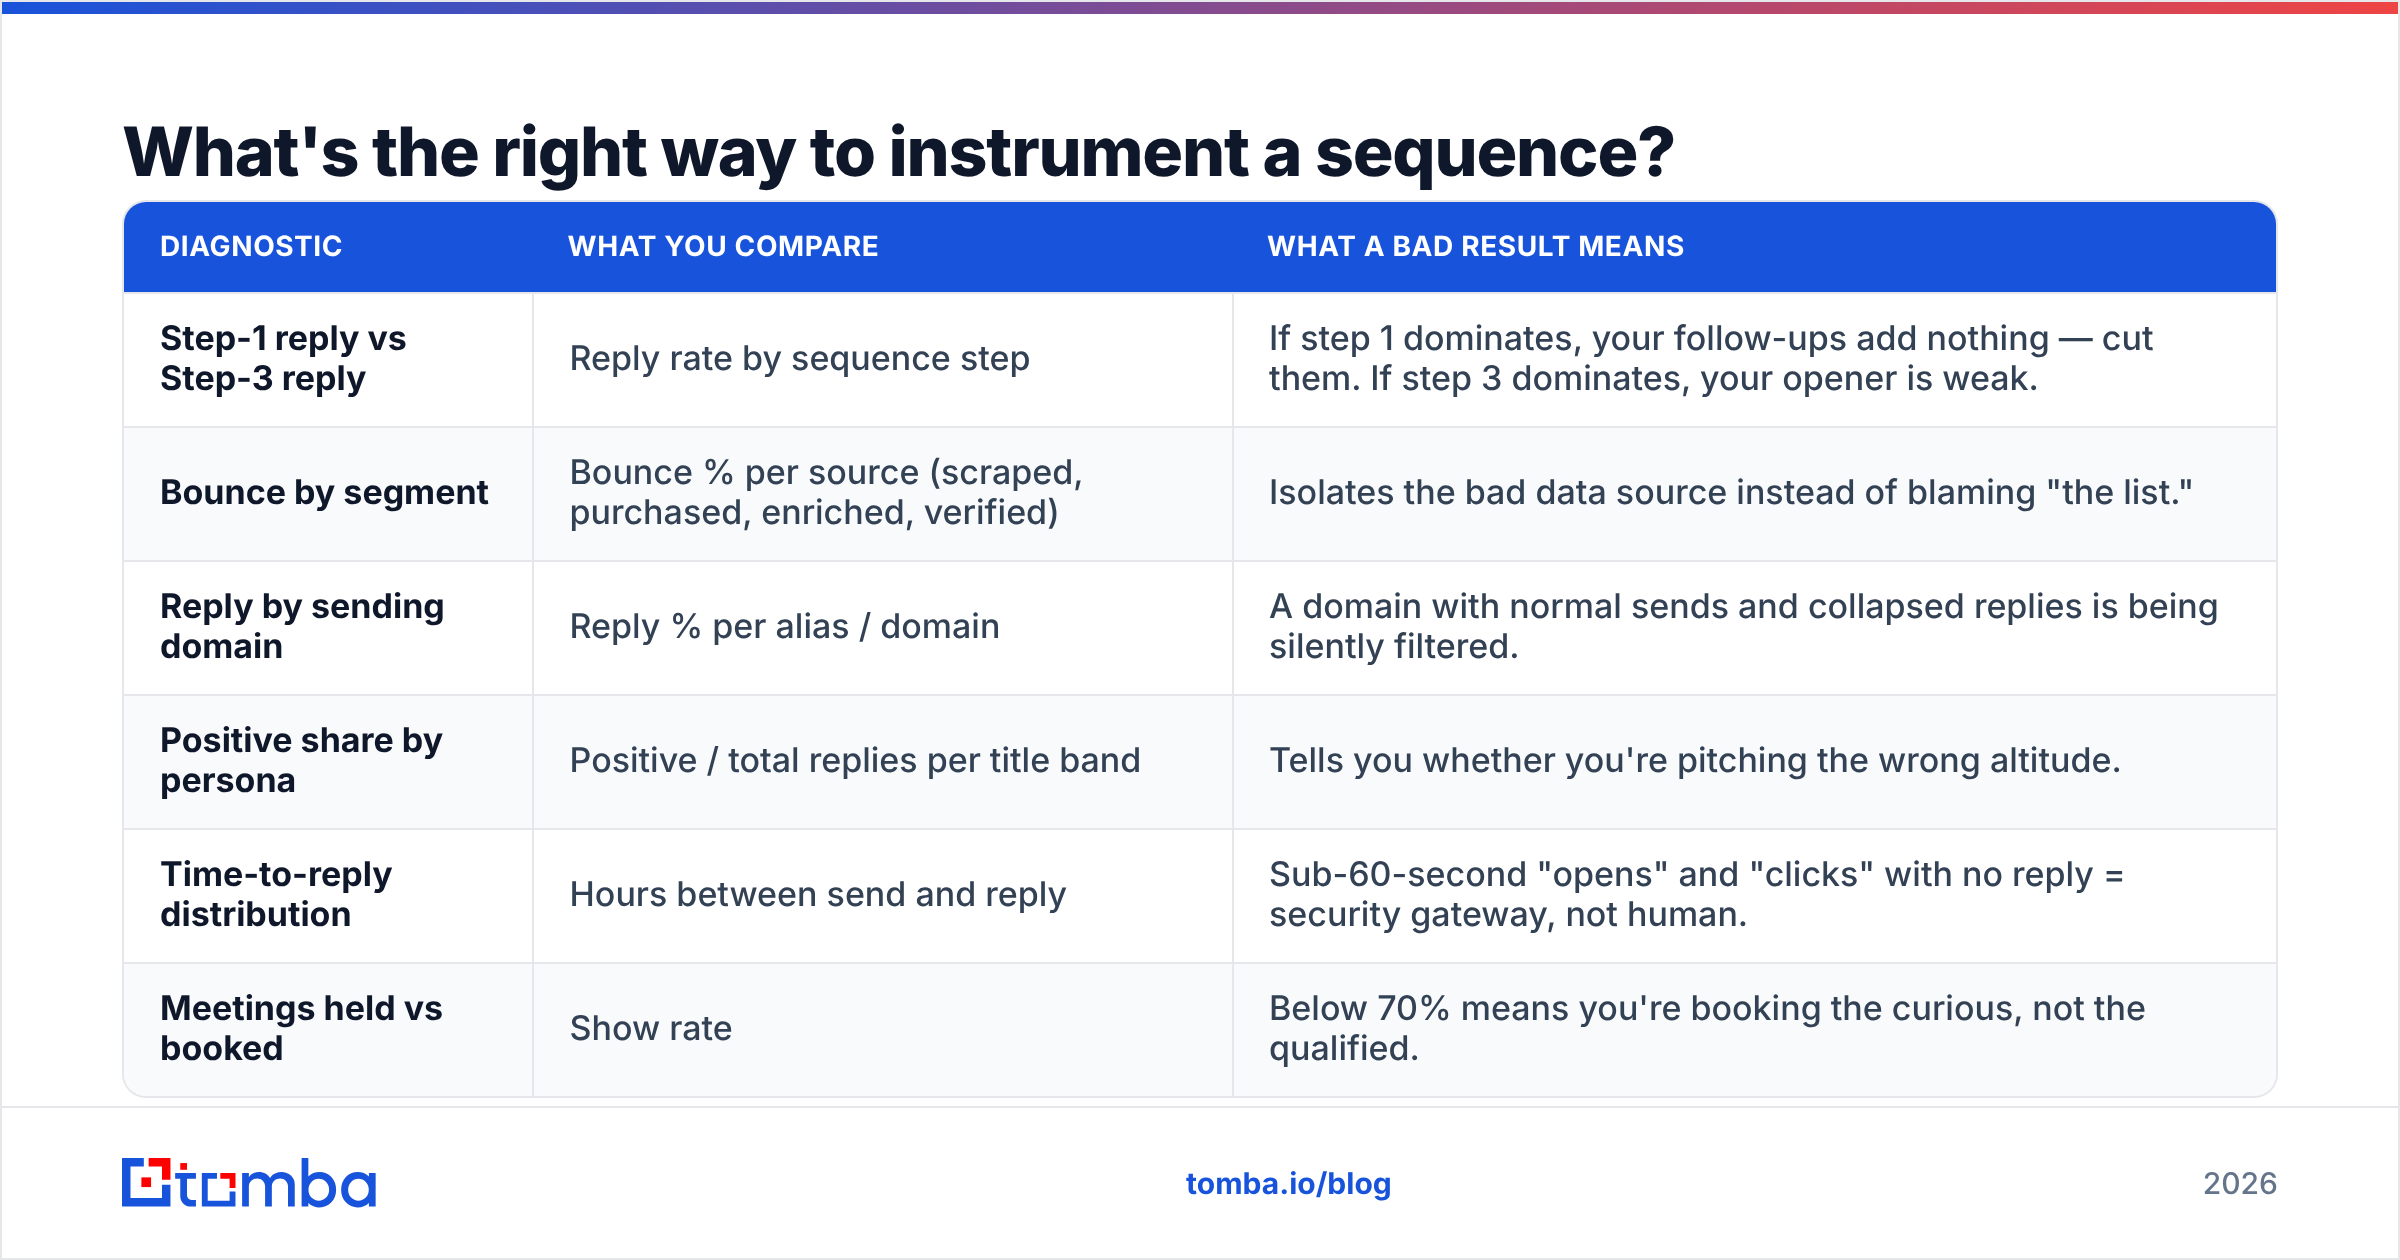
Measure per step, per segment, per sending domain. Aggregate numbers hide everything.
| Diagnostic | What you compare | What a bad result means |
|---|---|---|
| Step-1 reply vs Step-3 reply | Reply rate by sequence step | If step 1 dominates, your follow-ups add nothing — cut them. If step 3 dominates, your opener is weak. |
| Bounce by segment | Bounce % per source (scraped, purchased, enriched, verified) | Isolates the bad data source instead of blaming "the list." |
| Reply by sending domain | Reply % per alias / domain | A domain with normal sends and collapsed replies is being silently filtered. |
| Positive share by persona | Positive / total replies per title band | Tells you whether you're pitching the wrong altitude. |
| Time-to-reply distribution | Hours between send and reply | Sub-60-second "opens" and "clicks" with no reply = security gateway, not human. |
| Meetings held vs booked | Show rate | Below 70% means you're booking the curious, not the qualified. |
That last row catches a failure mode nobody reports on. A rep can hit meetings-booked target with a sequence that promises a free audit, and produce zero pipeline because nobody shows up. Show rate is where the metric stack finally touches revenue.
The step-level comparison is the highest-leverage one. Most teams run six-step sequences because six is what the template said. If steps 4–6 produce under 10% of your replies combined, you're spending 50% of your sending volume — and 50% of your domain reputation budget — on nothing.
Which cold email metrics can you safely ignore?#
Open rate. Discussed. Keep it as a directional tiebreaker between two subject lines within the same week on the same domain, and never report it upward.
Click rate, unless links are load-bearing in your motion. If you must track it, discard any click that lands within 90 seconds of delivery, and discard any click from a contact who never replied and never clicked again. That's a scanner.
Unsubscribe rate. A cold email with an opt-out link has a legitimate compliance purpose, but the rate itself tells you what negative reply rate already told you, more slowly.
"Engagement score" rollups that blend opens, clicks, and replies into a single number. Blending a corrupted metric with a clean one produces a corrupted metric. HubSpot's marketing benchmark data is useful for marketing email context, but resist the urge to import marketing composite scores into an outbound motion where the underlying open signal doesn't hold.
Deliverability tool "inbox placement" scores from seed-list testing. Seed lists are a small, artificial sample and providers treat them differently than real recipients. They're a smoke alarm, not a thermometer. Real email deliverability is measured on your actual sends, by watching reply rate collapse before bounce rate moves.
How do you build the metrics loop?#
Weekly, not daily. Cold email data is high-variance at low volume, and daily reporting produces panic-driven copy changes that make attribution impossible.
Run this cadence:
- Monday: hygiene check. Bounce rate and spam rate for the prior week. If either is out of band, everything else waits.
- Wednesday: cohort read. Reply rate and positive share for sequences that finished their last step. Never read a sequence mid-flight.
- Friday: one change. Change exactly one variable — one segment, one opener, one step count. Two changes means you learn nothing.
- Monthly: source audit. Bounce and positive-reply rate broken out by where the contact came from. Kill any source whose bounce rate exceeds 3% or whose positive share sits below half the account average.
That fourth step is where most teams find their real problem. Reply rate isn't a copy problem in 80% of the audits I've seen — it's three bad data sources dragging down four good ones, invisible in the aggregate. Consistent data enrichment with a documented provenance trail turns that audit from a guess into a query.
And a note on response rate as a term of art: some tools count auto-replies and out-of-office messages as replies. Check your tool's definition before you celebrate. An OOO is not a human.
Where should you start?#
Start at the bottom of the funnel and work up, because a fix at the top is worthless if the bottom is broken.
Pull last quarter's sends. Compute bounce rate by source. If it's above 2%, your metric problem is a data problem, and no amount of subject-line testing will move reply rate until the list is clean. If it's under 2%, compute positive-reply share by persona — the answer is almost always that one title band is carrying the whole number and you should be sending three times as much to them.
Clean data is the cheapest lever in outbound. Every dead address you remove before send protects your domain reputation, and domain reputation is what determines whether your good emails reach the good prospects.
Get your bounce rate under control first. Tomba Email Finder returns verified, source-attributed work emails so contacts enter your sequence already validated — which keeps bounce rate under 2% and stops the reputation drag that quietly caps every other number on your dashboard. Start free with 25 searches a month; paid plans begin at $49/mo. Check Tomba pricing for volume tiers, or wire it into your stack directly through the Tomba API.
Related guides#
// get started
Find, verify and enrich your first contacts today
Start on the free plan with 25 searches a month, then scale when your team is ready.
Free plan · No credit card required · GDPR & CCPA
// about the author