How to Create a Sales Plan in 2026: A Step-by-Step Framework
Most sales plans are quota spreadsheets with a mission statement stapled on. Here's how to create a sales plan that actually survives contact with Q1 — with real math, a territory model, and the data layer underneath it.
TL;DR#
- A sales plan is not a revenue target. It's the arithmetic that connects a target to headcount, activity, territory, and pipeline coverage — plus the assumptions you'll be judged on when it breaks.
- Build it bottom-up (capacity × conversion × cycle) and sanity-check it top-down (TAM × realistic share). If the two numbers are more than ~20% apart, one of them is fiction.
- Most plans die on the data layer, not the strategy layer. If your reps burn 11 hours a week hunting contact details, your activity model is already wrong.
- Pipeline coverage of 3x is the lazy default. Compute your own:
required coverage = 1 / win rate, then add a buffer for slippage. - Review the plan monthly against leading indicators (meetings booked, new pipeline created), not lagging ones (closed revenue). By the time revenue tells you the plan is broken, the quarter is over.
What Is a Sales Plan, Actually?#
A sales plan is a written argument that a specific revenue number is achievable, with the math and the resourcing to back it.
That's it. Everything else — the mission statement, the "we will delight our customers" paragraph, the SWOT quadrant nobody reads — is decoration. If someone can't take your plan, delete the prose, and still reconstruct how you get from zero to $4M, you don't have a plan. You have a hope with formatting.
The useful test: hand your plan to a new VP of Sales who's never seen your company. Can they answer these four questions from the document alone?
- Where does revenue come from? Segment, geography, product line, new vs. expansion — with a dollar figure against each.
- Who does the work? Headcount by role, ramp schedule, quota per rep, and what happens if you hire two months late.
- What has to be true? Win rate, average contract value, sales cycle length, lead volume. These are your assumptions, and they will be wrong. Write them down anyway so you can see which one broke.
- How will you know it's working? Leading indicators with thresholds, reviewed on a cadence.
If the document answers those, it's a sales plan. If it opens with "In an increasingly competitive landscape," it's a deck.
How Is a Sales Plan Different From a Sales Strategy or Forecast?#
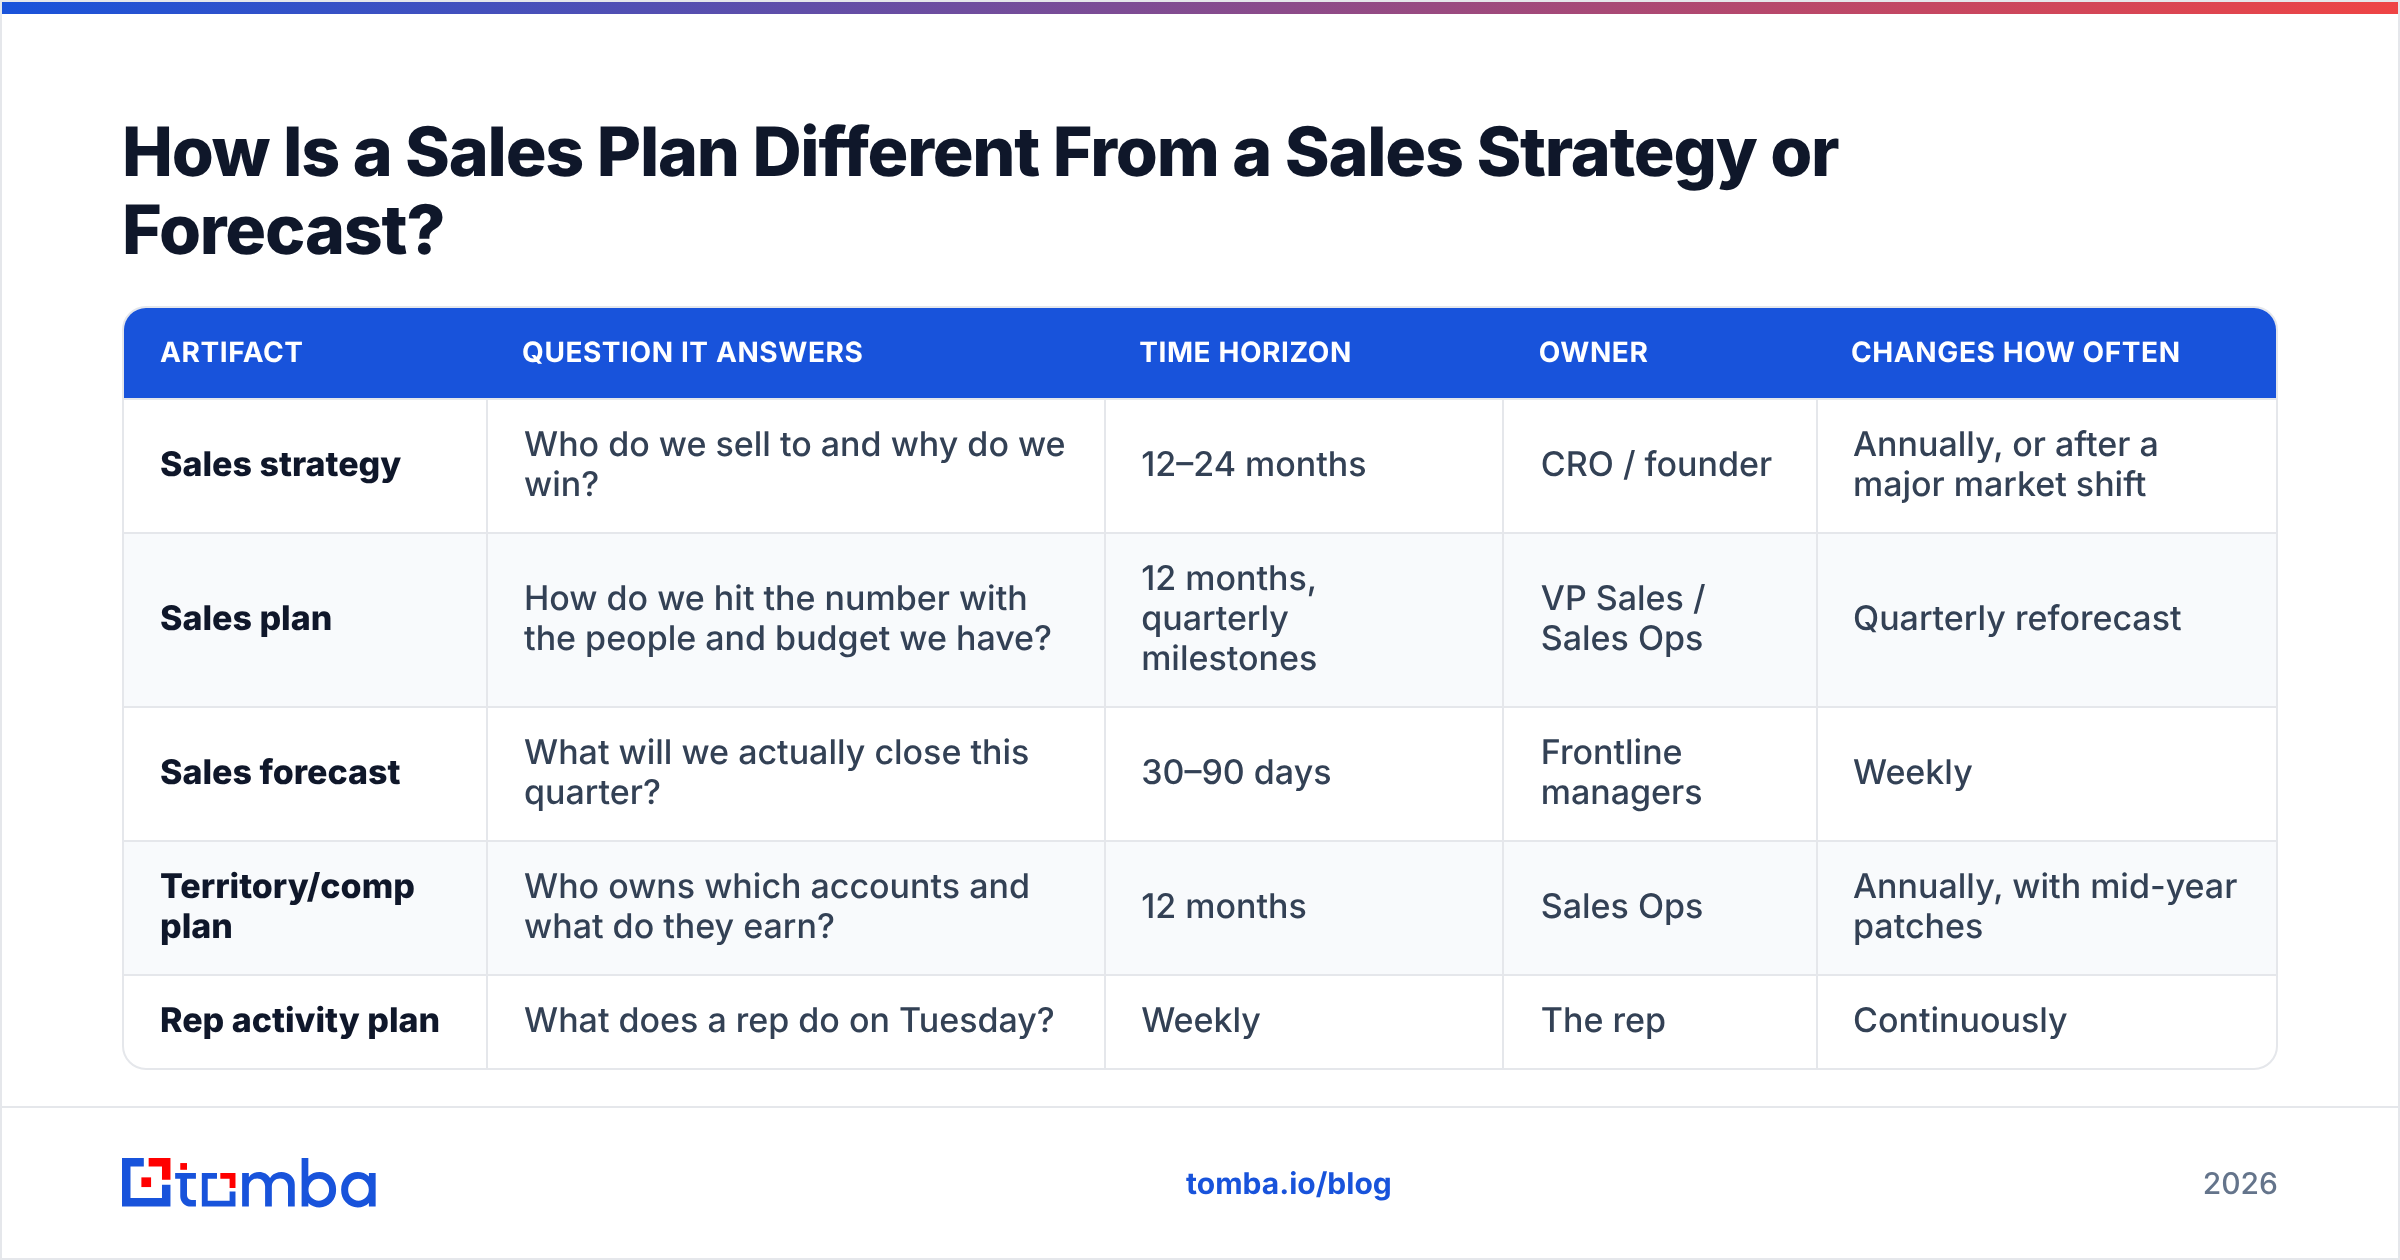
These three get used interchangeably and it causes real damage in planning meetings. They're different artifacts with different owners and different review cycles.
| Artifact | Question it answers | Time horizon | Owner | Changes how often |
|---|---|---|---|---|
| Sales strategy | Who do we sell to and why do we win? | 12–24 months | CRO / founder | Annually, or after a major market shift |
| Sales plan | How do we hit the number with the people and budget we have? | 12 months, quarterly milestones | VP Sales / Sales Ops | Quarterly reforecast |
| Sales forecast | What will we actually close this quarter? | 30–90 days | Frontline managers | Weekly |
| Territory/comp plan | Who owns which accounts and what do they earn? | 12 months | Sales Ops | Annually, with mid-year patches |
| Rep activity plan | What does a rep do on Tuesday? | Weekly | The rep | Continuously |
The failure mode: teams write a strategy, call it a plan, then forecast against nothing. Or they build a beautiful forecast model and never resource the plan that feeds it. Keep them separate documents. They cross-reference; they don't merge.
How Do You Create a Sales Plan Step by Step?#
Here's the sequence that works. Do it in order — step 4 is meaningless if step 2 is guessed.
1. Pull the last four quarters of actuals#
Not the board deck version. The raw CRM export. You need: closed-won count, closed-won ACV, win rate by segment, average sales cycle by segment, pipeline created per month, and — this is the one everyone skips — lead-to-meeting conversion by source.
Expect the data to be dirty. Contacts with no title, accounts with no employee count, opportunities that closed with no source attribution. Clean it now or your plan inherits the noise. Running your CRM export through data enrichment to backfill firmographics and job titles is a two-hour job that makes the next five steps possible.
2. Set the top-down number and the bottom-up number separately#
Top-down: what does the board/CEO/your cash runway require? This number arrives from outside sales. Take it as a constraint, not a truth.
Bottom-up: build it from capacity.
Quota-carrying reps × quota per rep × expected attainment rate = achievable revenueSay you have 6 AEs, quota of $600K, and your historical attainment is 72% (be honest — the median, not the top rep). That's 6 × 600,000 × 0.72 = $2.59M. If the board wants $4M from the same 6 reps, you don't have a plan problem. You have a headcount conversation to have, today, before the plan is signed.
3. Do the ramp math on new hires#
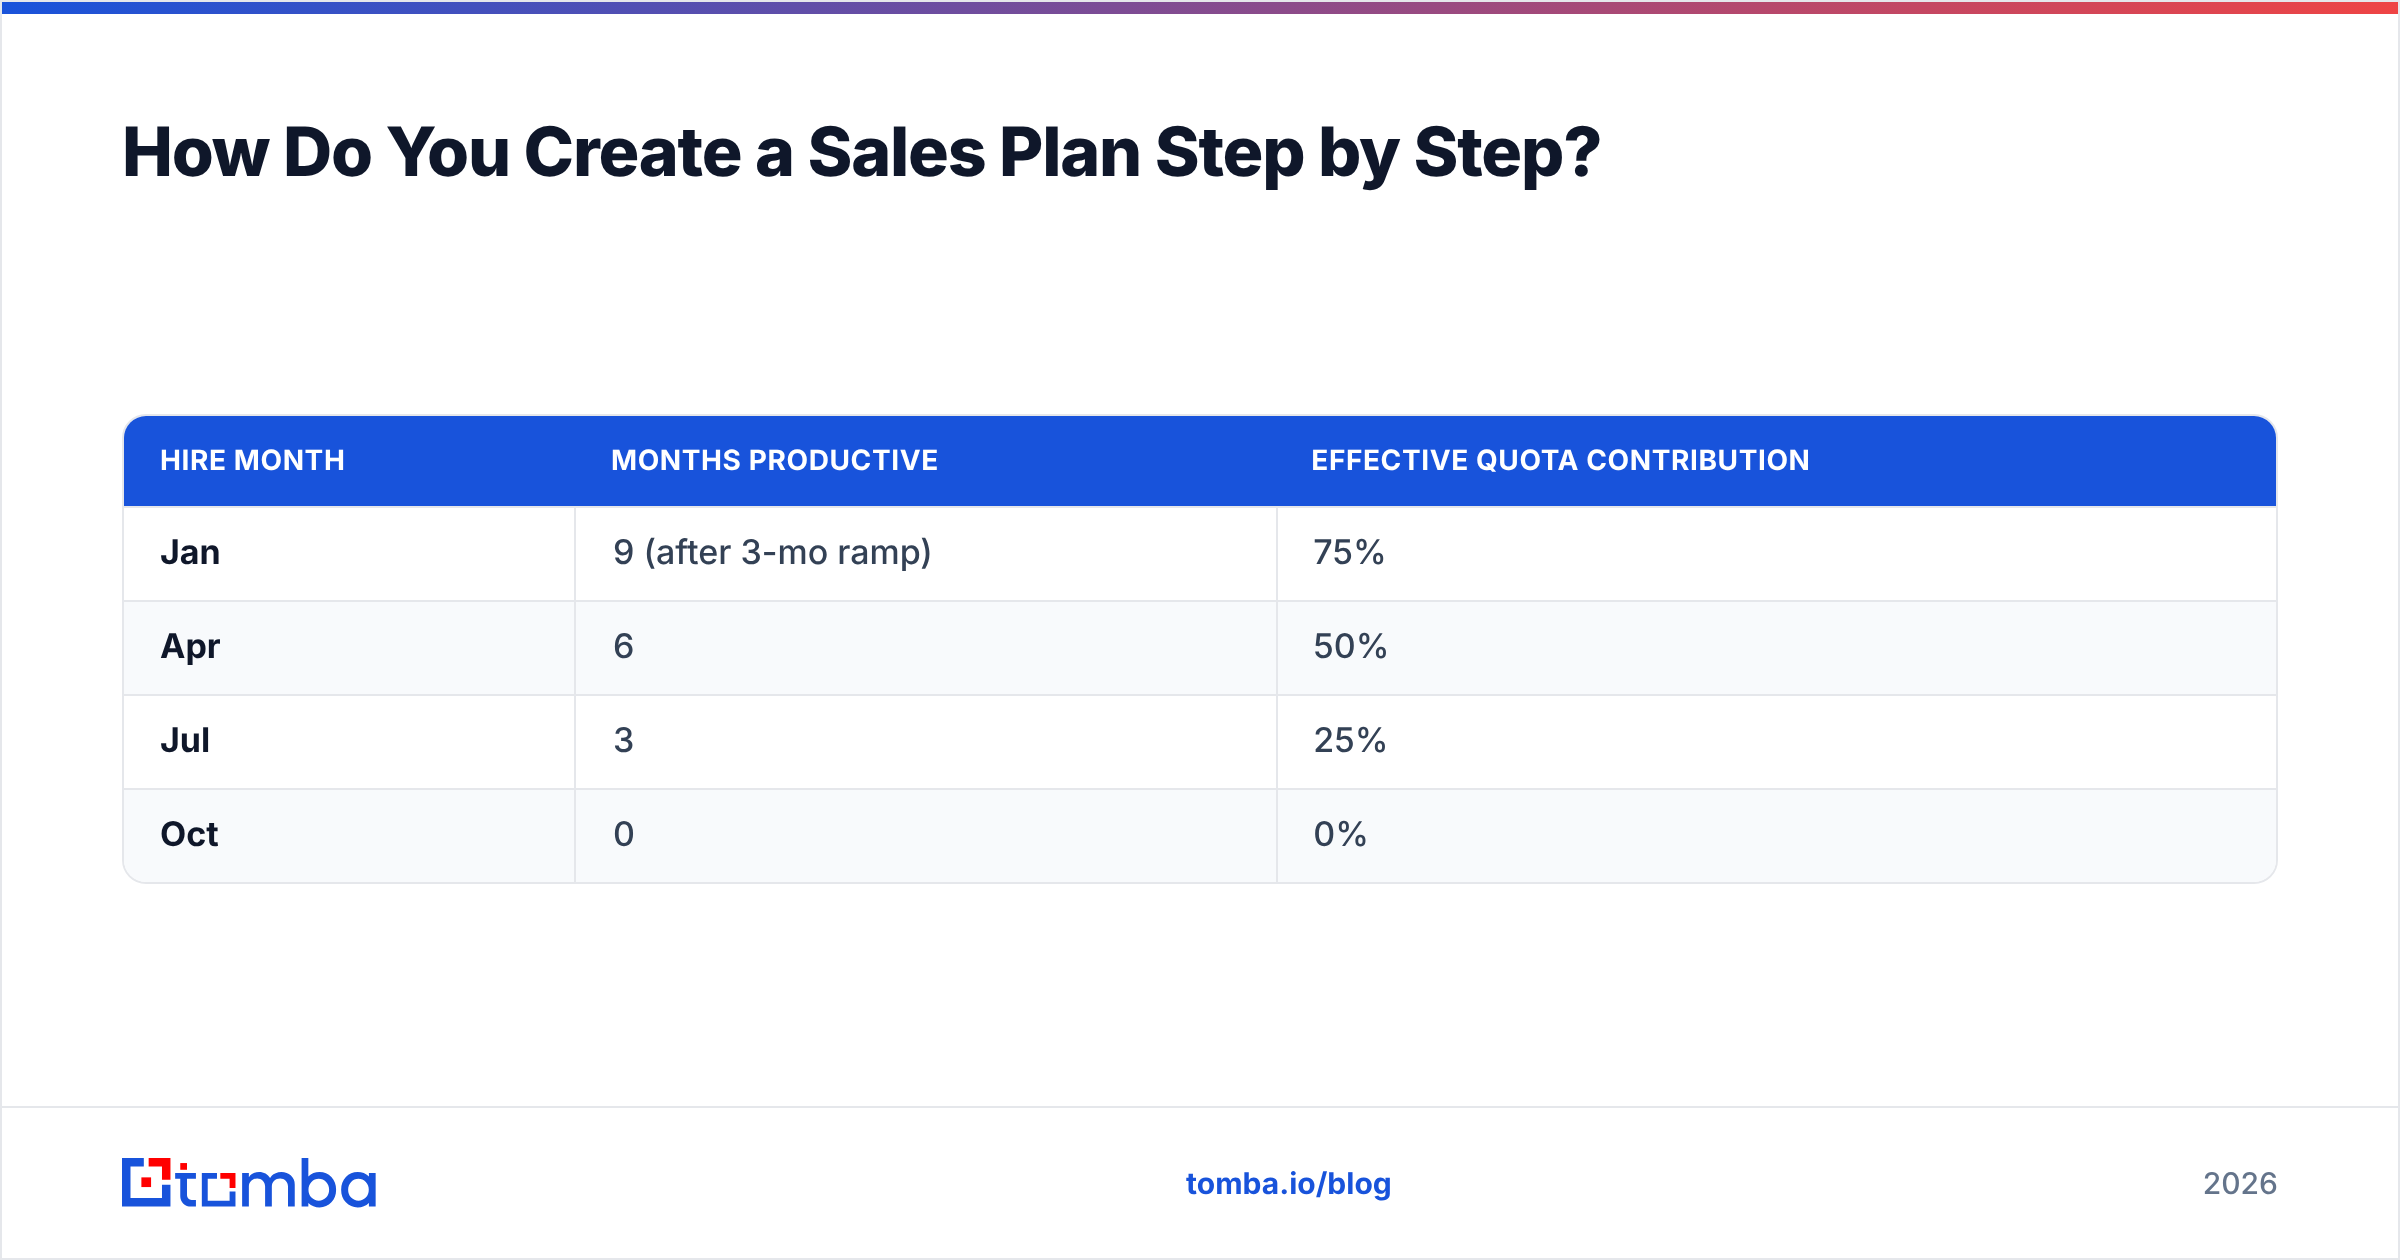
A new AE does not produce on day one. Assume a 3–5 month ramp for mid-market, 6–9 for enterprise. A rep hired in month 8 of the year contributes maybe 15% of an annual quota. Model it explicitly:
| Hire month | Months productive | Effective quota contribution |
|---|---|---|
| Jan | 9 (after 3-mo ramp) | 75% |
| Apr | 6 | 50% |
| Jul | 3 | 25% |
| Oct | 0 | 0% |
Every plan that assumes "we'll hire 4 reps this year" and credits them with 4 full quotas is off by roughly half a rep's worth of revenue. That's usually the exact size of the miss.
4. Compute your real pipeline coverage requirement#
The 3x rule is folklore. Compute yours:
Required coverage = 1 / win rateA 25% win rate means you need 4x coverage just to break even on the math — before accounting for deals that slip out of the quarter. Add 15–25% for slippage and you're at 4.6–5x. If your team has been running at 3x with a 25% win rate, you have been missing quota structurally, and no amount of coaching fixes it. You need more pipeline, or a higher win rate.
5. Back into activity metrics#
Now walk the funnel backward from the coverage number:
- Pipeline needed: $4M target ÷ 0.25 win rate = $16M in qualified pipeline
- Opportunities needed: $16M ÷ $40K ACV = 400 qualified opps
- Meetings needed: at 40% meeting→opp = 1,000 discovery meetings
- Contacts needed: at 5% cold outreach reply-to-meeting = 20,000 contacted prospects
- Contacts to source: at 90% deliverable rate = ~22,000 verified contacts
That last line is the one that turns a plan into a procurement decision. 22,000 verified contacts is not something a rep does between calls. It's a data workflow, and it belongs in the plan with a line item and a budget.
6. Assign territories and quotas#
Territories should be balanced on opportunity, not account count. A rep with 200 SMB accounts and a rep with 40 enterprise accounts can carry the same quota. Balance on total addressable revenue in the territory, then check for fairness on account count second.
7. Write the assumption register#
One page. Every number you guessed, the value you used, and the threshold at which the plan breaks.
Win rate: 25% (plan breaks below 19%)
ACV: $40K (plan breaks below $33K)
Rep ramp: 3 months (plan breaks above 5 months)
Lead volume: 1,800/mo (plan breaks below 1,300/mo)
When you miss, you check the register first. It turns "what went wrong" from a two-week forensic exercise into a five-minute meeting.
What Are the Core Components of a Sales Plan?#
Use this as a table of contents. Anything not on this list is optional.
- Revenue target, broken by segment and quarter — a single number is not a target, it's a wish. Break it into at least segment × quarter cells.
- Ideal customer profile and buyer personas — with firmographic filters specific enough to build a list from. "Mid-market SaaS" is not an ICP. "US-based B2B SaaS, 50–500 employees, has a VP of RevOps, uses Salesforce" is.
- Capacity and headcount model — reps by role, hire dates, ramp curves, attainment assumptions.
- Channel and motion mix — outbound, inbound, partner, expansion, with a revenue split and a cost per acquired dollar for each.
- Pipeline coverage plan — required coverage, current coverage, and the specific mechanism to close the gap.
- Data and tooling budget — contact data, verification, sequencing, CRM. Reps can't outbound to prospects they can't reach.
- Enablement and ramp plan — what a rep must be able to do at 30/60/90 days.
- Review cadence and leading indicators — the dates and the metrics, in writing.
- Assumption register — see above.
- Contingency branch — what you cut, and in what order, at 80% pace.
Why Do Most Sales Plans Fail in Q1?#
Because they were built on activity assumptions that ignore where rep time actually goes.
The standard plan assumes a rep spends their week selling. The actual week, per HubSpot's sales research, is dominated by non-selling work — CRM hygiene, internal meetings, and above all, prospect research. Salesforce's State of Sales research has repeatedly found reps spend roughly 70% of their time on tasks that aren't selling.
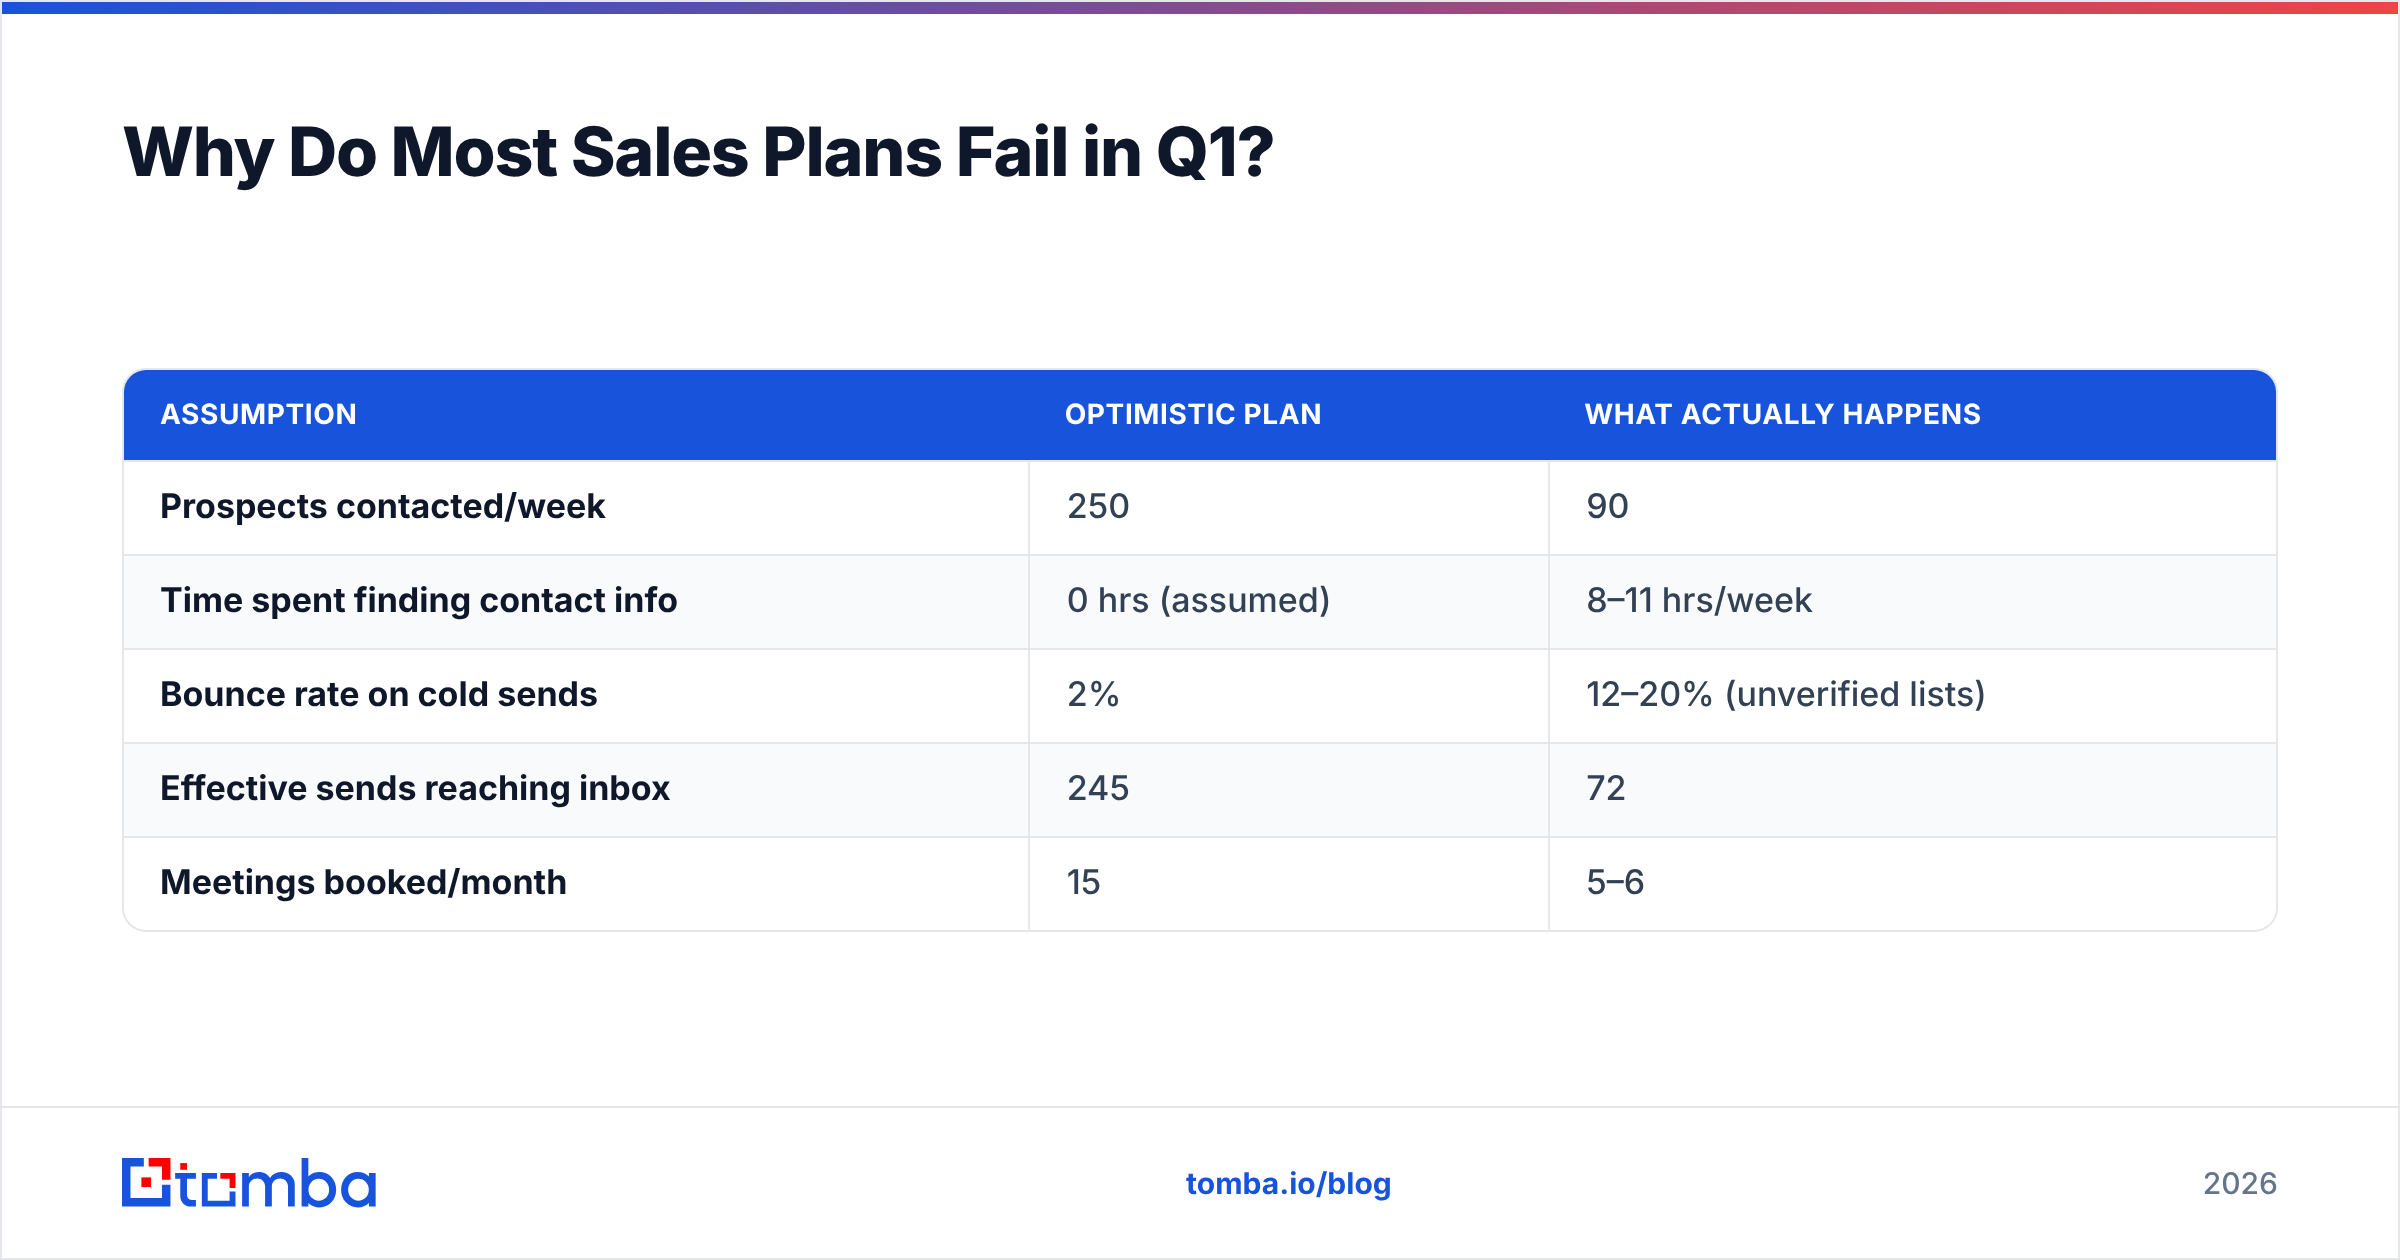
So when your plan says "each SDR will book 15 meetings a month," check the arithmetic underneath it:
| Assumption | Optimistic plan | What actually happens |
|---|---|---|
| Prospects contacted/week | 250 | 90 |
| Time spent finding contact info | 0 hrs (assumed) | 8–11 hrs/week |
| Bounce rate on cold sends | 2% | 12–20% (unverified lists) |
| Effective sends reaching inbox | 245 | 72 |
| Meetings booked/month | 15 | 5–6 |
The plan didn't fail because the reps were lazy. It failed because nobody budgeted the data layer. Two fixes, both cheap:
- Source contacts programmatically, not manually. A bulk email finder turns a list of 2,000 company domains and target job titles into a contact file in minutes, instead of a rep tab-hopping through LinkedIn for a week.
- Verify before you send. Unverified lists bounce, bounces wreck sender reputation, and a wrecked domain reputation quietly kills every subsequent campaign in the plan. Run the list through an email verifier first. It's the cheapest insurance in the entire plan.
How Do You Build the Data Layer Into the Plan?#
Treat contact data as a line item with a cost and a throughput, exactly like headcount.
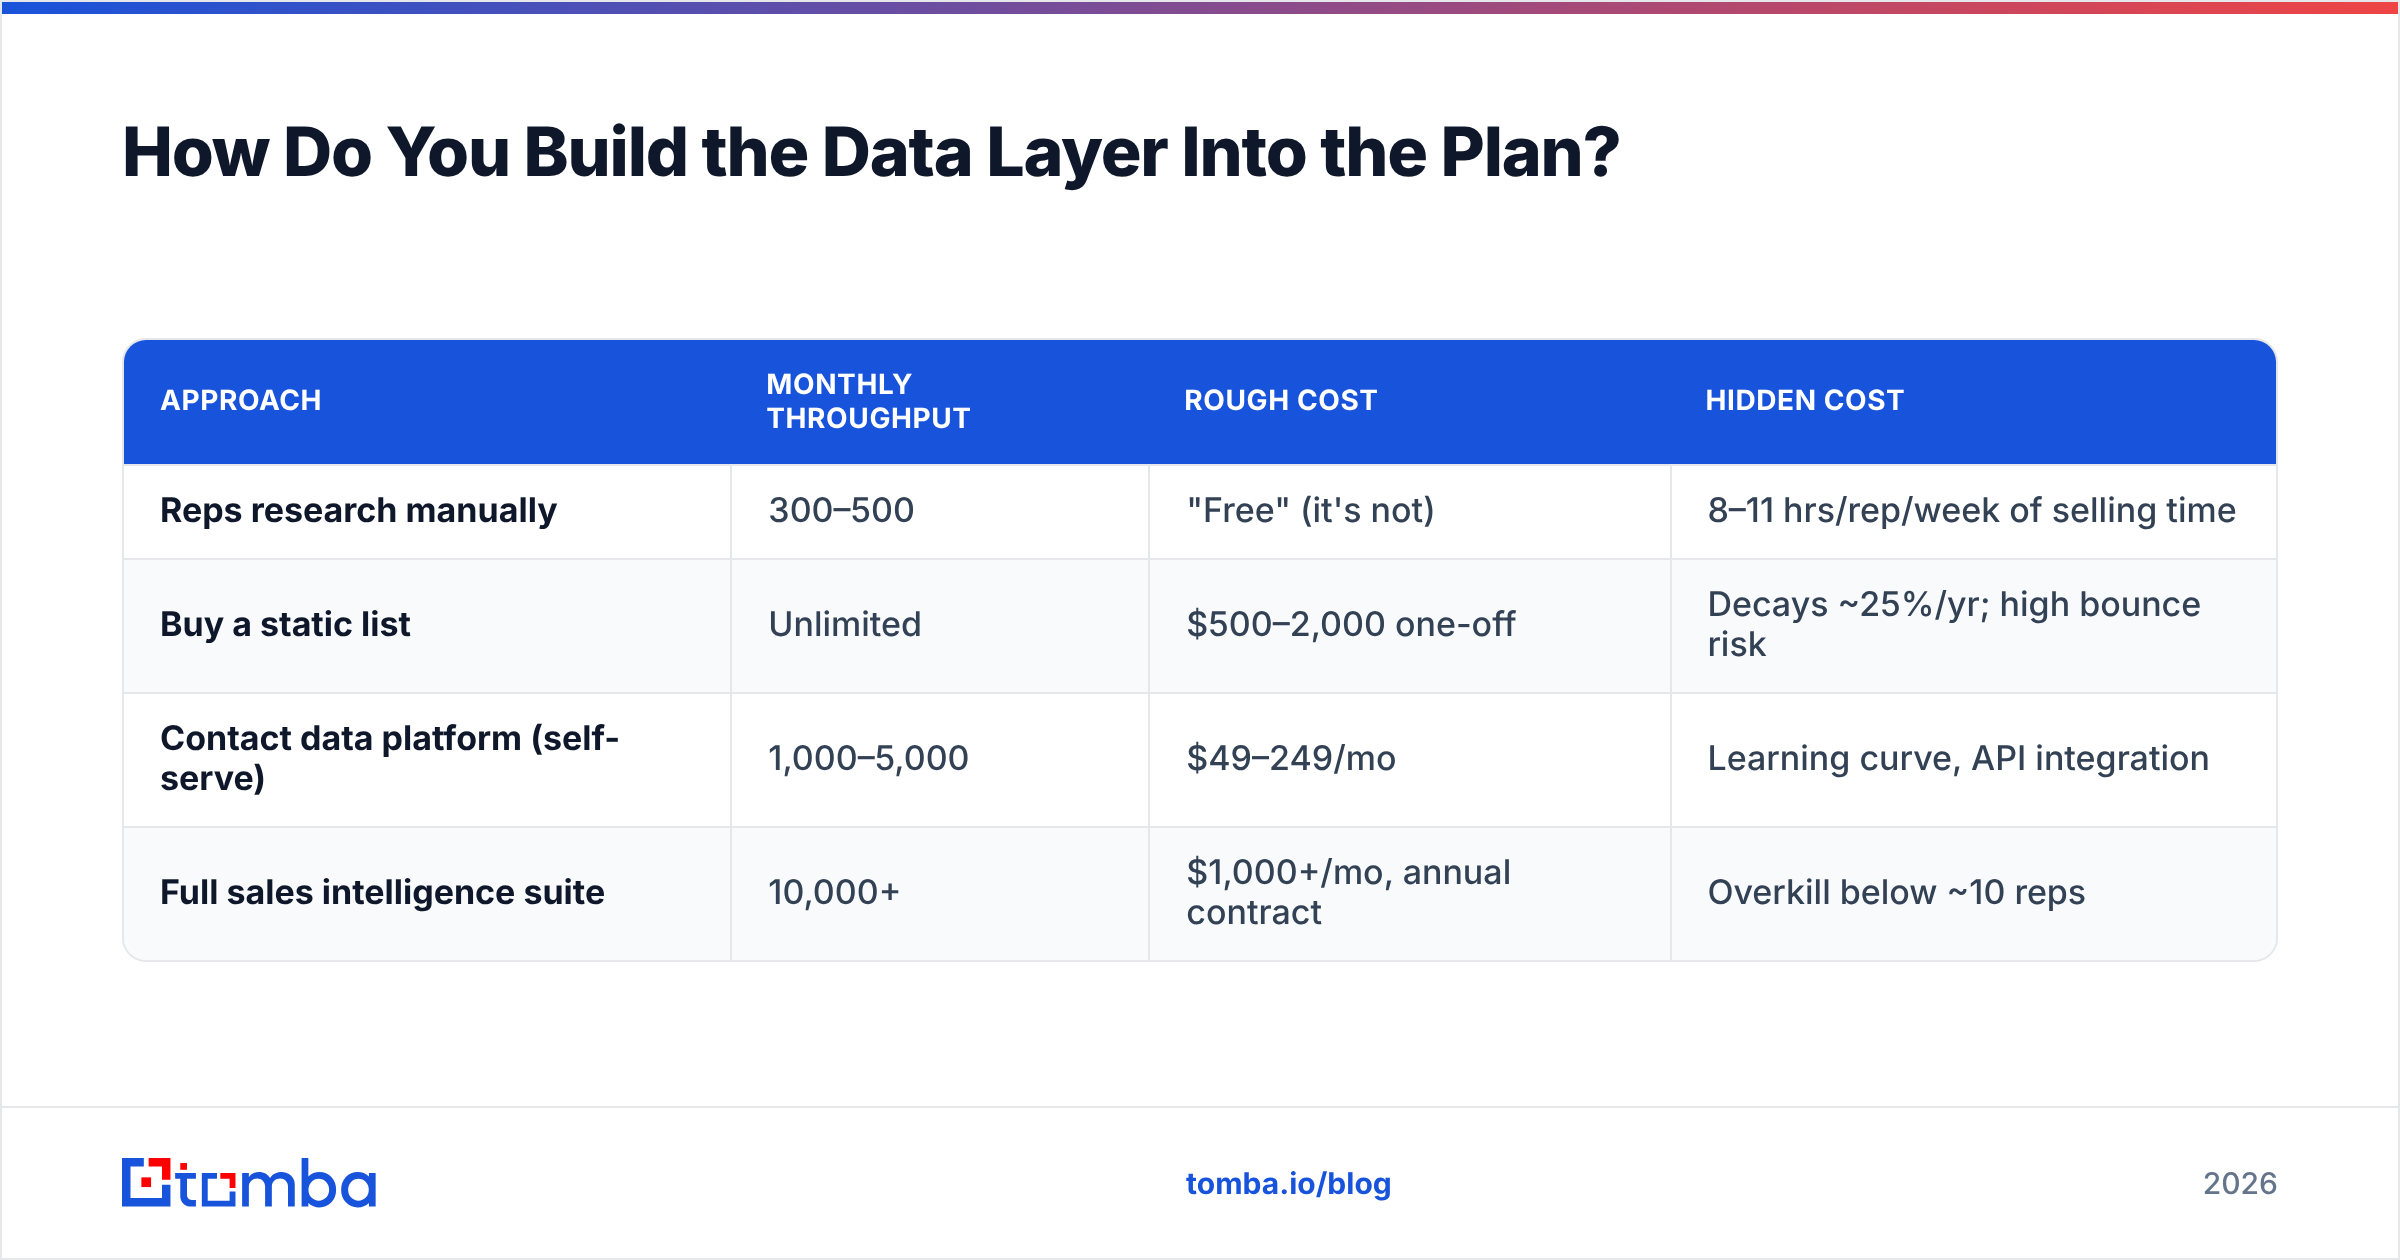
Work it out from the activity math in step 5. If the plan needs 22,000 verified contacts across the year, that's ~1,830/month. Now price it, and note the cost per acquired dollar:
| Approach | Monthly throughput | Rough cost | Hidden cost |
|---|---|---|---|
| Reps research manually | 300–500 | "Free" (it's not) | 8–11 hrs/rep/week of selling time |
| Buy a static list | Unlimited | $500–2,000 one-off | Decays ~25%/yr; high bounce risk |
| Contact data platform (self-serve) | 1,000–5,000 | $49–249/mo | Learning curve, API integration |
| Full sales intelligence suite | 10,000+ | $1,000+/mo, annual contract | Overkill below ~10 reps |
For a team of 5–15 reps, a focused email-finding tool is almost always the right call over an all-in-one suite you'll use 15% of. Tomba pricing starts free at 25 searches/month, with Starter at $49/mo and Growth at $99/mo — which covers the 1,830-contacts-a-month requirement above at a cost that rounds to nothing against a $4M target. Peers like BookYourData take a database-first approach with pay-as-you-go credits, which suits teams that want to buy a list in one shot rather than run continuous discovery. Both are legitimate structures; pick based on whether your motion is campaign-burst or always-on.
The point isn't which vendor. It's that the line exists in the plan at all. A sales plan with a headcount budget and no data budget is a plan to have expensive people do cheap work.
How Do You Choose the Right Channel Mix?#
Split the target by motion, and cost each one. This is where plans quietly leak margin.
| Motion | Best for | Typical CAC payback | Ramp to first revenue | Fails when |
|---|---|---|---|---|
| Outbound (cold email) | Defined ICP, $10K+ ACV | 6–12 months | 4–8 weeks | ICP is fuzzy or data is bad |
| Inbound (content/SEO) | Broad market, self-serve motion | 9–18 months | 6–12 months | You need revenue this quarter |
| Partner/channel | Complex products, existing ecosystems | 12+ months | 6–9 months | You have no brand yet |
| Expansion/upsell | Existing base > 50 accounts | 1–3 months | Immediate | Base is small or churning |
| Paid ads | High-intent keywords exist | 3–9 months | 2–4 weeks | LTV:CAC is under 3:1 |
Two rules that save a lot of pain:
Don't plan a new motion and a new number in the same year. If you're adding partner-led revenue, don't also raise the outbound quota 40%. Pick one bet.
Front-load the fast motions. Expansion and outbound produce revenue in weeks. Inbound and partner produce it in quarters. If your Q1 target depends on a content strategy that starts in January, your Q1 target is already missed. Sequence the plan so the fast motions carry the first half and the slow ones carry the second.
What Metrics Should You Review, and How Often?#
Lagging indicators tell you the plan already failed. Leading indicators tell you it's about to.
Weekly (frontline managers):
- New pipeline created ($ and count)
- Meetings booked and meetings held (the gap between them is a quality signal)
- Sequence response rate by segment
- Bounce rate on outbound — anything over 3% means your list is rotting
Monthly (VP Sales):
- Pipeline coverage vs. required coverage, by quarter
- Win rate trend by segment
- Rep attainment distribution — if one rep carries 60% of the number, you don't have a team, you have a hero and a risk
- Average sales cycle (a lengthening cycle is the earliest reliable miss signal)
Quarterly (leadership):
- Reforecast against the assumption register — which assumptions broke, by how much
- Territory rebalance if any rep is >30% off the mean opportunity
- CAC by channel, and kill or double down accordingly
Set thresholds in advance. "Coverage below 3.5x by the second week of the quarter triggers an SDR blitz" is a plan. "Let's keep an eye on pipeline" is a vibe.
What Does a Good Sales Plan Actually Look Like?#
Short. Six to ten pages, most of it tables. The best plans I've seen read like a flight plan, not a manifesto: numbers, thresholds, and what you do when the numbers go outside the thresholds.
A structure that works:
- Page 1: The number, split by quarter and segment. One table.
- Page 2: Capacity model. Reps, quotas, ramp, attainment. One table, one paragraph of commentary.
- Page 3: ICP and territory map.
- Page 4: Funnel math — from revenue target back to contacts required.
- Page 5: Channel mix and budget, including the data line.
- Page 6: Cadence, leading indicators, thresholds.
- Page 7: Assumption register and contingency branch.
Anything longer stops being read by week three, which means it stops being a plan and becomes an artifact. If you want a benchmark for what "good" looks like at scale, G2's sales planning category and the vendor docs from the CRM you already run are more useful than another template blog. Read what the tooling assumes about your process — it's usually a better mirror than any framework.
Where Should You Start This Week?#
Pull the four-quarter actuals and compute two numbers: your real win rate, and your real attainment rate. Almost every broken plan traces back to one of those two being assumed rather than measured.
Then check the data line. Take the funnel math from step 5, work out how many verified contacts your plan actually requires per month, and ask honestly whether your reps are currently sourcing that many — or whether they're spending Tuesday afternoons guessing at email formats.
That's the gap the Tomba Email Finder is built to close. Feed it a domain and a name, or a list of target companies and job titles, and it returns verified professional email addresses with a confidence score — so the 22,000-contacts line in your plan becomes a workflow instead of a wish. Start on the free tier (25 searches a month) to validate the numbers against your own ICP, then scale to a plan that matches the throughput your model requires. Build the plan on measured inputs, and Q1 stops being a surprise.
Related guides#
Ready to find emails that actually work?
Join 150,000+ professionals who stopped guessing and started sending. Free credits on signup — no credit card required.
Get the Tomba newsletter
Practical outbound tactics and product updates — once every two weeks.
About the author