How to Calculate Pipeline Velocity (Formula + Examples)
Pipeline velocity turns four sales metrics into one number: dollars per day. Here is the formula, a worked example with real numbers, and the one input most revenue teams quietly measure wrong.

TL;DR
- Pipeline velocity = (number of open opportunities × average deal value × win rate) ÷ sales cycle length in days. The output is dollars per day.
- All four inputs must come from the same time window and the same stage definitions, or the number is fiction.
- Shortening your sales cycle is usually the fastest lever: cutting 60 days to 50 lifted our example team's velocity by 20% without adding a single deal.
- The input that breaks most calculations is sales cycle length — teams average closed-won deals only and quietly delete the slow losses from the math.
- Bad contact data inflates opportunity count and drags out cycle length at the same time, which is why velocity often falls right after a "successful" prospecting push.
What is pipeline velocity?#
Pipeline velocity is how much revenue your pipeline converts per day. Not per quarter, not per rep — per day.
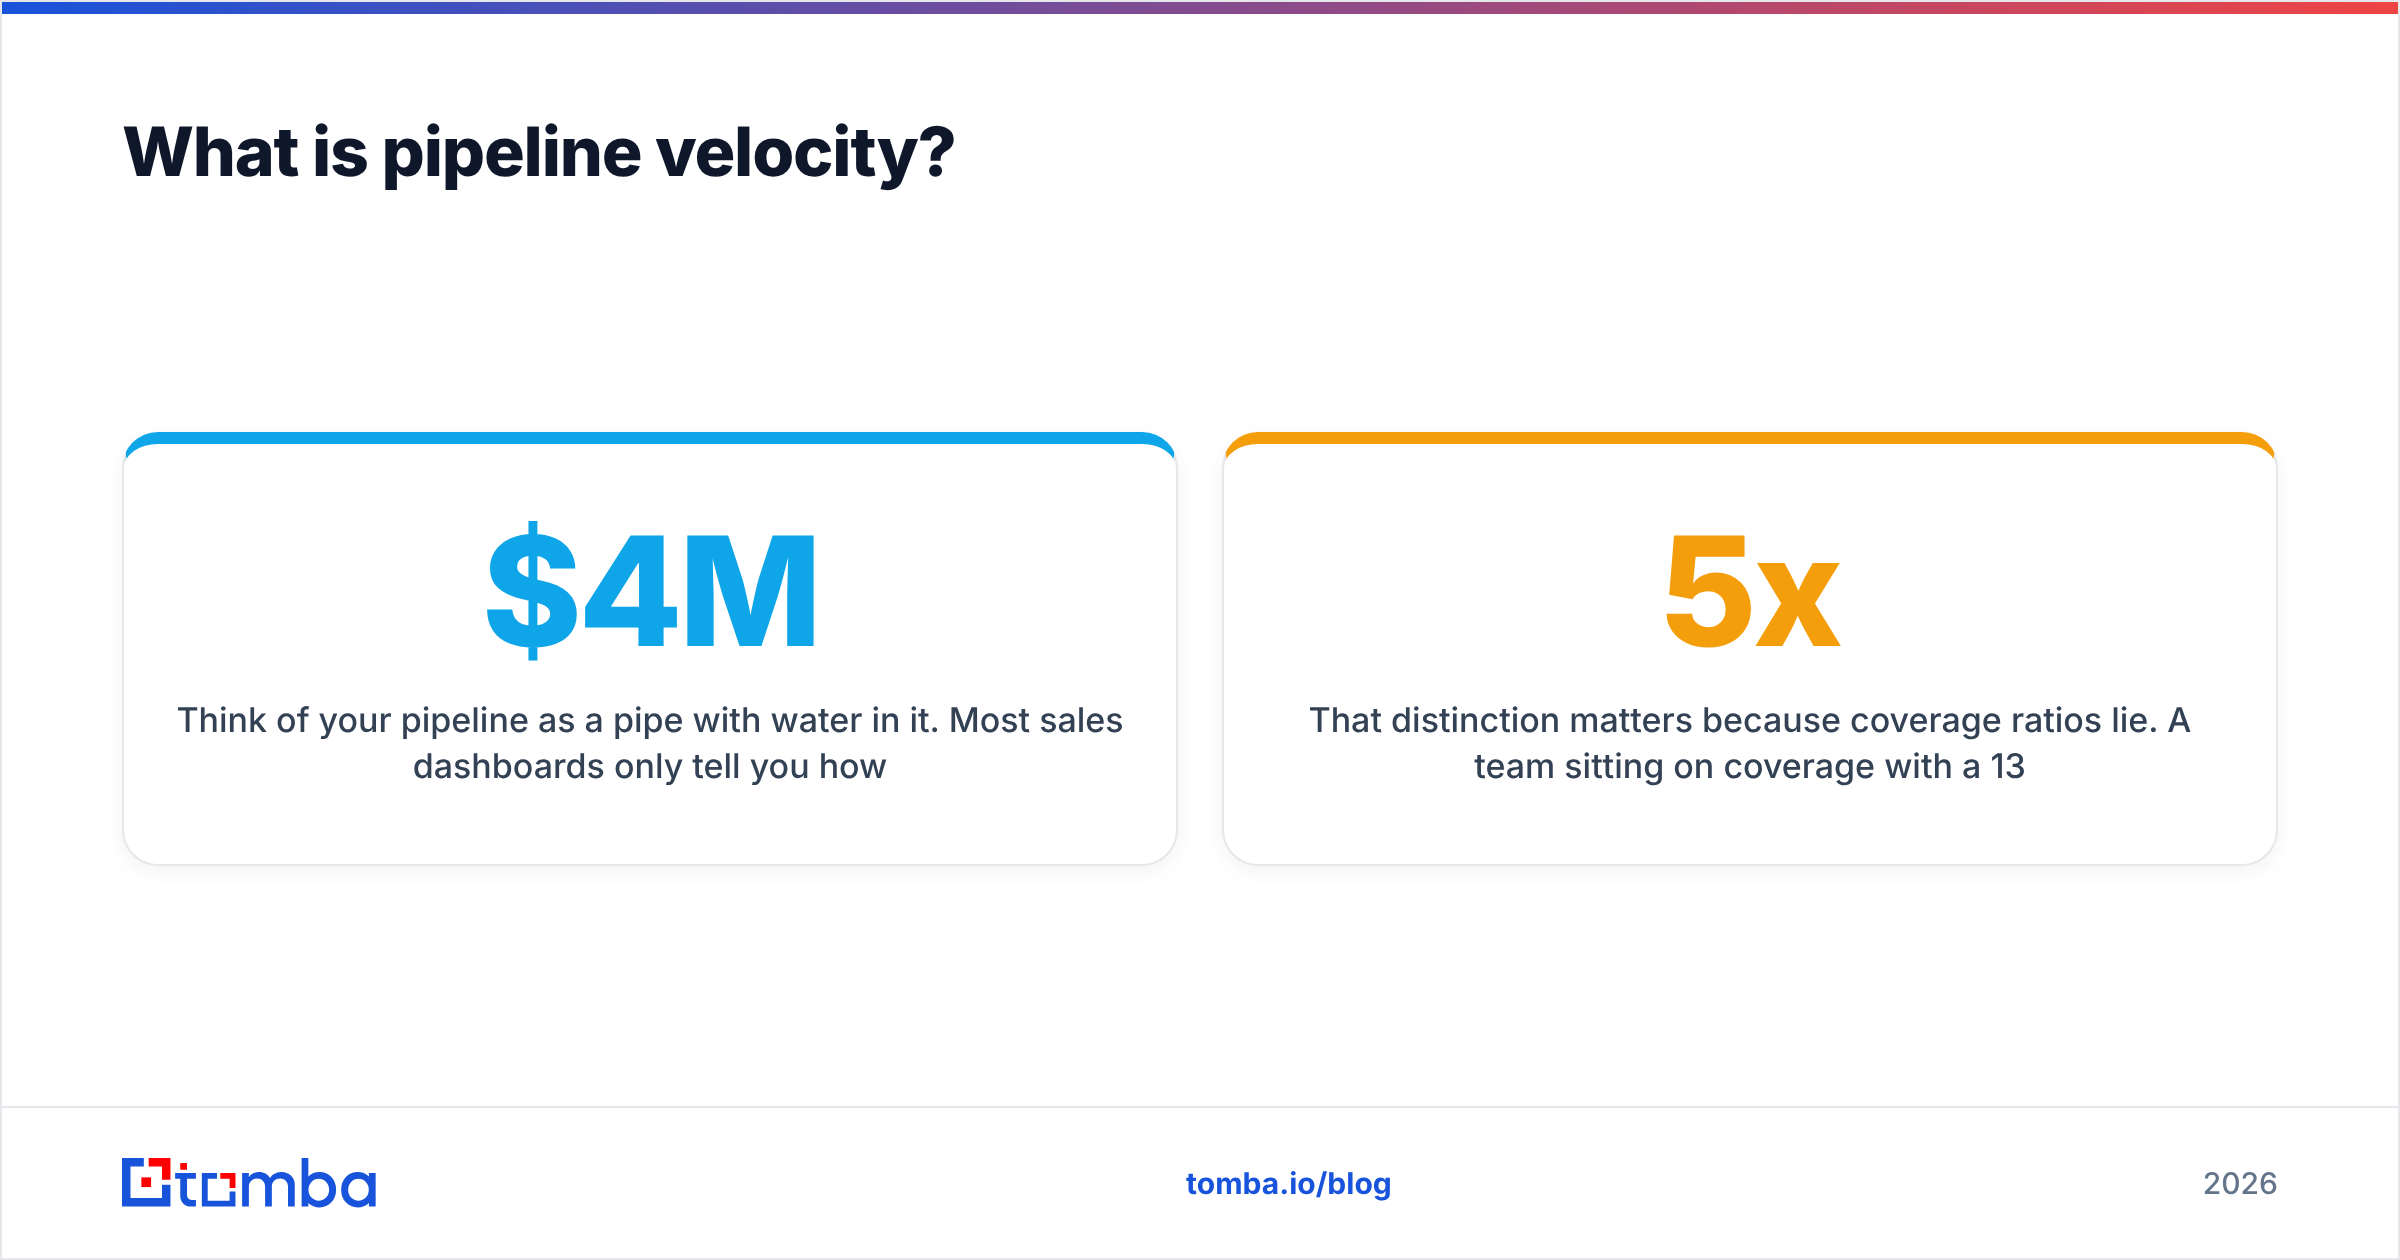
Think of your pipeline as a pipe with water in it. Most sales dashboards only tell you how much water is sitting in the pipe (pipeline coverage) or how much came out the end last month (closed revenue). Pipeline velocity tells you the flow rate. Two teams can hold identical $4M pipelines and have wildly different flow rates, because one team pushes deals through in 45 days and the other takes 110.
That distinction matters because coverage ratios lie. A team sitting on 5x coverage with a 130-day cycle and a 14% win rate is in worse shape than a team with 2.5x coverage, a 40-day cycle, and a 31% win rate. Velocity is the metric that catches this. It is also the only common pipeline metric that responds to all four levers a sales leader actually controls, which is why HubSpot and most modern RevOps playbooks treat it as a board-level number rather than a rep-level one.
How do you calculate pipeline velocity?#
The formula is:
Pipeline Velocity = (Opportunities × Average Deal Value × Win Rate) ÷ Sales Cycle Length in Days
Four inputs, and every one of them has a definition problem waiting to happen. Here is how to pull each without corrupting the result:
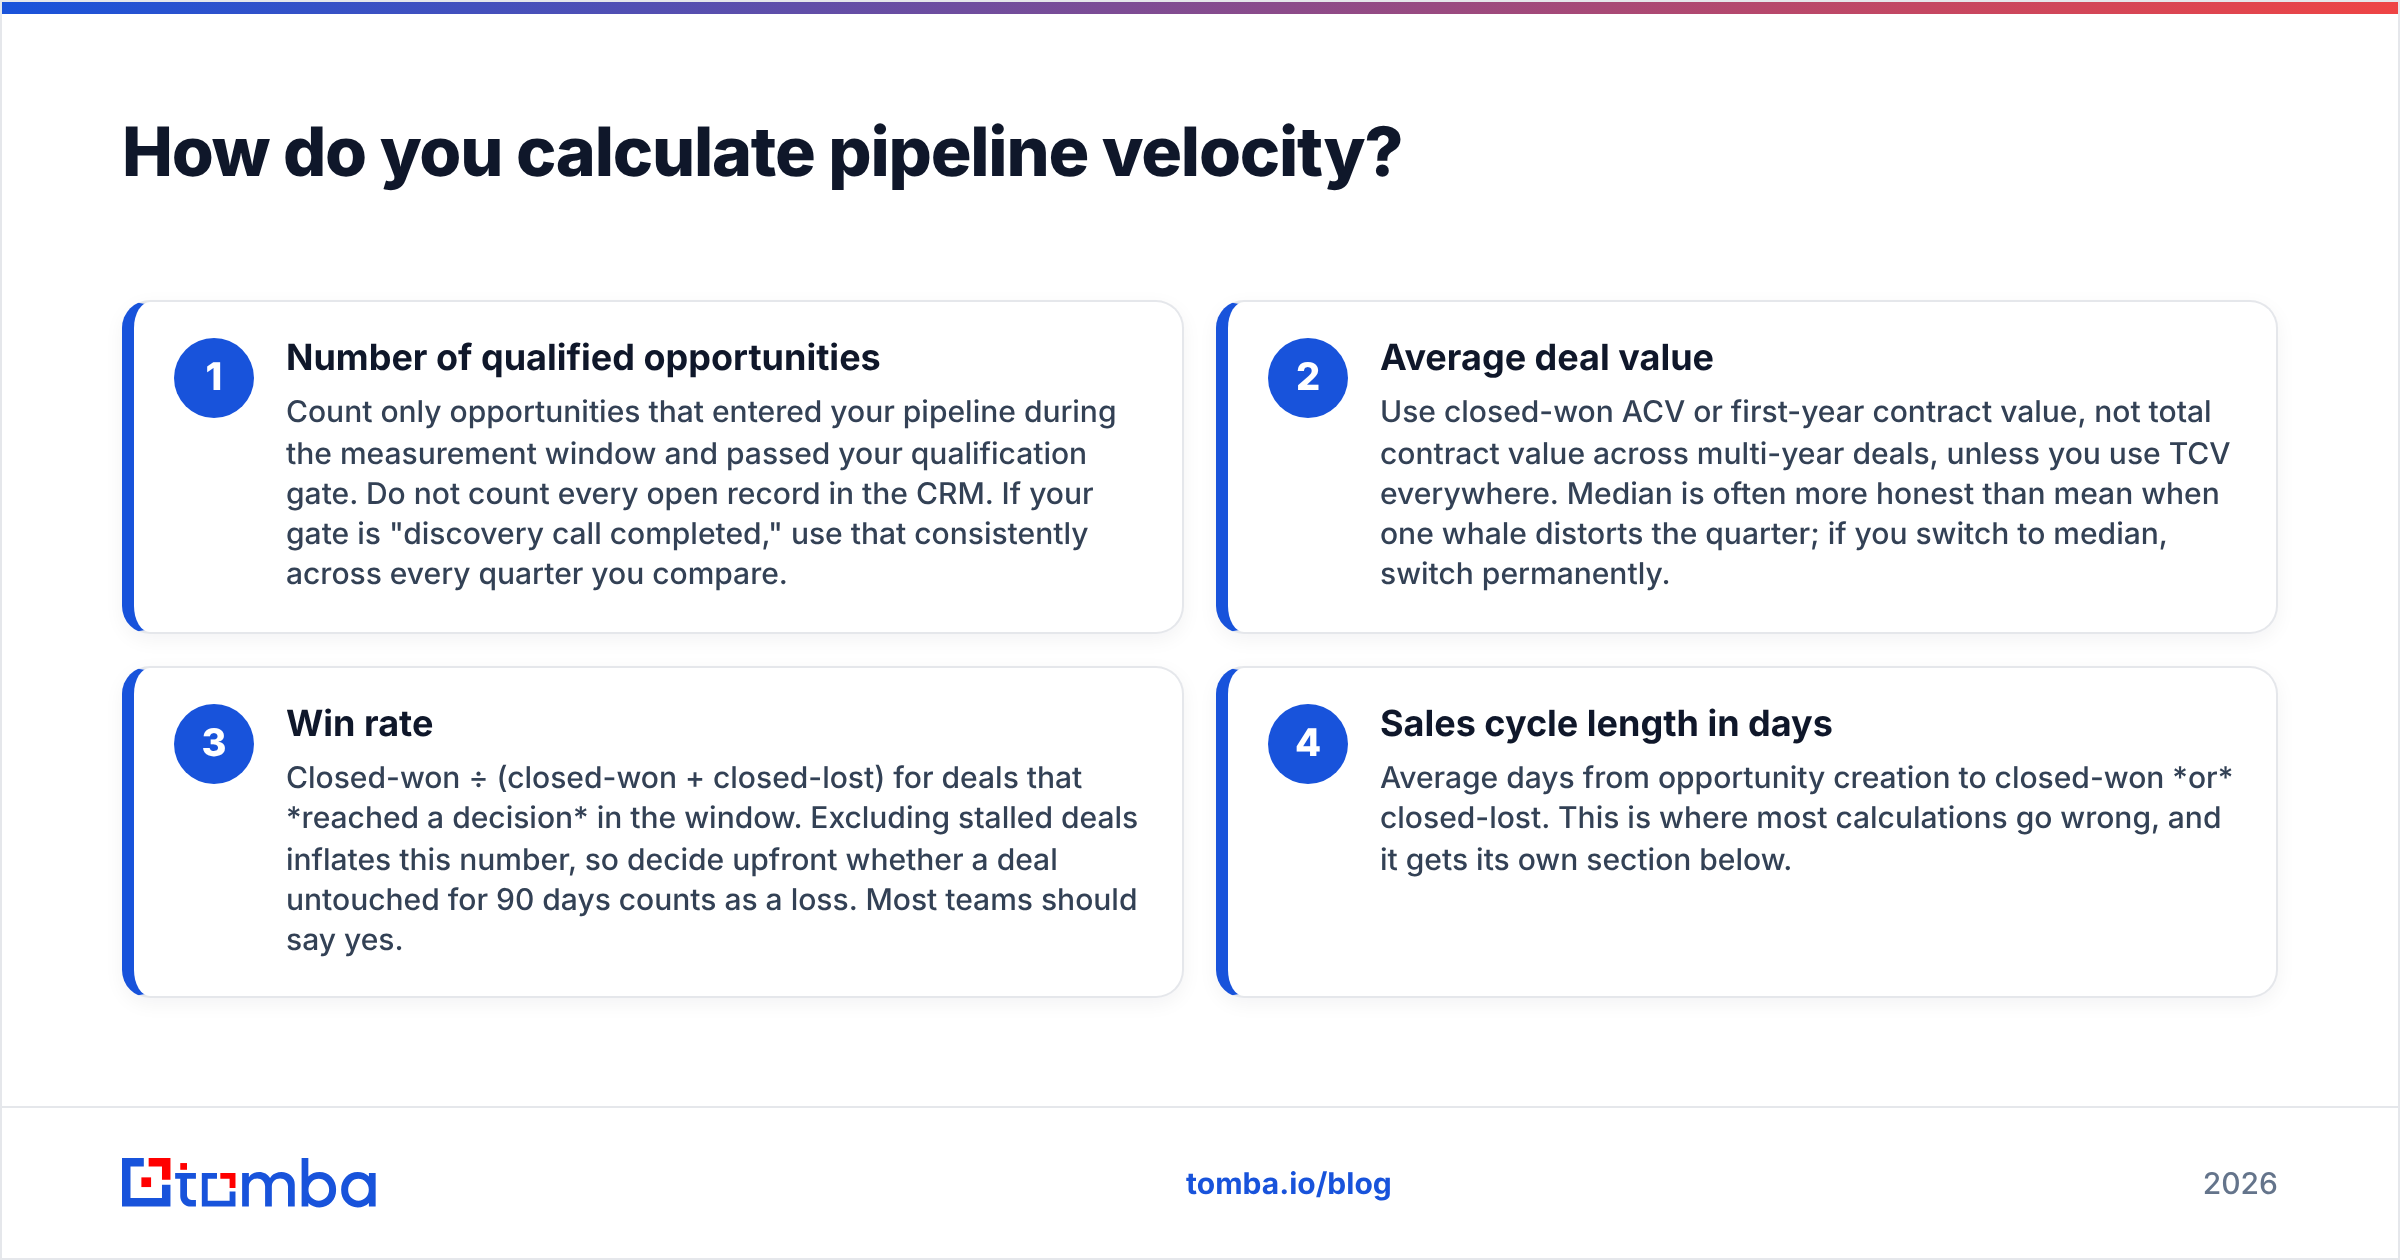
Number of qualified opportunities — Count only opportunities that entered your pipeline during the measurement window and passed your qualification gate. Do not count every open record in the CRM. If your gate is "discovery call completed," use that consistently across every quarter you compare.
Average deal value — Use closed-won ACV or first-year contract value, not total contract value across multi-year deals, unless you use TCV everywhere. Median is often more honest than mean when one whale distorts the quarter; if you switch to median, switch permanently.
Win rate — Closed-won ÷ (closed-won + closed-lost) for deals that reached a decision in the window. Excluding stalled deals inflates this number, so decide upfront whether a deal untouched for 90 days counts as a loss. Most teams should say yes.
Sales cycle length in days — Average days from opportunity creation to closed-won or closed-lost. This is where most calculations go wrong, and it gets its own section below.
Run the arithmetic and you get a dollars-per-day figure. Multiply by 90 to get a quarterly run rate you can hold against quota.

What does a pipeline velocity calculation look like in practice?#
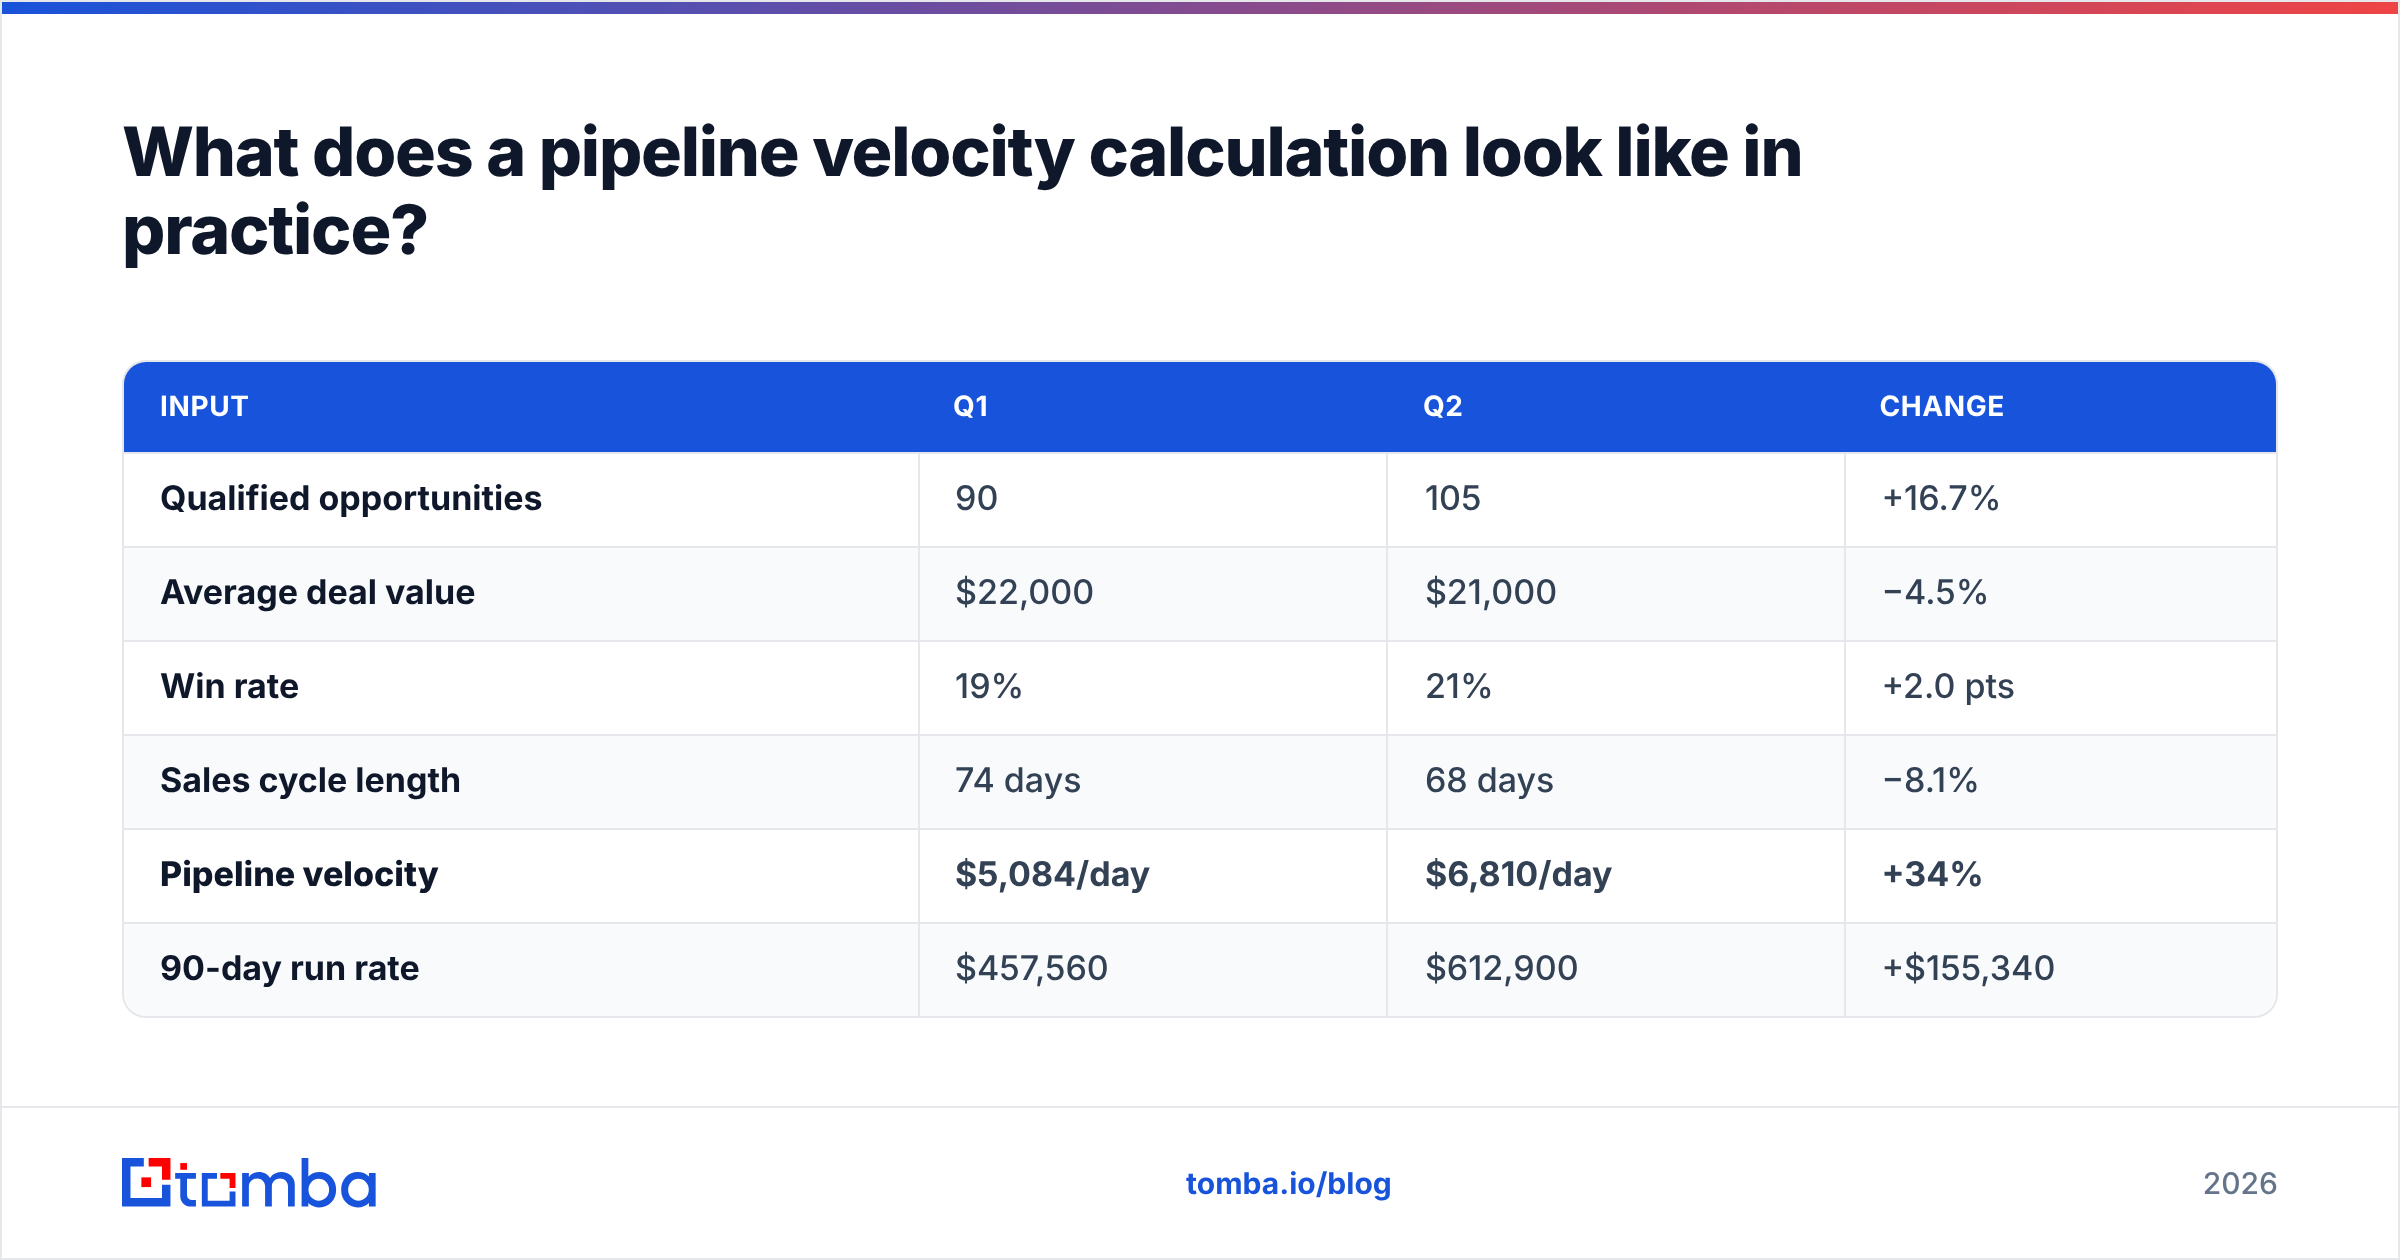
Take a mid-market SaaS team. In Q1 they created 90 qualified opportunities, averaged $22,000 per closed deal, won 19% of decided deals, and took 74 days on average to reach a decision.
90 × $22,000 × 0.19 = $376,200. Divide by 74 days = $5,084 per day.
In Q2, the same team tightened qualification, launched a shorter security review path, and cleaned up their contact data. Results: 105 opportunities, $21,000 average deal value, 21% win rate, 68-day cycle.
105 × $21,000 × 0.21 = $463,050. Divide by 68 = $6,810 per day.
| Input | Q1 | Q2 | Change |
|---|---|---|---|
| Qualified opportunities | 90 | 105 | +16.7% |
| Average deal value | $22,000 | $21,000 | −4.5% |
| Win rate | 19% | 21% | +2.0 pts |
| Sales cycle length | 74 days | 68 days | −8.1% |
| Pipeline velocity | $5,084/day | $6,810/day | +34% |
| 90-day run rate | $457,560 | $612,900 | +$155,340 |
Notice that average deal value went down and velocity still jumped 34%. This is the whole point of the metric: it stops you from optimizing one input at the expense of the system. A team chasing bigger logos would have called Q2 a regression. Velocity called it a 34% improvement, and the run rate confirms it.
Which lever moves pipeline velocity fastest?#
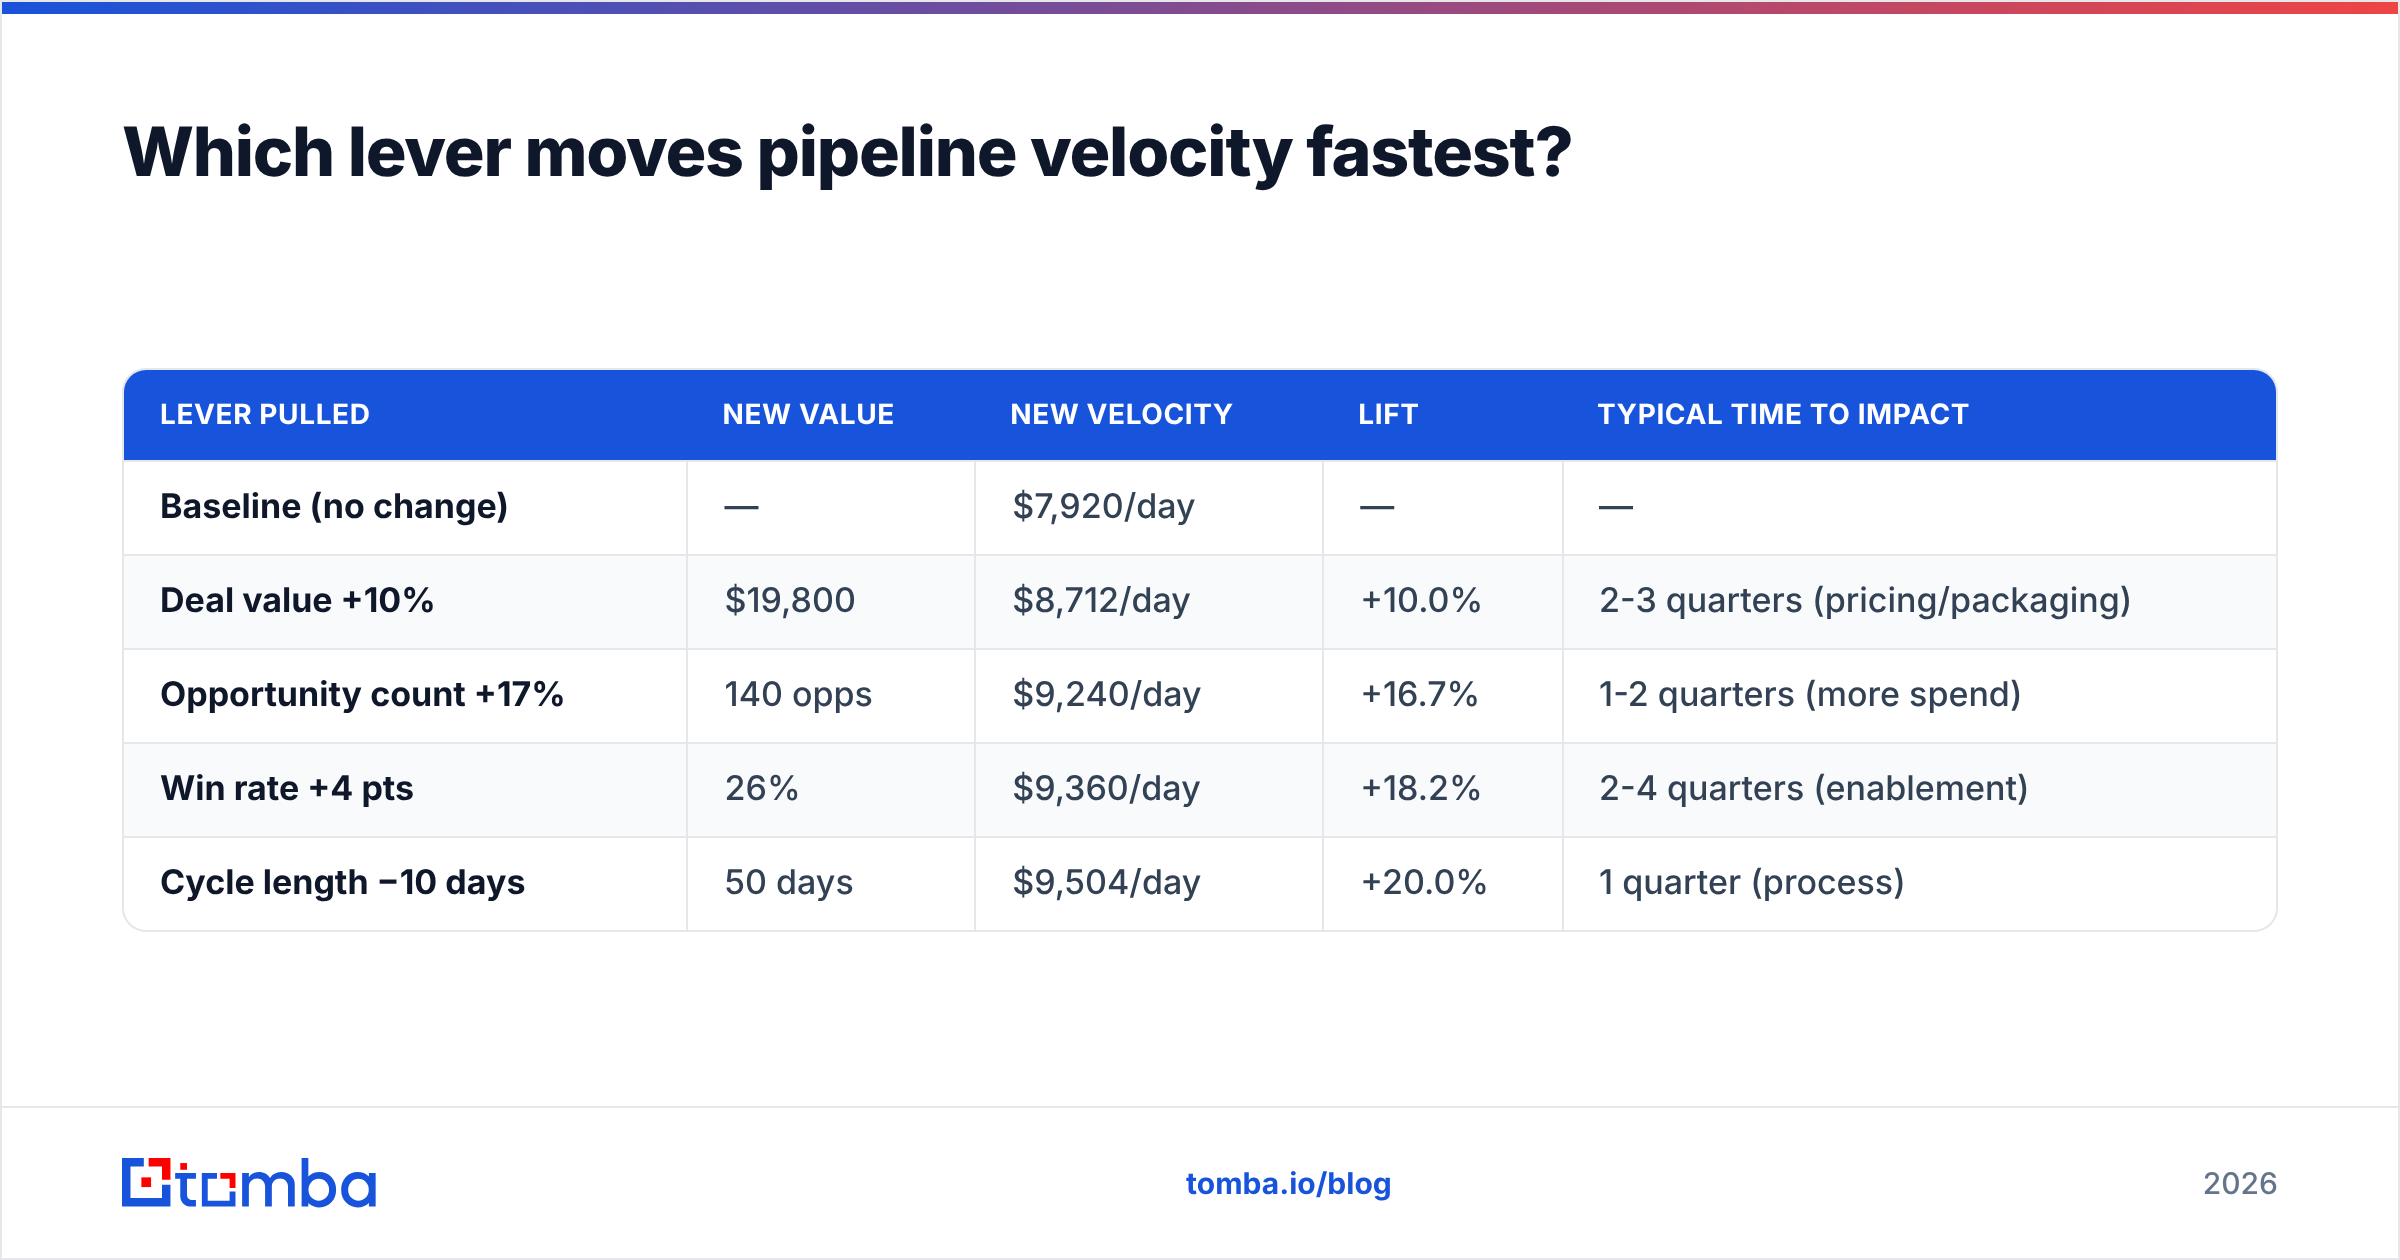
Start from a baseline: 120 opportunities, $18,000 average deal, 22% win rate, 60-day cycle. That is 120 × $18,000 × 0.22 = $475,200 ÷ 60 = $7,920 per day.
Now improve exactly one input at a time and hold the rest constant:
| Lever pulled | New value | New velocity | Lift | Typical time to impact |
|---|---|---|---|---|
| Baseline (no change) | — | $7,920/day | — | — |
| Deal value +10% | $19,800 | $8,712/day | +10.0% | 2-3 quarters (pricing/packaging) |
| Opportunity count +17% | 140 opps | $9,240/day | +16.7% | 1-2 quarters (more spend) |
| Win rate +4 pts | 26% | $9,360/day | +18.2% | 2-4 quarters (enablement) |
| Cycle length −10 days | 50 days | $9,504/day | +20.0% | 1 quarter (process) |
Two things fall out of this table.
First, cycle length is the only input in the denominator, so it produces non-linear returns. Cutting days is mathematically more powerful than adding deals, and it usually costs less — no extra headcount, no extra ad spend, just removing steps from a process nobody has audited in two years.
Second, opportunity count is the input teams reflexively attack first, and it is the second-weakest lever. Worse, it is the only lever with a built-in backfire: adding low-quality opportunities raises the numerator while dragging down win rate and stretching cycle length. Net effect is often negative. Gartner's sales research has been making a version of this argument for years — volume without qualification discipline destroys velocity rather than building it.
Why does the sales cycle length input break most calculations?#
Because almost every CRM report defaults to averaging closed-won deals only.
That default quietly removes your slowest, ugliest deals from the denominator — the ones that spent 200 days in "Negotiation" before dying. Your reported cycle length shrinks, your velocity looks great, and nothing in reality changed. It is the sales-metrics equivalent of measuring your commute time only on days you catch every green light.
Fix it with three rules:
- Include closed-lost. A decision is a decision. Losses that took 190 days tell you more about your process than wins that took 40.
- Set a stall threshold. Any opportunity with no meaningful activity for 60 or 90 days gets auto-marked closed-lost. Without this, your "open pipeline" fills with zombies that never enter the cycle-length math because they never close.
- Measure from a fixed start event. Opportunity creation date is the usual choice. Some teams prefer first meeting held. Either works; switching mid-year does not.
The related trap is the stage-definition drift. If your team redefined "Qualified" in March, your Q1 and Q2 velocity numbers are not comparable and no amount of arithmetic fixes it. Freeze definitions for at least four quarters before you draw trend lines. Salesforce's own guidance on pipeline management makes the same point: the stage exit criteria matter more than the stage names.

How often should you calculate pipeline velocity?#
Monthly for the trend, quarterly for decisions.
Weekly calculation is noise. With a 60-day cycle, a single week contains too few closed decisions to move win rate or cycle length meaningfully, so you end up reacting to sampling error. Teams that report velocity weekly tend to start gaming the inputs — sandbagging opportunity creation to protect the ratio, which is precisely the behavior the metric exists to prevent.
Segment it, though. One blended company-wide velocity number is nearly useless for action. Calculate it separately for:
- Each segment (SMB, mid-market, enterprise) — a 40-day SMB cycle and a 180-day enterprise cycle averaged together describe a company that does not exist.
- Each lead source — inbound demo requests, outbound cold email, partner referrals, and event leads have structurally different velocities. This is the single most actionable cut, because it tells you where to move budget.
- Each rep cohort — ramped versus ramping. Mixing them makes ramp problems look like process problems.
- Each product line — if you sell a $5K starter and a $90K platform, blending them hides both.
Once segmented, the interesting comparison is not "is our velocity up?" but "which source produces the most dollars per day per dollar of acquisition cost?" That question has a defensible answer, and it changes budget allocation. If you are formalizing this, it belongs in your standing revenue operations reporting rather than a one-off spreadsheet.
What are the most common pipeline velocity mistakes?#
Counting unqualified opportunities. If a rep can create an opportunity from a downloaded ebook, your opportunity count is a lead count wearing a costume. Velocity inflates, then collapses when those deals fail to close.
Using total pipeline value instead of average deal value. The formula wants an average per deal, not the sum. Substituting total pipeline value multiplies your result by the opportunity count twice and produces a number in the hundreds of thousands per day. If your velocity looks absurd, check this first.
Mixing time windows. Pulling opportunity count from the current open pipeline while pulling win rate from the trailing twelve months is the most common silent error. Every input comes from the same window.
Ignoring the denominator's tail. A handful of 300-day deals can drag the average cycle length up 20%. Report median alongside mean and investigate the gap rather than deleting outliers.
Treating velocity as a rep scorecard. It is a system metric. Reps control effort and skill; they do not control pricing, security review length, or lead source mix. Using velocity for individual comp creates exactly the gaming behavior you do not want.
How does lead data quality affect pipeline velocity?#
It hits three of the four inputs at once, which is why data quality shows up in velocity faster than in almost any other metric.
Bad contact data inflates opportunity count with records that were never reachable. It suppresses win rate, because deals worked against the wrong contact rarely close. And it stretches cycle length, since every week spent chasing a bounced address or a contact who left the company 14 months ago is a week added to the denominator. Three inputs moving the wrong direction simultaneously is how a team runs a "successful" prospecting quarter and watches velocity fall.
The practical fix is unglamorous. Verify contacts before they enter sequence, not after they bounce. Enrich the account record with a current decision-maker rather than routing to a generic info@ address. Deduplicate before import so one buying committee does not become four opportunities.
A quick audit worth running this week: pull every opportunity created last quarter that died without a single reply from the primary contact. Check how many of those email addresses are still valid. If more than 10% fail an email verifier check, you have a data problem that is being mistaken for a messaging problem — and no amount of sequence rewriting will fix it. Running the same list through bulk verification before the next quarter starts is usually the cheapest velocity improvement available to you.
The same logic applies upstream. If your outbound motion is guessing at email patterns, you are manufacturing opportunities that inflate the numerator and poison the denominator. Sourcing verified contacts at the top of the funnel is a velocity intervention disguised as a prospecting one.
Where should you start?#
Calculate your baseline this week using trailing-quarter data and honest definitions. Segment it by lead source. Then pick the denominator — sales cycle length — as your first target, because it is the only input where process changes produce results inside a single quarter.
If your audit shows contact quality is what is stretching that cycle, fix the input before you redesign the process. The Tomba Email Finder returns verified professional email addresses by domain, name, or company, with confidence scoring and source attribution on every result — so opportunities enter your pipeline attached to a reachable human instead of a guess. The free tier covers 25 searches a month if you want to test it against a sample of last quarter's dead deals; paid plans start at $49/mo, and you can see the full breakdown on the Tomba pricing page. Clean the input, and the velocity math starts describing a pipeline that actually exists.
Related guides#
Ready to find emails that actually work?
Join 150,000+ professionals who stopped guessing and started sending. Free credits on signup — no credit card required.
Get the Tomba newsletter
Practical outbound tactics and product updates — once every two weeks.
About the author