How to Create a Sales Forecast: A Step-by-Step 2026 Guide
Most sales forecasts miss because the pipeline data feeding them is stale. Here is a step-by-step method to build a forecast that holds up in a board meeting.
TL;DR
- A sales forecast is a math model, not a mood. It needs three inputs: clean pipeline data, honest stage definitions, and a historical conversion baseline.
- Pick your method by data maturity: opportunity-stage forecasting if your CRM is trustworthy, historical/run-rate if it is not, and a weighted blend once you have 4+ quarters of closed-won history.
- Forecast accuracy dies at the data layer. Bounced contacts, duplicate accounts, and dead champions inflate pipeline value long before the model ever runs.
- Set a cadence — weekly rep-level roll-up, monthly manager commit, quarterly board number — and track forecast variance as its own KPI.
- Target ±10% variance on the commit number. Anything above ±20% means your stage definitions are fiction.
What is a sales forecast, and why do most of them fail?#
A sales forecast is your best estimate of how much revenue will close in a defined period, based on the deals currently in play plus what your team will realistically create and close inside that window.
Think of it like a weather forecast for a farm. You are not predicting exactly which minute it rains. You are giving the operations team enough confidence to decide whether to plant, hire, or hold cash. A forecast that is wrong by 40% is not a forecast — it is a wish with a spreadsheet attached.
Most forecasts fail for three boring reasons:
- Stage definitions are subjective. "Stage 3 – Proposal" means one thing to your best rep and something completely different to the rep who is behind quota and needs pipeline optics.
- The pipeline data is stale. Deals sit in stage for 90 days. Champions leave. Contact records bounce. Nobody scrubs.
- The model has no feedback loop. Teams forecast, miss, and then forecast again the same way next quarter without ever measuring variance.
Fix those three and you are ahead of most B2B sales orgs. According to Gartner's sales research, forecast reliability is consistently among the top-cited pain points for CROs — and the root cause is almost always process discipline, not modeling sophistication.

What data do you need before you forecast anything?#
You cannot model revenue on top of a dirty database. Before you build the forecast, audit these five inputs.
- Closed-won history — at minimum 4 quarters, ideally 8. This is your conversion baseline. Without it you are guessing at win rates.
- Stage-by-stage conversion rates — what percentage of Stage 2 deals reach Stage 3, Stage 3 to Stage 4, and so on. Calculate this from actual history, not from what the CRM default probabilities say.
- Average sales cycle length by segment — SMB deals closing in 21 days and enterprise deals closing in 180 days cannot share a forecast model.
- Average deal size (ACV) by source — inbound demo requests and cold outbound deals rarely have the same value or velocity.
- Contactable pipeline — the percentage of open opportunities where you actually have a valid, reachable decision-maker. This is the input nobody tracks and everybody should.
That last one deserves emphasis. If 22% of the contacts attached to your open opportunities are undeliverable, you are forecasting on deals nobody can advance. Running your opportunity contacts through an email verifier before a quarterly forecast review is a ten-minute job that routinely removes 10-20% of phantom pipeline. The same applies at the top of funnel — pipeline you build with a reliable email finder converts at a different rate than pipeline scraped from a list you bought in 2023, and your model should treat them as separate cohorts.
How do you create a sales forecast step by step?#
Here is the sequence. Do these in order; skipping step 2 is the most common failure mode.
Step 1 — Define the forecast period and the unit. Monthly for velocity businesses, quarterly for enterprise. Forecast in closed-won revenue (or ARR), not in "pipeline generated." Mixing units is how boards get surprised.
Step 2 — Clean and lock your stage definitions. Every stage needs an objective exit criterion that a third party could verify. "Prospect is interested" is not a criterion. "Prospect has confirmed budget owner and a target implementation date in writing" is. Write them down. Publish them. Audit against them.
Step 3 — Pull your historical conversion baseline. For each stage, calculate: (deals that reached the next stage) ÷ (deals that entered this stage), over your lookback window. These are your real probabilities. They will be lower than the CRM defaults. That is the point.
Step 4 — Apply the model to open pipeline. Multiply each open deal's value by its stage's historical conversion-to-close rate. Sum it. That is your weighted pipeline number.
Step 5 — Adjust for time. A deal in Stage 3 with a close date 8 days out and an average Stage 3 sales cycle of 45 days is not closing this period. Filter or discount deals whose remaining cycle time exceeds the forecast window.
Step 6 — Layer in new business creation. Deals that do not exist yet will close inside a monthly window for fast-cycle businesses. Use your historical "created-and-closed in period" rate to add this back in.
Step 7 — Run three scenarios. Commit (deals you would bet your job on), Best Case (commit + upside), and Worst Case (commit minus your historical slip rate). Report all three. Never report one number.
Step 8 — Measure variance and iterate. After the period closes, compare forecast to actual at the rep, segment, and stage level. Whichever level shows the biggest gap is where next quarter's process work goes.
Which sales forecasting method should you use?#
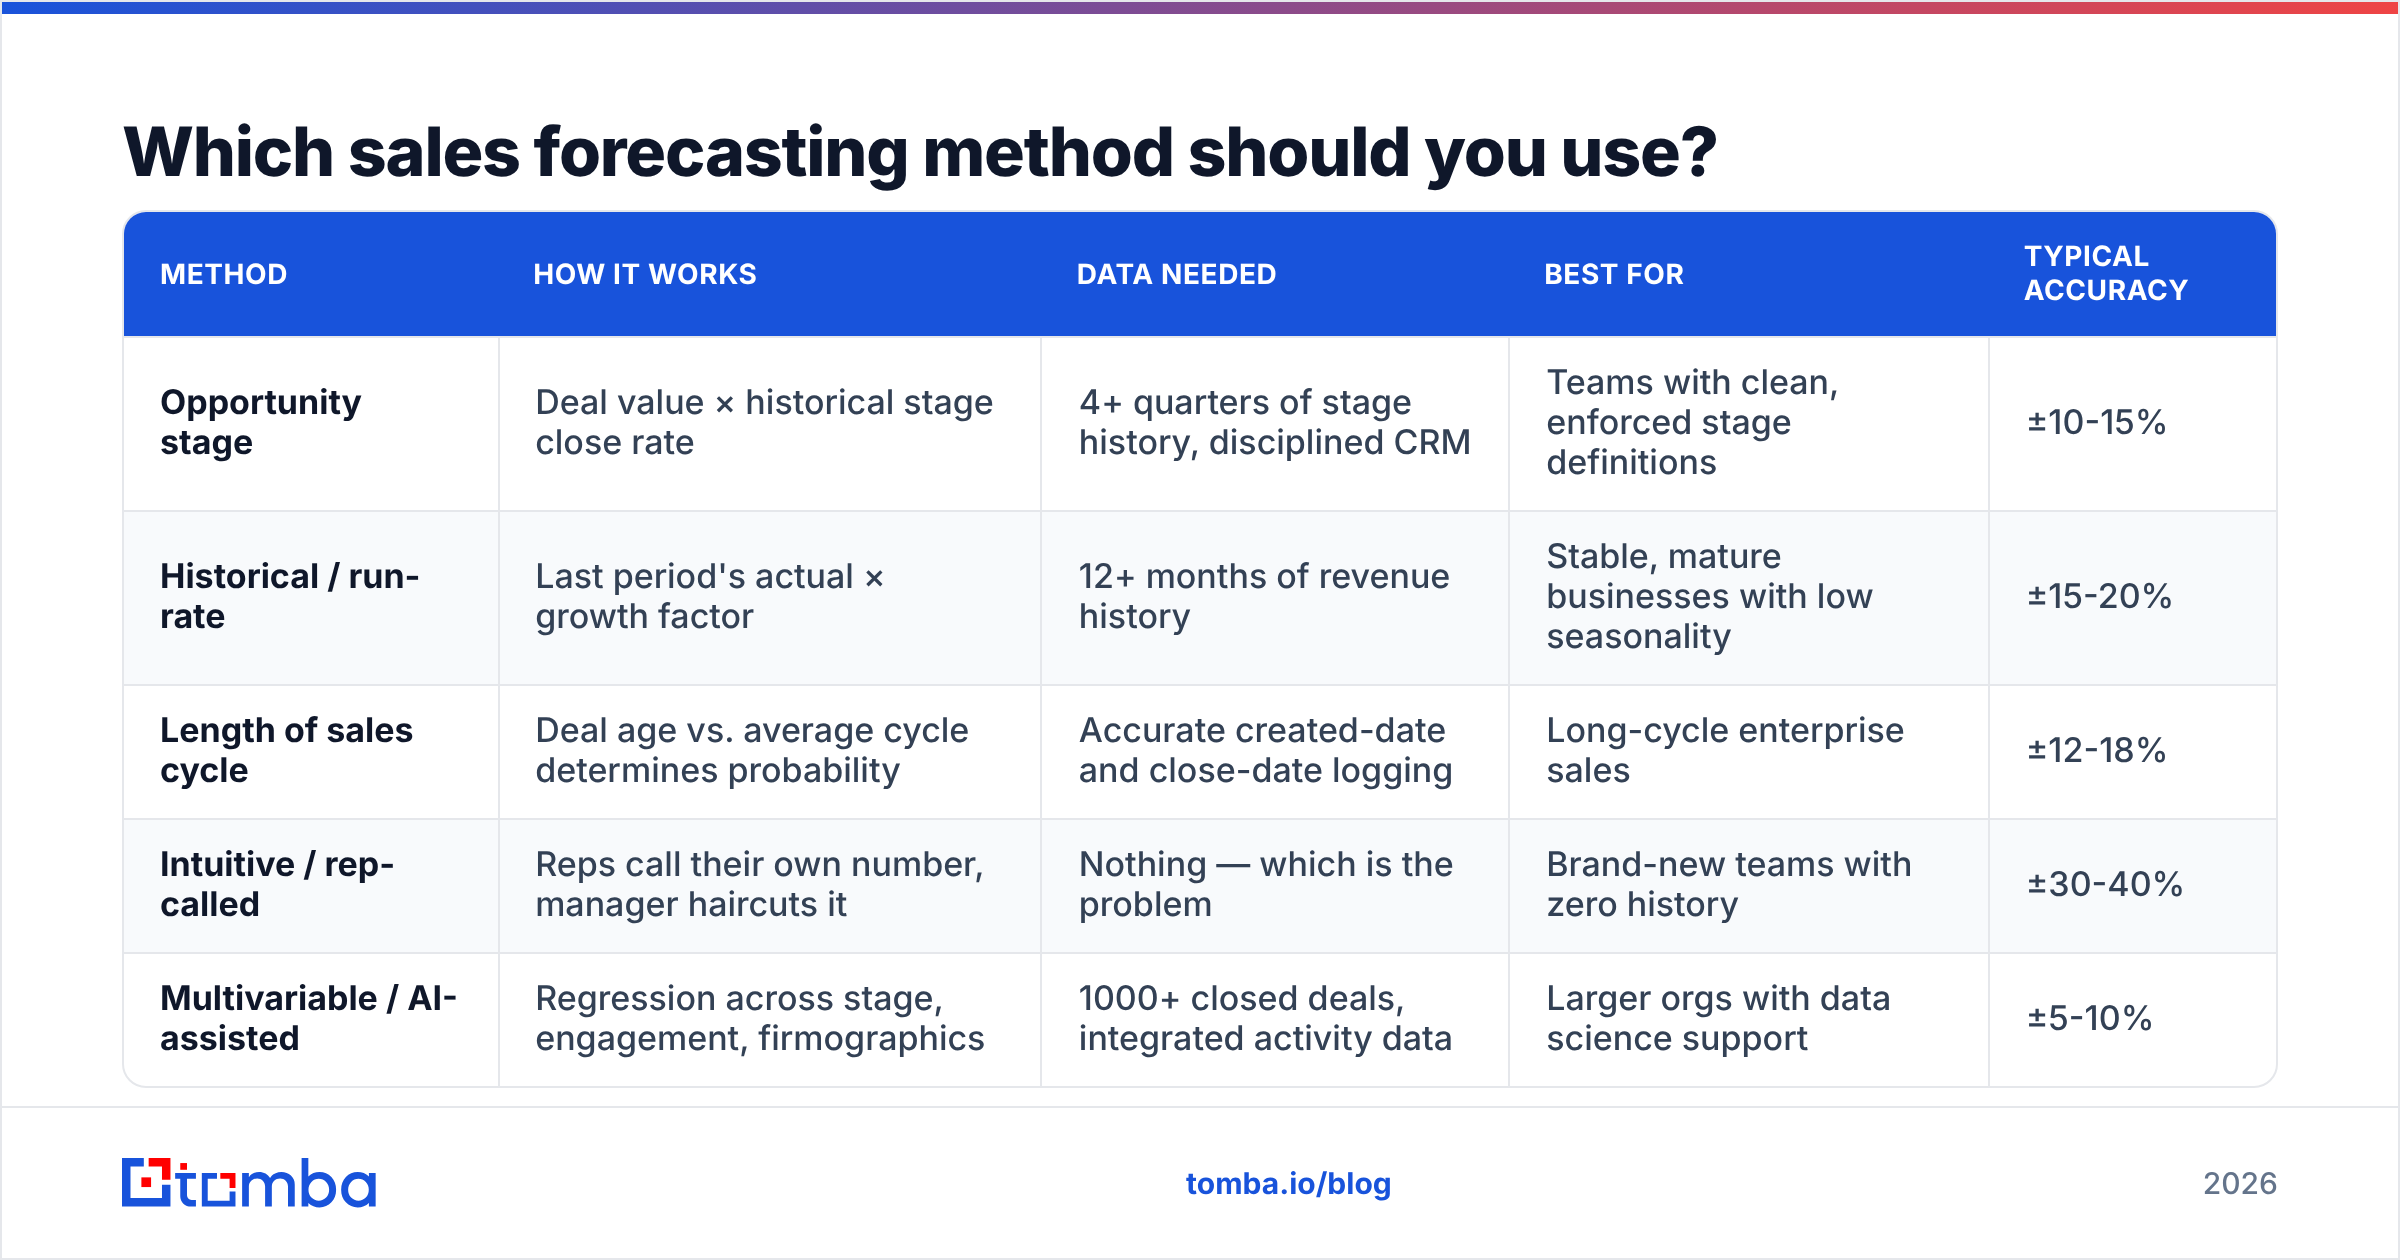
There are five methods worth knowing. Most teams should run two in parallel and triangulate.
| Method | How it works | Data needed | Best for | Typical accuracy |
|---|---|---|---|---|
| Opportunity stage | Deal value × historical stage close rate | 4+ quarters of stage history, disciplined CRM | Teams with clean, enforced stage definitions | ±10-15% |
| Historical / run-rate | Last period's actual × growth factor | 12+ months of revenue history | Stable, mature businesses with low seasonality | ±15-20% |
| Length of sales cycle | Deal age vs. average cycle determines probability | Accurate created-date and close-date logging | Long-cycle enterprise sales | ±12-18% |
| Intuitive / rep-called | Reps call their own number, manager haircuts it | Nothing — which is the problem | Brand-new teams with zero history | ±30-40% |
| Multivariable / AI-assisted | Regression across stage, engagement, firmographics | 1000+ closed deals, integrated activity data | Larger orgs with data science support | ±5-10% |
The honest answer for most B2B teams under 50 reps: run opportunity stage as your primary and historical run-rate as your sanity check. If those two numbers are more than 20% apart, something in your stage data is broken — go find it before you send the forecast anywhere.
The intuitive method gets unfairly maligned. Rep gut feel is genuinely useful as a modifier, not as a model. A rep saying "the champion went dark and legal hasn't opened the redlines" is signal your regression will not catch for another three weeks.
How do you keep your pipeline data clean enough to forecast?#
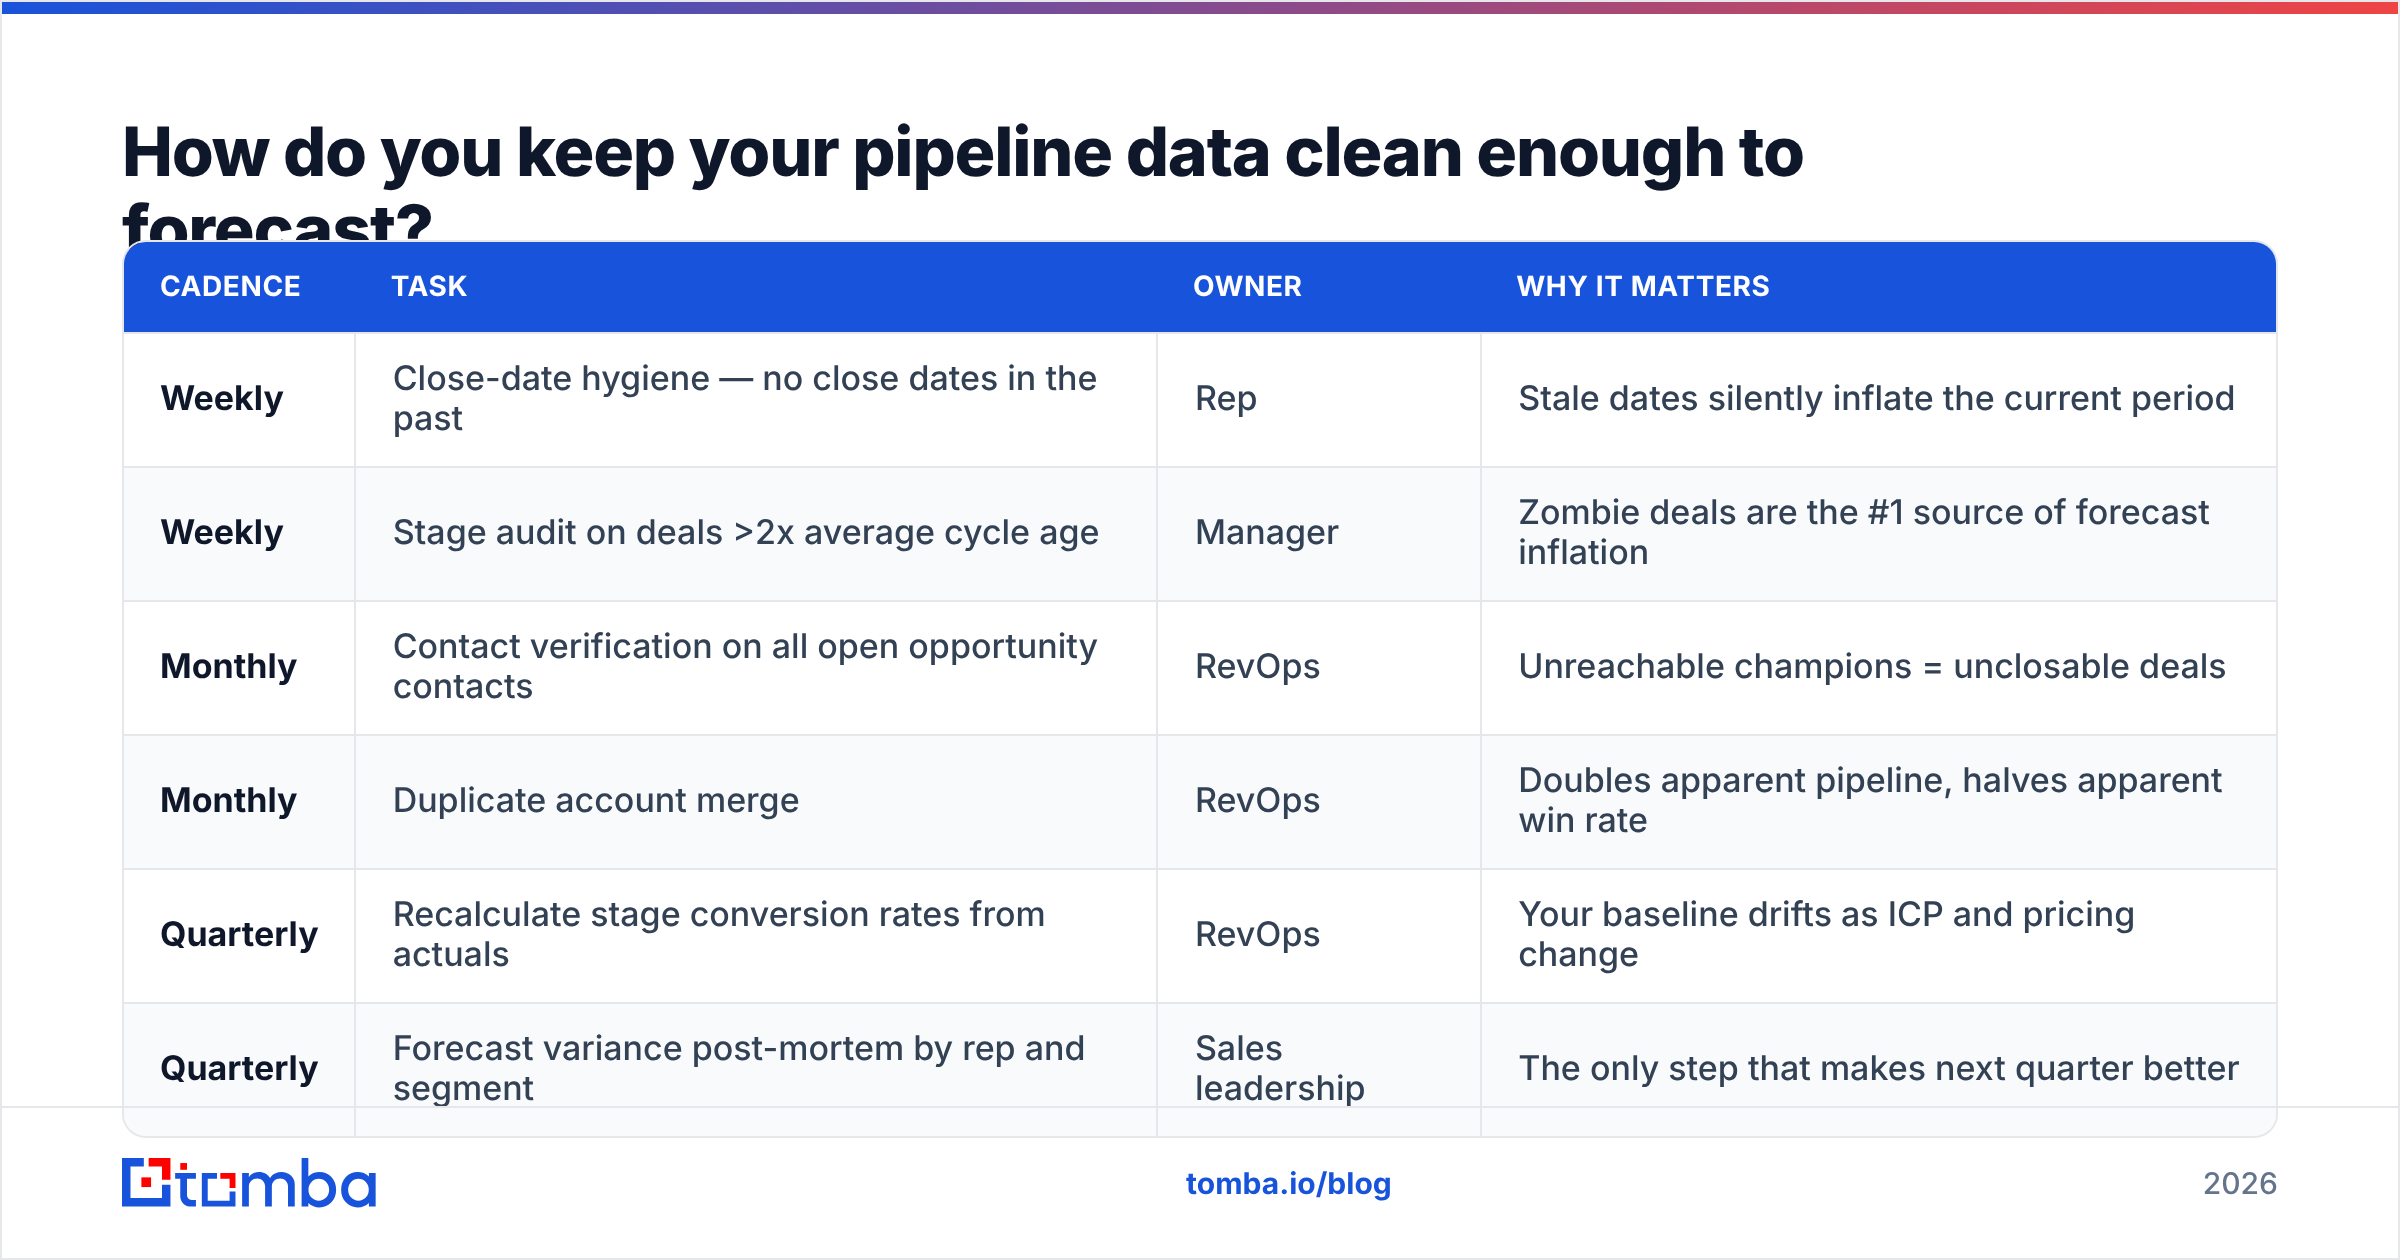
Forecast accuracy is downstream of data hygiene. Here is the maintenance loop that actually gets run in practice.
| Cadence | Task | Owner | Why it matters |
|---|---|---|---|
| Weekly | Close-date hygiene — no close dates in the past | Rep | Stale dates silently inflate the current period |
| Weekly | Stage audit on deals >2x average cycle age | Manager | Zombie deals are the #1 source of forecast inflation |
| Monthly | Contact verification on all open opportunity contacts | RevOps | Unreachable champions = unclosable deals |
| Monthly | Duplicate account merge | RevOps | Doubles apparent pipeline, halves apparent win rate |
| Quarterly | Recalculate stage conversion rates from actuals | RevOps | Your baseline drifts as ICP and pricing change |
| Quarterly | Forecast variance post-mortem by rep and segment | Sales leadership | The only step that makes next quarter better |
The monthly contact verification step is where most teams have the fastest win available. Enriching your open opportunities with current contact data — verified emails, direct dials, updated titles — tells you immediately which deals still have a live human on the other side. Tools like data enrichment and a phone finder let you refresh an opportunity list in bulk rather than one record at a time.
A practical trick: add a required field called "Last verified contact date" to your opportunity object. Any deal in your commit forecast with a verification date older than 30 days gets automatically demoted to best case. It is crude, and it works.
What does a good forecast actually look like in practice?#
Here is a worked example for a fictional 12-rep SaaS team forecasting a quarter.
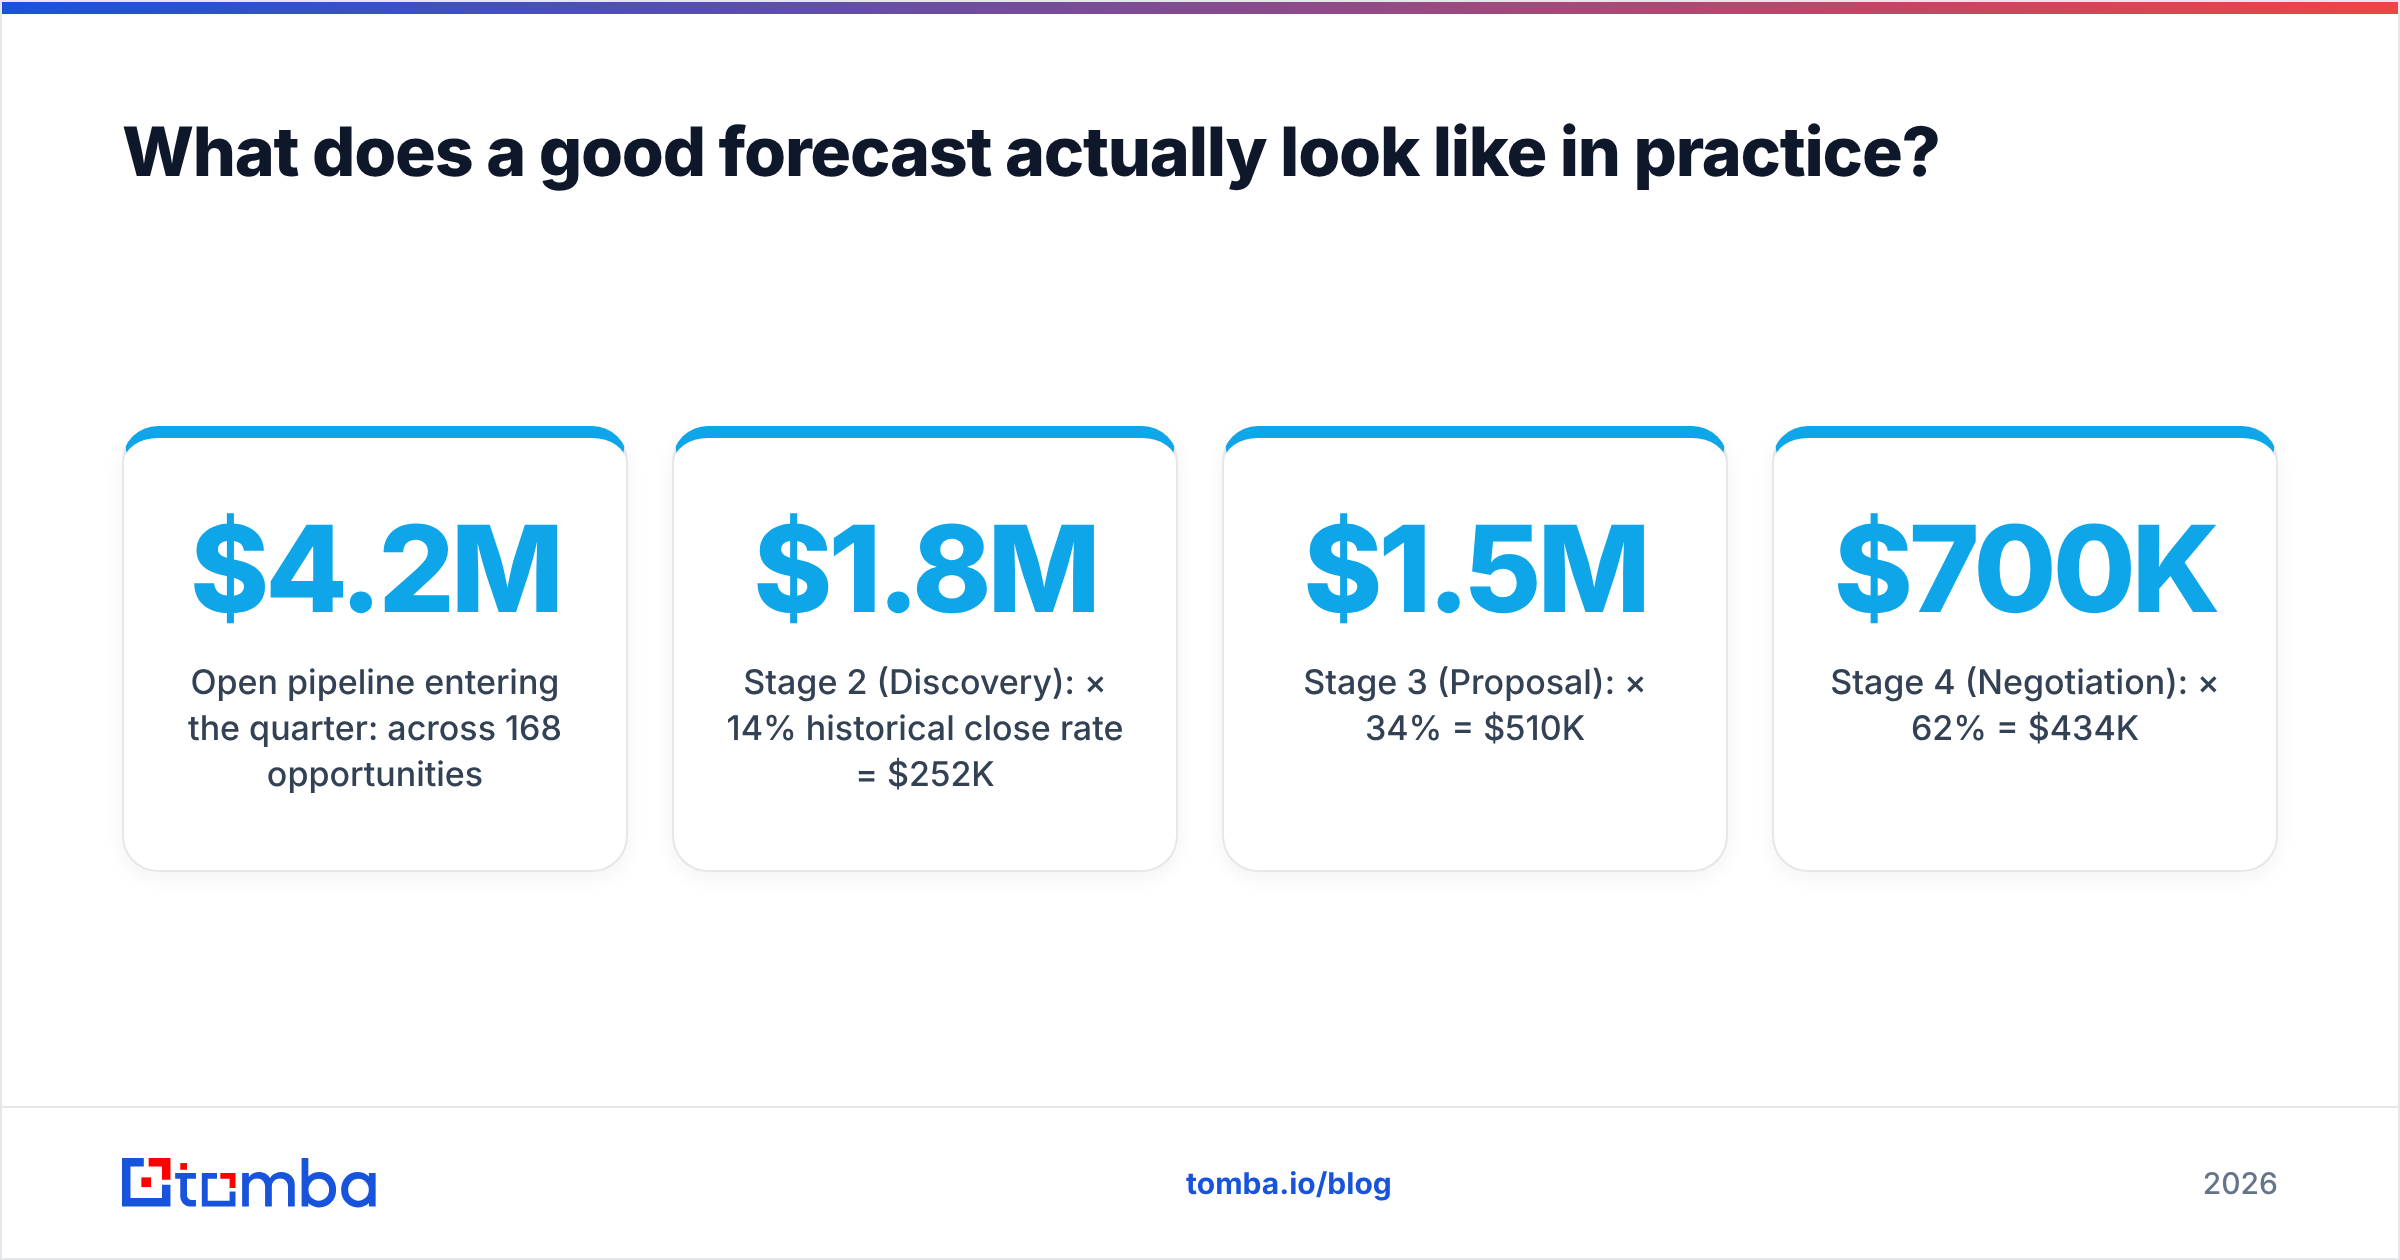
Open pipeline entering the quarter: $4.2M across 168 opportunities.
- Stage 2 (Discovery): $1.8M × 14% historical close rate = $252K
- Stage 3 (Proposal): $1.5M × 34% = $510K
- Stage 4 (Negotiation): $700K × 62% = $434K
- Stage 5 (Verbal/Legal): $200K × 88% = $176K
Weighted pipeline total: $1.372M
Now the adjustments:
- Remove 22 Stage 2 deals whose remaining cycle time exceeds the quarter: −$96K
- Add new-business creation (historical 9% of quarterly revenue closes from deals created in-quarter): +$135K
- Subtract verified-contact haircut (11 deals worth $310K have no verified decision-maker contact; discount 50%): −$155K
Commit: $1.256M. Best case: $1.51M. Worst case: $1.02M.
That spread — roughly ±20% around commit — is normal for a mid-market team in their first two quarters of disciplined forecasting. It should tighten to ±10% within a year as stage definitions harden.
Notice that the contact-verification haircut moved the number by $155K, more than 12% of the commit. That is not a rounding error. That is the difference between hitting and missing.
How do you present the forecast without losing credibility?#
Three rules.
Always give a range, never a point. A single number invites the question "will you hit it?" A range invites the question "what moves it?" — which is the conversation you want.
Show the delta from last week and explain it. "$1.256M, down $80K from last week because the Acme deal slipped to Q3 after their CFO transition" builds more trust than a flat number that mysteriously changes.
Report your own accuracy. Publish last quarter's forecast-vs-actual variance at the top of every forecast deck. Leaders who volunteer their miss rate get believed. Leaders who never mention it get audited.
For the mechanics of tightening the underlying process, HubSpot's sales forecasting resources and Salesforce's forecasting documentation both cover CRM-side configuration in more depth than we can here. And if you want to compare forecasting and revenue operations tooling by real user reviews rather than vendor claims, G2's sales analytics category is a reasonable starting point.
What are the most common sales forecasting mistakes?#
- Forecasting pipeline instead of revenue. Pipeline coverage of 3x is an input, not an output. Boards care about cash.
- Using CRM default probabilities. Salesforce ships with 10/25/50/75/90 defaults. Your actual stage conversion rates are almost never those numbers.
- One model for all segments. SMB and enterprise need separate models. So do inbound and outbound cohorts.
- Ignoring slip, only tracking loss. Deals that push to next quarter are not lost, but they wreck the current forecast just as thoroughly. Track slip rate separately.
- No penalty for sandbagging. If a rep who consistently forecasts low and beats it is celebrated identically to one who forecasts accurately, you are training your team to make your forecast useless.
- Skipping the contact-data layer. You cannot close a deal with a person who left the company. Verify before you commit.
How often should you rebuild the model itself?#
Refresh your conversion baselines quarterly and rebuild the model structure annually — or immediately after any of these events:
- A pricing change of more than 15%
- An ICP shift (new segment, new geography, new product line)
- A sales process redesign or stage restructure
- Sales team headcount changing by more than 30%
- A win-rate move of more than 5 percentage points in either direction
Each of those invalidates your historical baseline. Running last year's conversion rates against this year's ICP is the modeling equivalent of navigating with an old map.
Build the forecast on data that is actually reachable#
The single highest-leverage change most teams can make to forecast accuracy is not a better model — it is better contact data underneath the model. Every deal in your commit column needs a verified, reachable decision-maker attached to it, or it does not belong in commit.
Tomba Email Finder lets you find and verify professional email addresses by domain, name, or company, so you can refresh the contacts on your open opportunities before the forecast review instead of after the miss. Start on the free tier (25 searches/month) to test it against a sample of your pipeline, then scale up — Tomba pricing runs from $49/mo on Starter to $99/mo on Growth and $249/mo on Pro, with bulk and API access for RevOps teams who want verification wired directly into the CRM.
Clean the data. Then trust the number.
Related guides#
// get started
Find, verify and enrich your first contacts today
Start on the free plan with 25 searches a month, then scale when your team is ready.
Free plan · No credit card required · GDPR & CCPA
Get the Tomba newsletter
Product and data updates
// about the author