How To Forecast Sales Growth: A Practical 2026 Playbook
Most sales forecasts miss because they start with a spreadsheet instead of a pipeline model. Here are five forecasting methods, when each one works, and the data hygiene that keeps your numbers honest.
TL;DR
- A sales growth forecast is a model, not a guess: pick a method that matches your data volume, then hold it accountable with a documented error rate.
- Five methods cover almost every B2B team — historical run-rate, pipeline-weighted, stage-velocity, bottom-up capacity, and blended AI/regression. Most teams should run two in parallel.
- Forecast accuracy dies at the data layer. Stale contacts, duplicate accounts, and unverified emails inflate top-of-funnel numbers by 20-40% before any math happens.
- Track forecast error every period. If you can't state last quarter's variance percentage from memory, you don't have a forecast — you have a target.
- Start with pipeline-weighted forecasting if you have 90+ days of clean CRM history. Start with bottom-up capacity if you don't.
What does it actually mean to forecast sales growth?#
Forecasting sales growth means predicting the rate of change in your revenue over a future period — not just the absolute number. "We'll close $2.4M next quarter" is a revenue forecast. "We'll grow 18% quarter over quarter, driven by a 30% larger pipeline at flat conversion" is a growth forecast, and it's far more useful because it names the lever.
The distinction matters when you plan. A revenue number tells finance what to expect. A growth model tells you what to change: hire two more reps, raise conversion on stage 3, or fix the fact that half your outbound list bounces.
Every credible forecast has four inputs:
- Baseline — trailing 3-12 months of closed-won revenue, segmented by product, segment, and channel. Never forecast from a single blended average.
- Pipeline coverage — the ratio of open pipeline value to quota. Most B2B teams need 3-4x coverage to hit target; if yours is 1.8x, no model will save the quarter.
- Conversion assumptions — historical stage-to-stage rates, ideally by segment. This is where optimism hides.
- Capacity — ramped reps, working days, and realistic activity throughput. A forecast that assumes 100% rep capacity in a quarter with two holidays and one ramping hire is fiction.
Miss any one of these and your model has a blind spot. Miss capacity and you'll consistently overshoot in Q1 and Q3.

Which sales forecasting method should you use?#
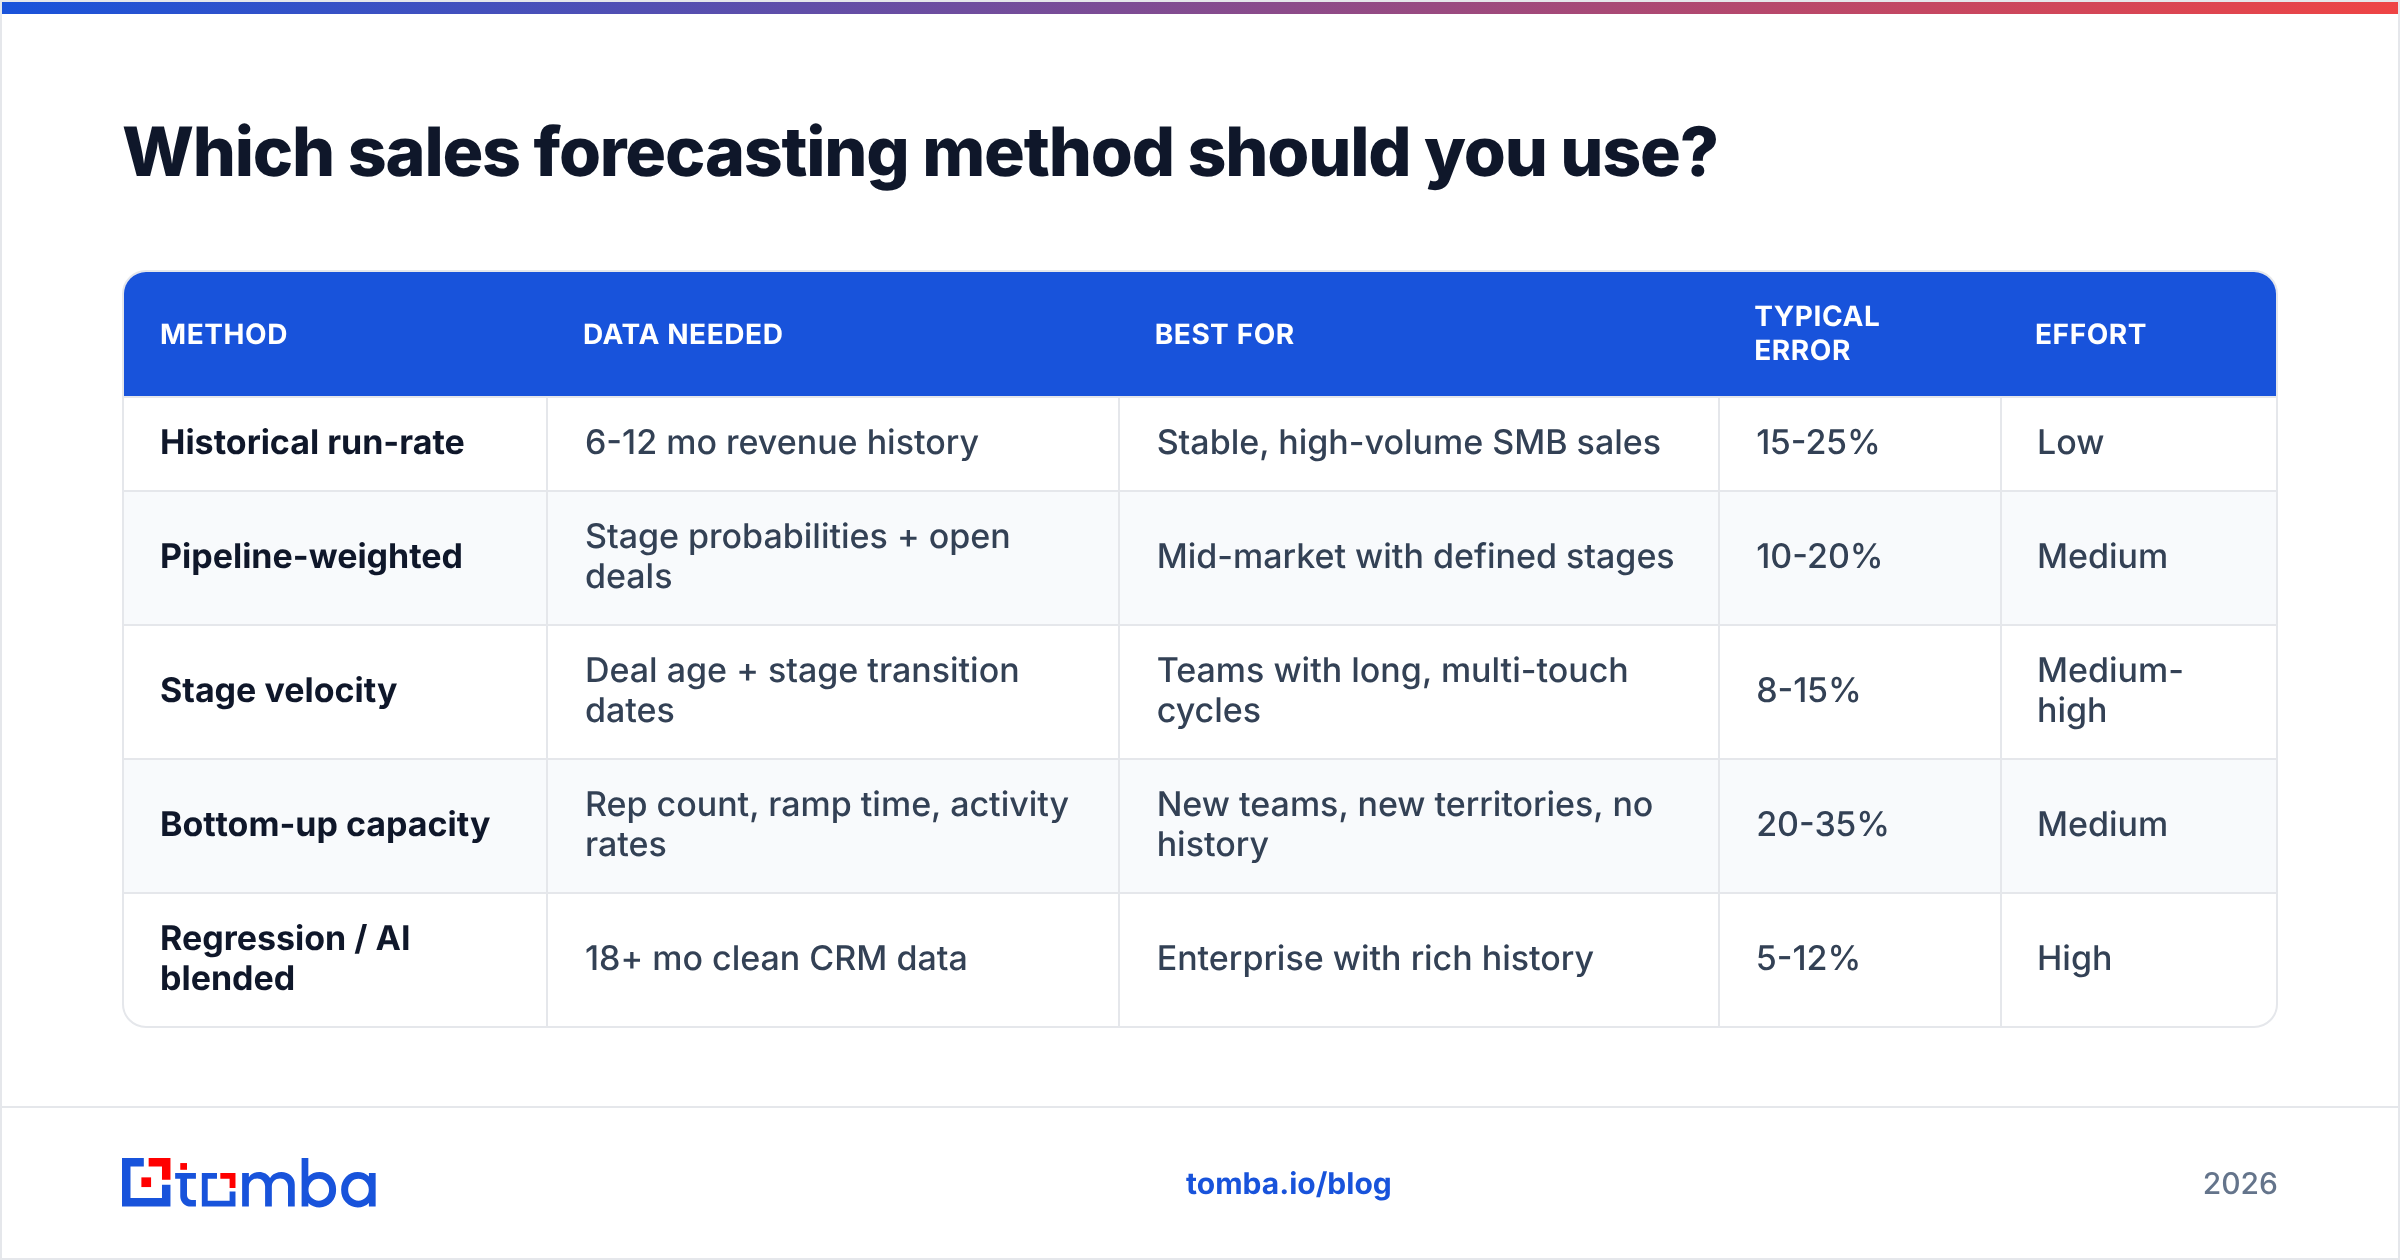
There is no universally best method. There's a best method for your data maturity and deal size. Here's how the five main approaches compare.
| Method | Data needed | Best for | Typical error | Effort |
|---|---|---|---|---|
| Historical run-rate | 6-12 mo revenue history | Stable, high-volume SMB sales | 15-25% | Low |
| Pipeline-weighted | Stage probabilities + open deals | Mid-market with defined stages | 10-20% | Medium |
| Stage velocity | Deal age + stage transition dates | Teams with long, multi-touch cycles | 8-15% | Medium-high |
| Bottom-up capacity | Rep count, ramp time, activity rates | New teams, new territories, no history | 20-35% | Medium |
| Regression / AI blended | 18+ mo clean CRM data | Enterprise with rich history | 5-12% | High |
A few honest caveats on that table. The error ranges assume clean data — garbage CRM hygiene pushes every row toward the top of its range. And "AI blended" is not magic: models like the forecasting features in HubSpot or Salesforce still learn from your stage probabilities, so they inherit your biases and just apply them faster.
The five methods in practice#
- Historical run-rate. Take trailing revenue, apply a growth coefficient from prior periods, adjust for seasonality. Fast and surprisingly hard to beat for transactional sales under $10K ACV. Weak the moment you change pricing, ICP, or headcount.
- Pipeline-weighted. Multiply each open deal by its stage probability and sum. The default in most CRMs. Its fatal flaw is that stage probabilities are usually set once and never recalibrated against actual close rates — audit yours every two quarters.
- Stage velocity. Instead of static probabilities, use how long deals actually sit in each stage and how many advance. Deals stuck 3x longer than median in stage 2 get discounted hard. This catches the "zombie pipeline" problem that weighted forecasting misses entirely.
- Bottom-up capacity. Start from activity: X reps × Y meetings/week × Z close rate × average deal size. The only method that works for a brand-new team, and the best sanity check on any top-down number.
- Regression / AI blended. Fit a model against historical features — lead source, company size, engagement, rep, cycle length. Powerful with 18+ months of clean data, dangerous without it.
How do you build a pipeline-weighted forecast step by step?#
Assume you're forecasting next quarter and you have 12 months of CRM history.
Step 1 — Clean the pipeline first. Close out every deal with no activity in 60 days. If half your open pipeline hasn't been touched since March, your coverage ratio is a lie. This single step usually moves the forecast more than any modeling choice.
Step 2 — Recalculate real stage probabilities. Pull every deal that entered each stage in the last four quarters and calculate what percentage actually closed won. Compare to the probabilities configured in your CRM. On most teams the configured number for late stages is 15-25 points optimistic.
Step 3 — Segment before you sum. Enterprise deals and SMB deals converge at different rates. A blended 22% close rate applied to both will overstate enterprise and understate SMB. Build separate weighted forecasts per segment and add them.
Step 4 — Apply a cycle-length filter. Any deal whose expected close date is sooner than your median cycle length from its current stage should be flagged. Reps are optimistic about dates; the data is not.
Step 5 — Add new-business creation. Weighted pipeline only covers deals that exist today. For a full-quarter forecast you need to model deals that haven't been created yet: (expected new opportunities per month) × (early-stage conversion) × (average deal size) × (portion closing in-period).
Step 6 — Publish a range, not a point. Commit / best case / worst case. A single number invites false precision and makes it impossible to tell a good forecast from a lucky one.
Step 5 is where most forecasts break, because new-business creation depends on how much qualified contact data your team can actually reach. Which brings us to the part nobody puts in the model.
Why does bad contact data wreck your growth forecast?#
Because every forecast that includes new pipeline is implicitly forecasting your outbound throughput — and outbound throughput is capped by data quality, not effort.
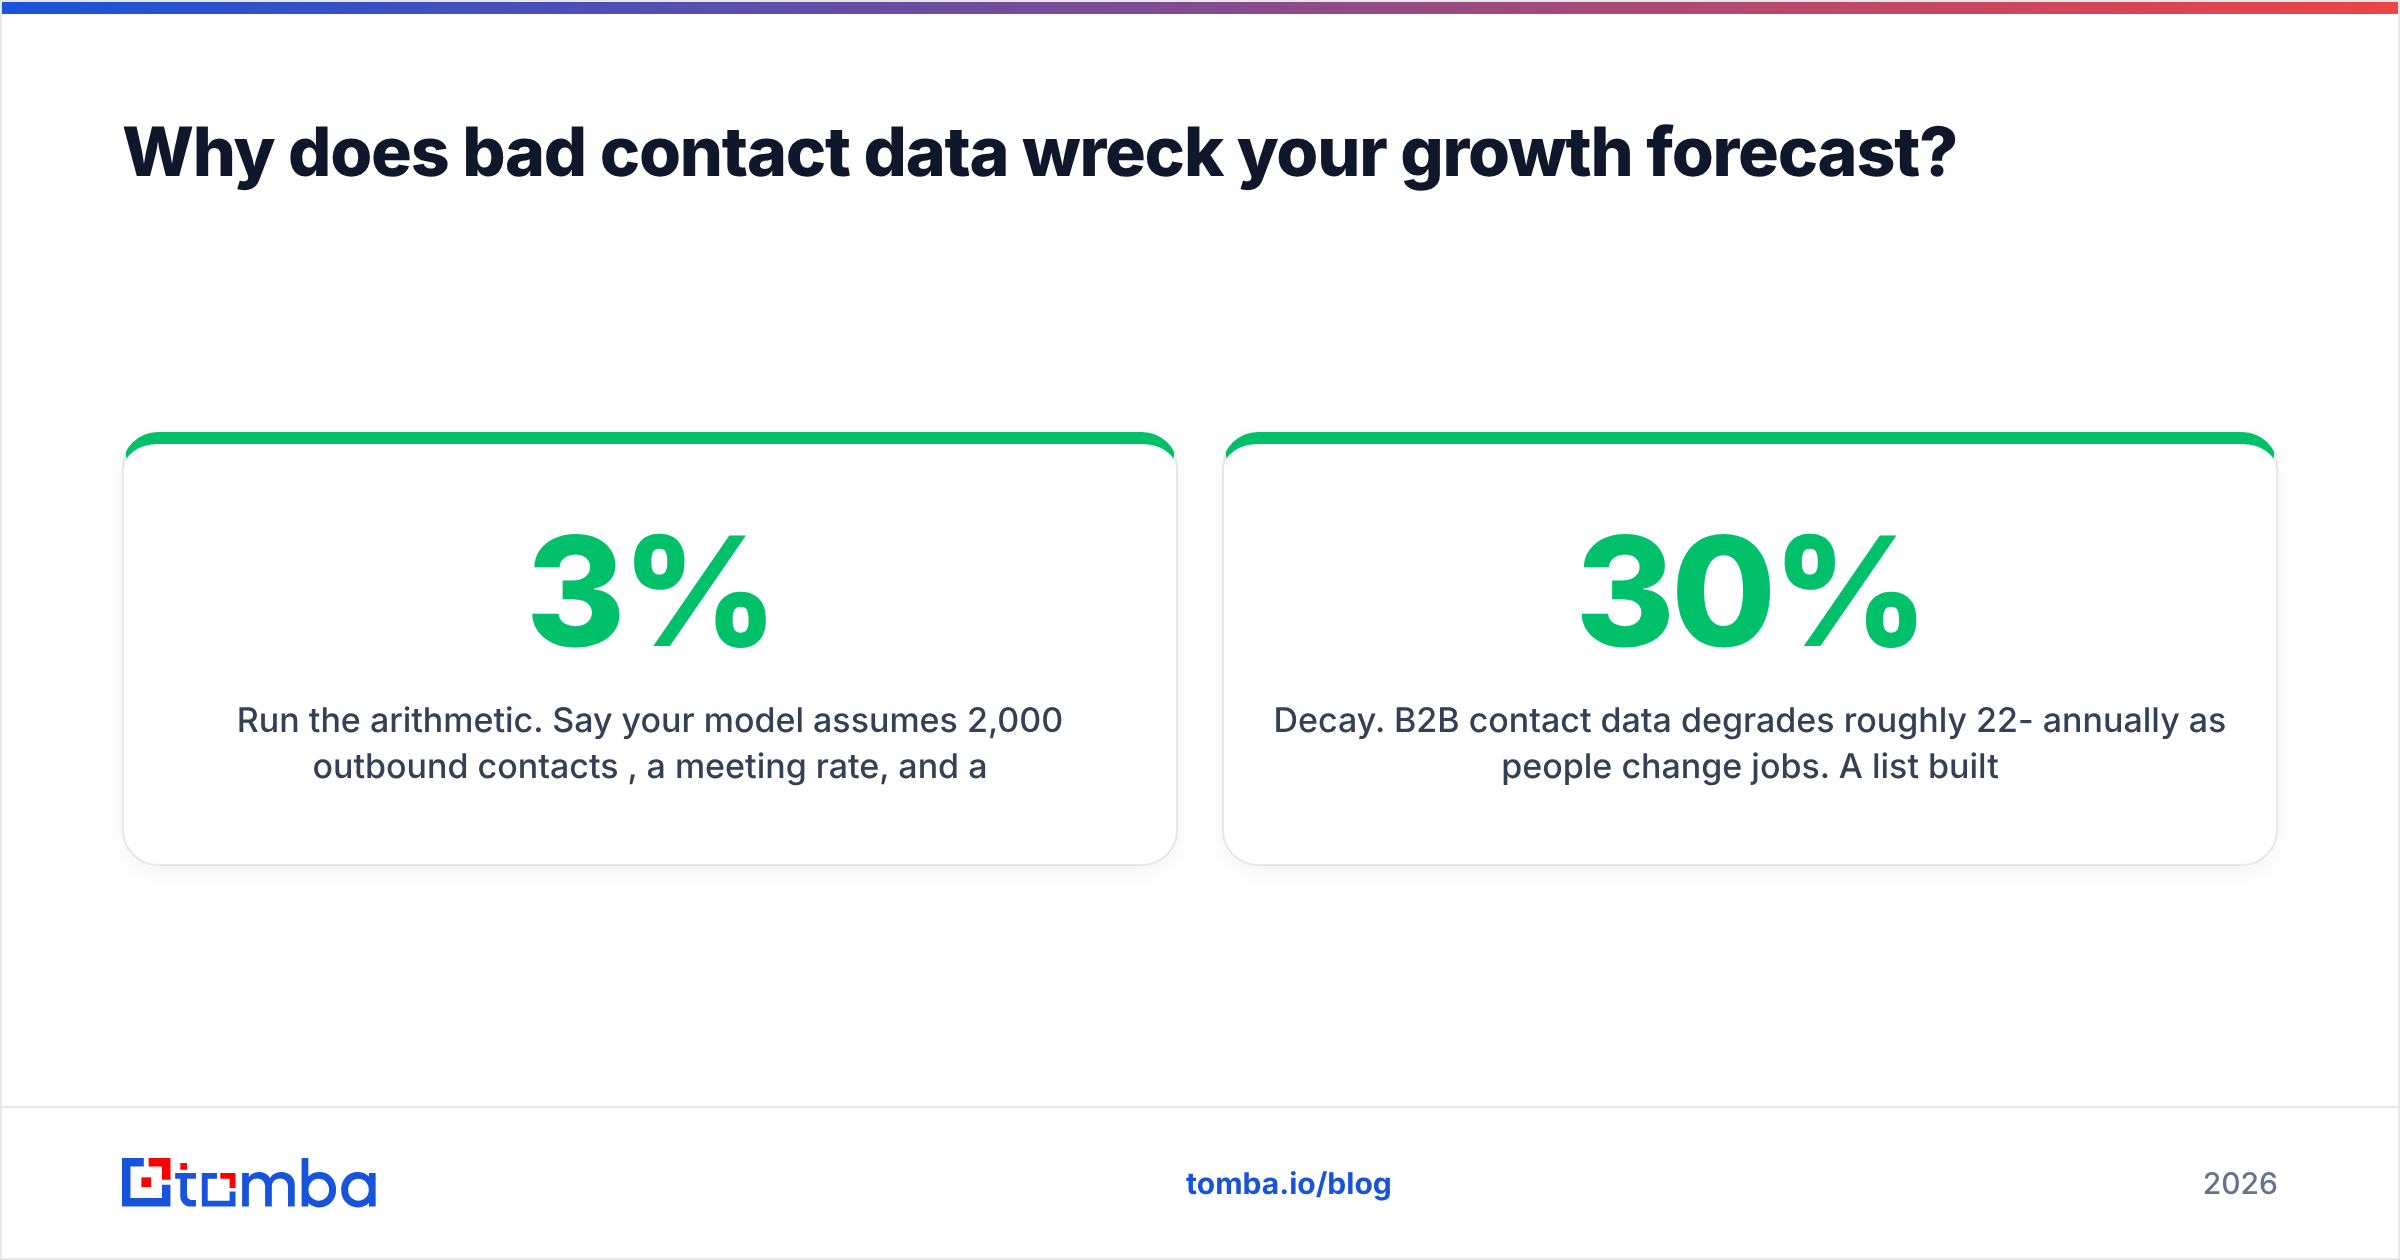
Run the arithmetic. Say your model assumes 2,000 outbound contacts per month, a 3% meeting rate, and a 25% meeting-to-opportunity rate: 15 new opportunities. Now assume 22% of those contacts are invalid, role-changed, or bouncing. Your real reachable universe is 1,560 — and because bounces also drag down email deliverability, your effective meeting rate drops below 3% too. The forecast said 15 opportunities. Reality delivers 9 or 10.
That gap doesn't show up as "bad data" in the postmortem. It shows up as "the team missed activity targets," and someone gets a coaching plan they didn't earn.
Three data problems that silently distort forecasts:
- Decay. B2B contact data degrades roughly 22-30% annually as people change jobs. A list built 14 months ago is meaningfully different from the one you modeled against.
- Duplicates. Duplicate accounts inflate pipeline count and coverage ratios. Two records for the same deal means you're forecasting the same revenue twice.
- Unverifiable addresses. Catch-all domains and role accounts pass basic syntax checks but never convert. Filtering them with a proper email verifier before they enter the sequence gives you a truer top-of-funnel number.
The fix is boring and it works: verify before you sequence, enrich on a schedule, and dedupe on account domain rather than company name. Teams that treat contact data as a forecast input — not an ops afterthought — see materially tighter variance.
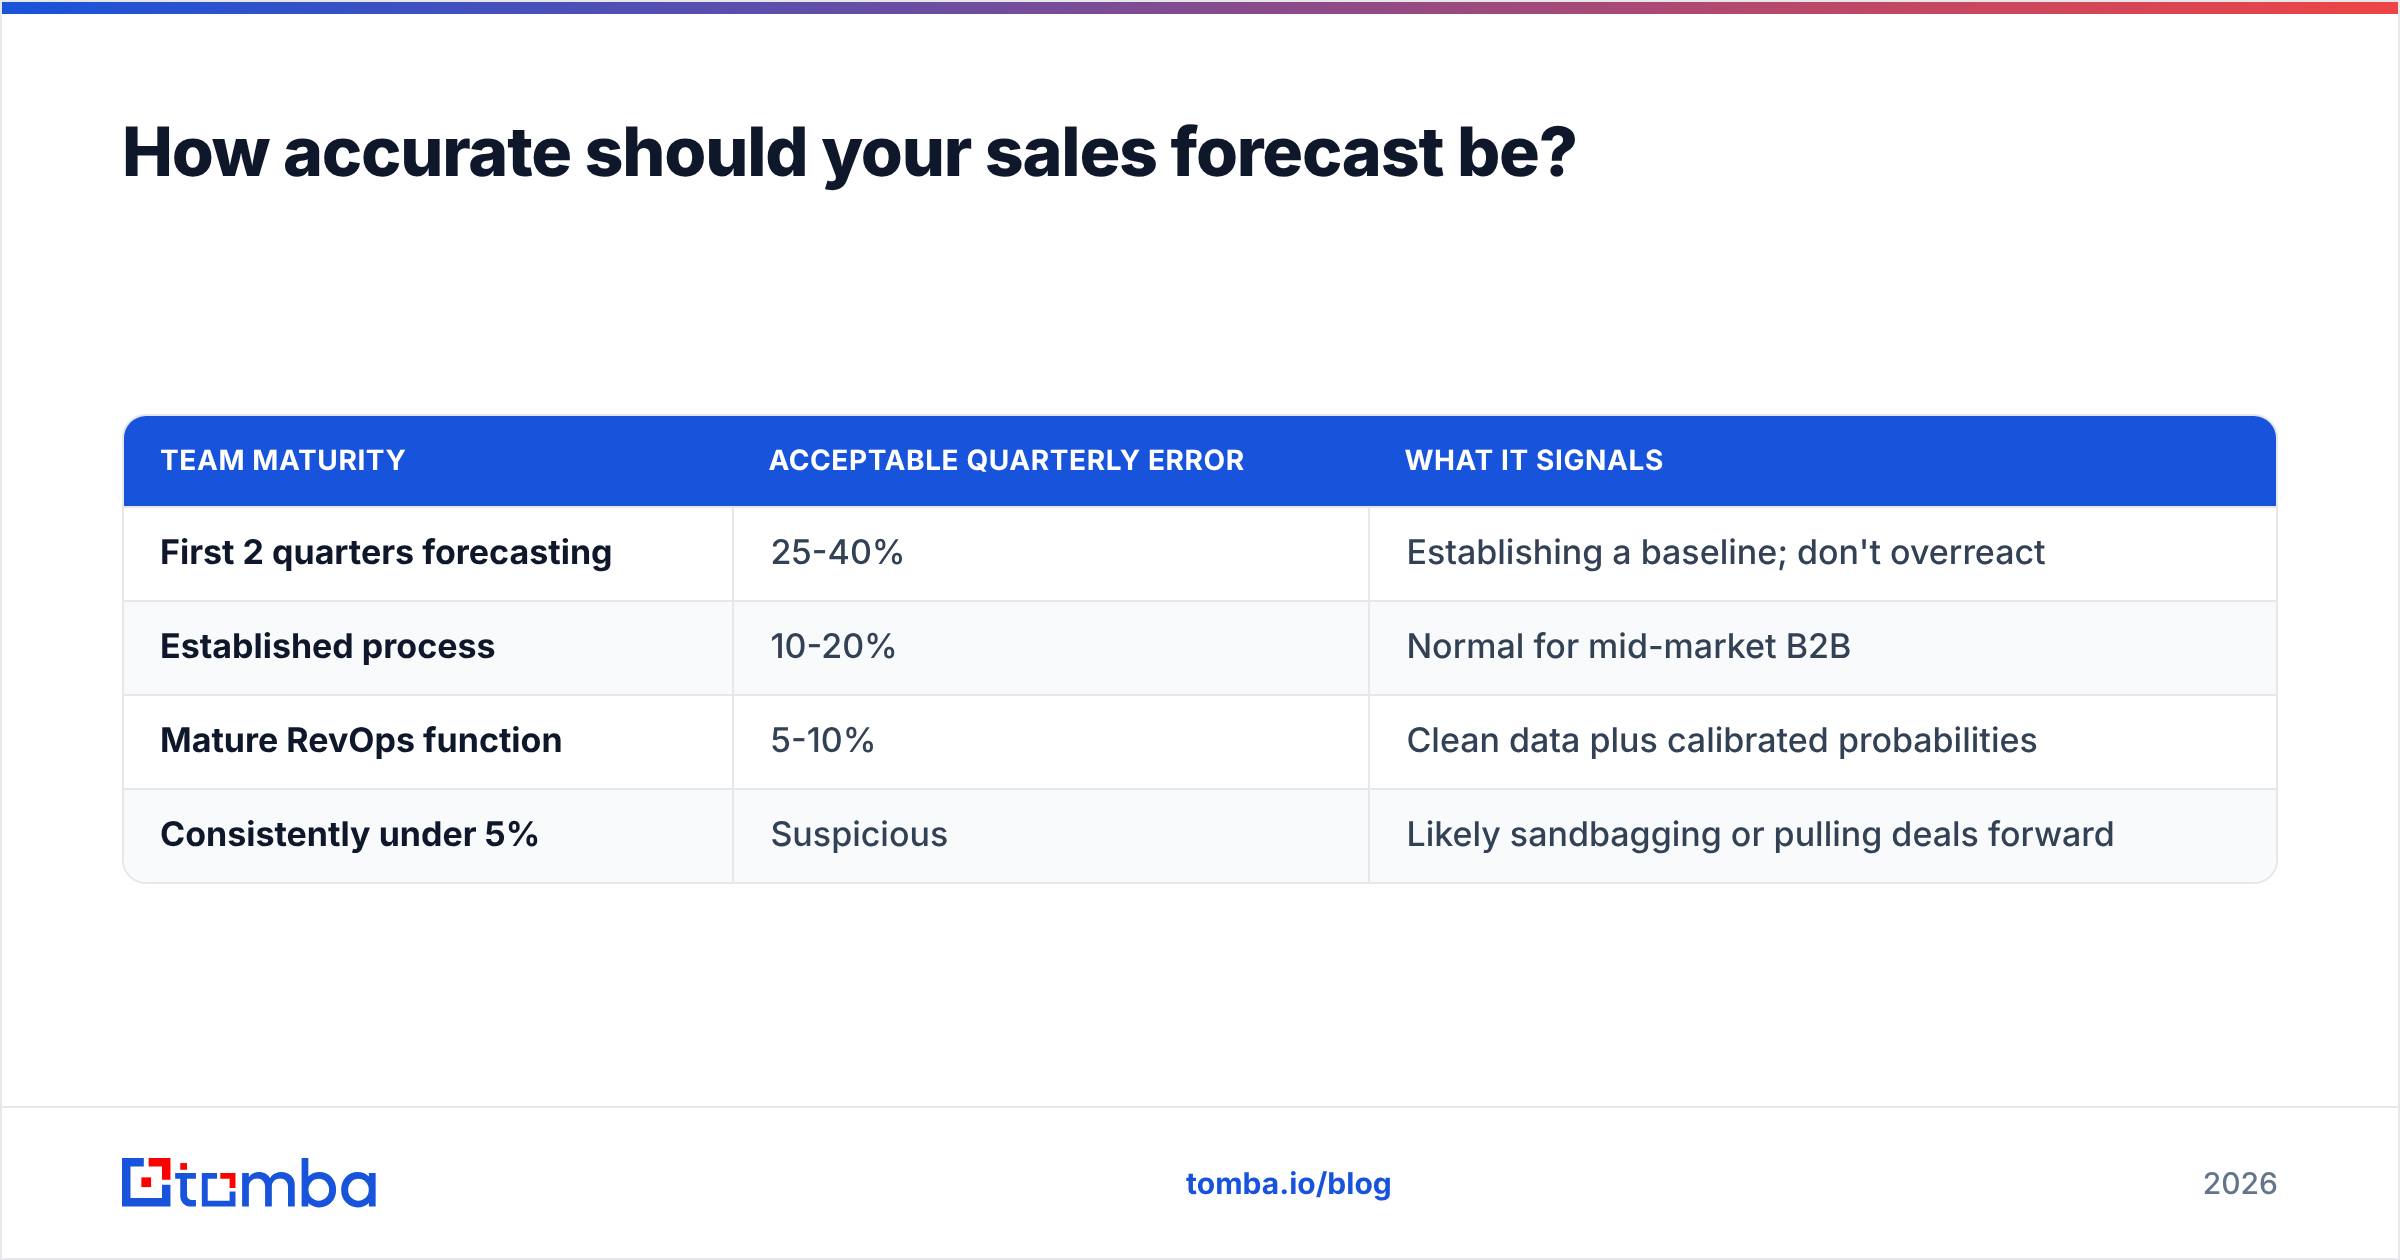
How accurate should your sales forecast be?#
Track it, or the question is unanswerable. Forecast accuracy is measured as absolute percentage error: |actual − forecast| ÷ actual.
| Team maturity | Acceptable quarterly error | What it signals |
|---|---|---|
| First 2 quarters forecasting | 25-40% | Establishing a baseline; don't overreact |
| Established process | 10-20% | Normal for mid-market B2B |
| Mature RevOps function | 5-10% | Clean data plus calibrated probabilities |
| Consistently under 5% | Suspicious | Likely sandbagging or pulling deals forward |
Two rules make this number improve on its own.
Rule one: log the forecast, then never edit it. Snapshot the commit number on day one of the quarter. If it can be revised silently in week 10, you're not measuring forecasting skill — you're measuring hindsight.
Rule two: attribute the miss. Every variance traces to one of four causes: pipeline volume, conversion rate, deal size, or cycle length. Naming which one moved turns a miss into a fix. Research from Gartner on revenue operations consistently points at the same root issue — forecast processes fail on inputs, not on math.
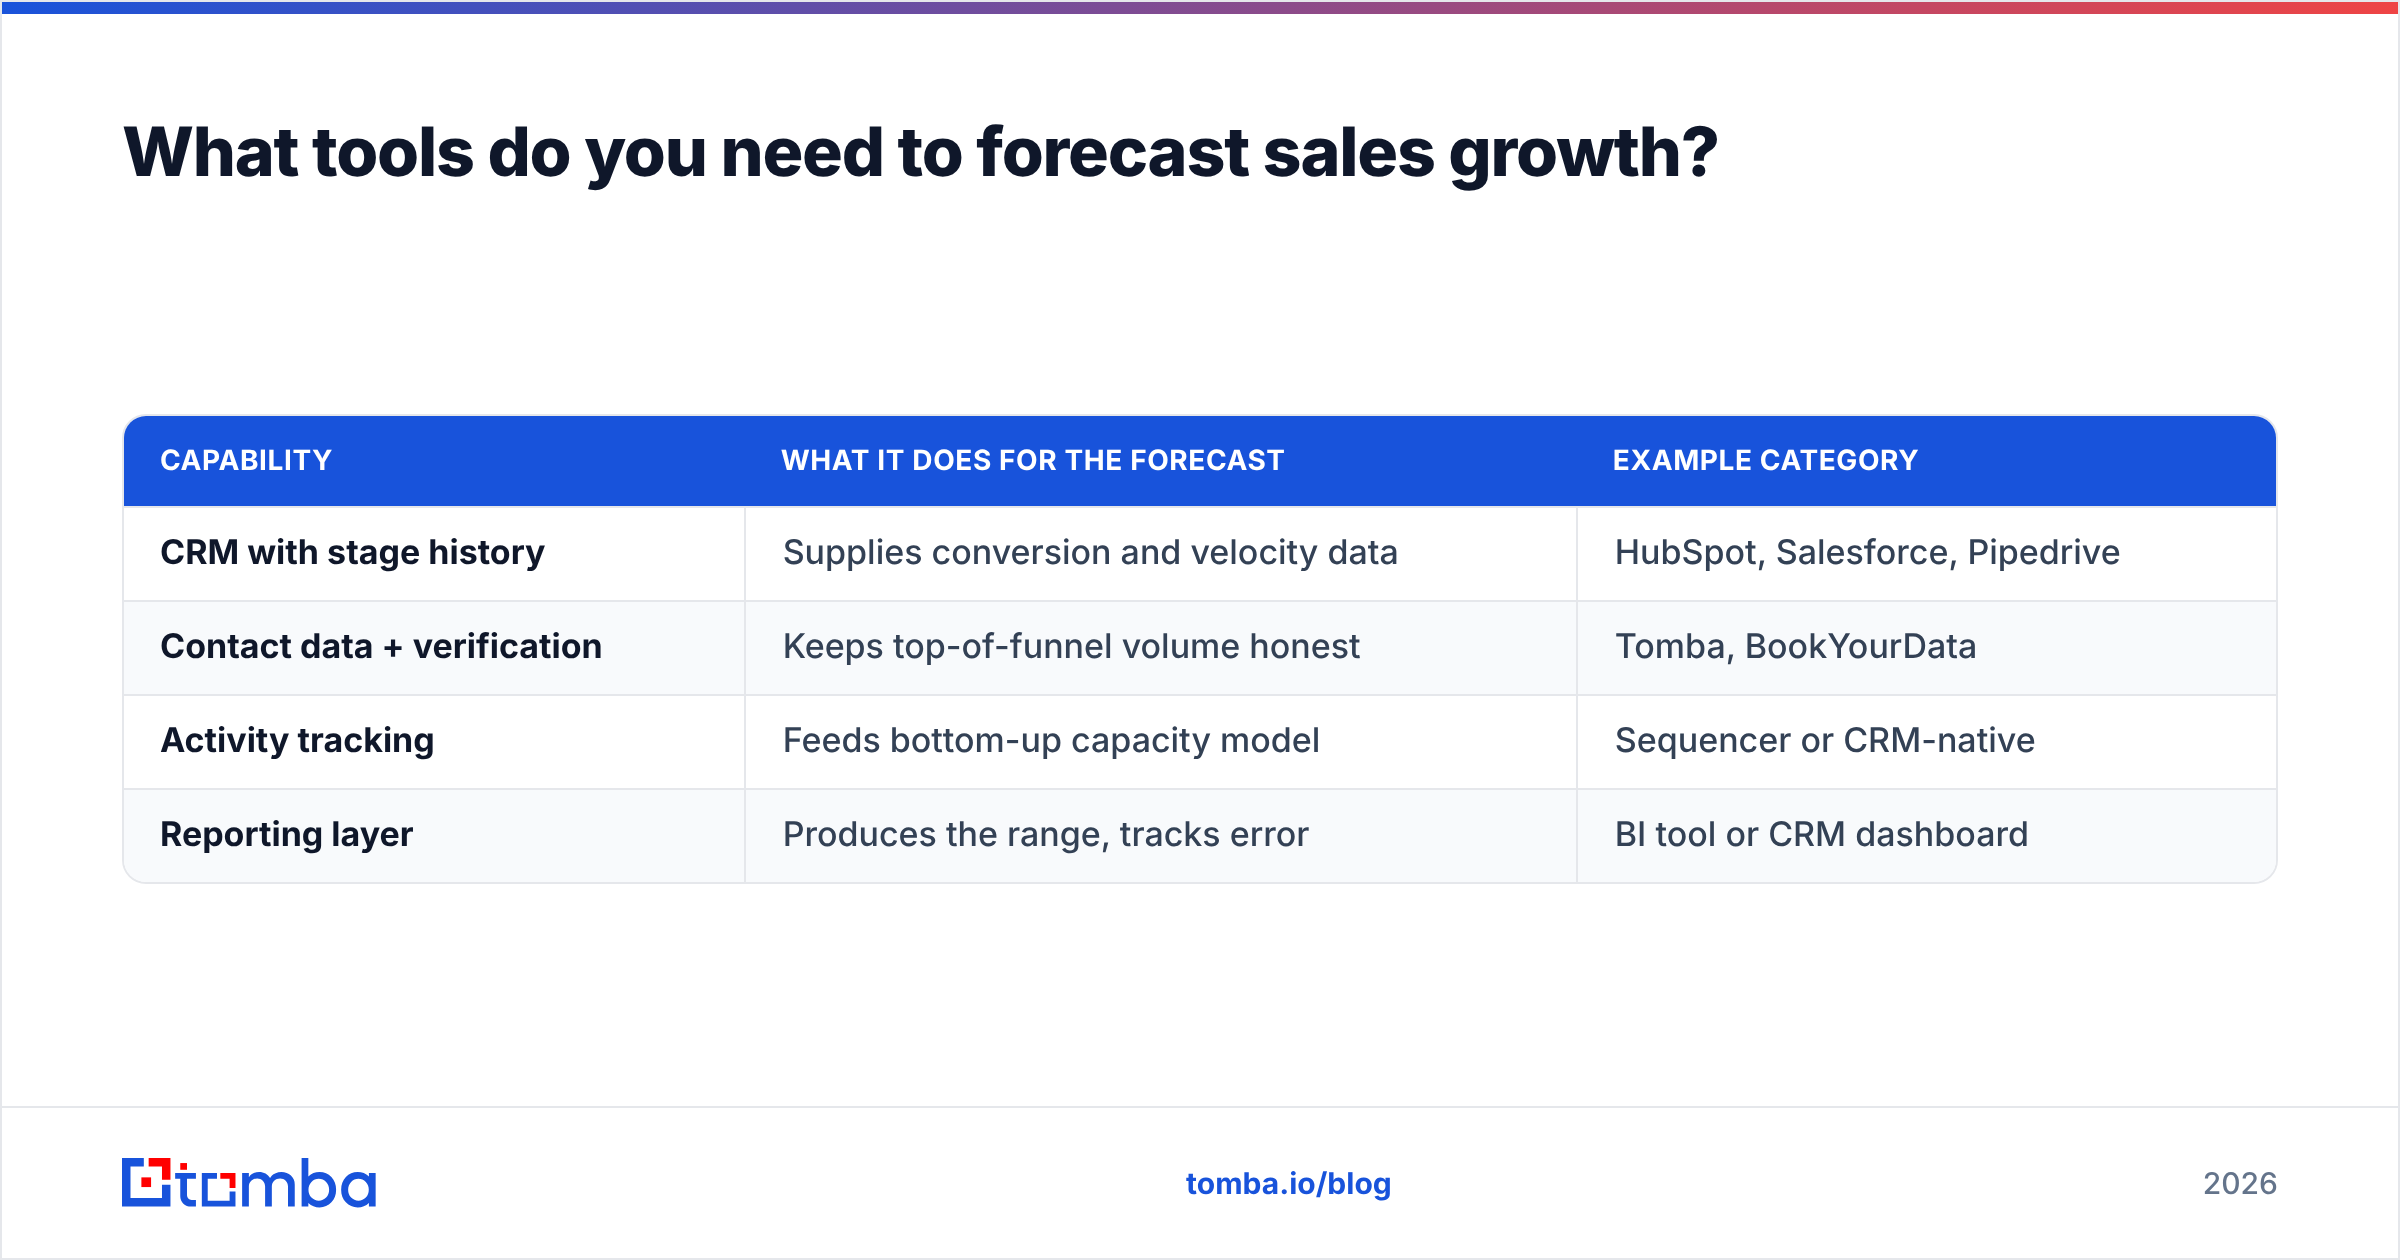
What tools do you need to forecast sales growth?#
Fewer than vendors would like you to believe. You need four capabilities, and several can live in one tool.
| Capability | What it does for the forecast | Example category |
|---|---|---|
| CRM with stage history | Supplies conversion and velocity data | HubSpot, Salesforce, Pipedrive |
| Contact data + verification | Keeps top-of-funnel volume honest | Tomba, BookYourData |
| Activity tracking | Feeds bottom-up capacity model | Sequencer or CRM-native |
| Reporting layer | Produces the range, tracks error | BI tool or CRM dashboard |
On the data layer specifically: your choice depends on how you buy. Prepaid B2B contact lists from a provider like BookYourData suit teams that want a large, verified set delivered up front for a defined campaign. A search-and-verify platform suits teams building lists continuously against a moving ICP. Neither is wrong — they solve different sides of the same forecast input.
If you're running the continuous model, Tomba pricing starts with a free tier at 25 searches per month, then Starter at $49/mo, Growth at $99/mo, and Pro at $249/mo, with Enterprise custom. For forecasting work the useful pieces are the bulk email finder for building a monthly reachable universe you can actually model against, and the Tomba API for scheduled re-verification so your contact base doesn't quietly decay between planning cycles.
One integration note that saves real time: pipe verification results back into the CRM so your reachable-contact count is a field, not a spreadsheet someone rebuilds each quarter. Tools with a HubSpot integration make this a configuration task rather than an engineering project. Reviews on G2 are a reasonable starting point for comparing options in this category, though weight recent reviews far more heavily than the aggregate score.
How do you forecast growth for a brand-new team or product?#
You can't run pipeline-weighted forecasting with no pipeline. Use bottom-up capacity and accept wide error bars.
Build it in this order:
- Define one repeatable motion. Not three. Pick the single channel you'll run for 90 days.
- Estimate reachable market, honestly. Total accounts matching ICP × contacts per account × percentage you can actually source contact data for. That last multiplier is usually 40-70%, not 100%.
- Use benchmark conversion rates, marked as assumptions. Cold outbound to meeting: 1-3%. Meeting to opportunity: 20-40%. Opportunity to close: 15-30%. Label every one of these as an assumption in the model so you replace them with real data at day 90.
- Model ramp explicitly. A new AE contributes roughly 0% in month one, 30% in month two, 60% in month three. Averaging this away is the single most common new-team forecasting error.
- Forecast in 30-day increments. Quarterly forecasts on unproven motions are meaningless. Short cycles let you replace assumptions with observed rates fast.
- Set a kill criterion. Decide in advance what result at day 60 makes you change the motion rather than push harder on it.
At day 90 you'll have enough deal history to switch to stage velocity. Until then, resist the urge to present a bottom-up model with the same confidence as a data-backed one — flag it as a plan, not a forecast.
What should you do next?#
Pick one method, run it for two quarters, and measure your error. That beats building an elaborate model you abandon in week three.
Concretely, this week: audit your stage probabilities against actual close rates, close out stale deals, and count how many contacts in your outbound universe are actually verified and current. That third number is usually the biggest unmodeled variable in the whole forecast — and the one you can fix fastest.
When you're ready to make your top-of-funnel input reliable, start with the Tomba Email Finder. Build your reachable-contact list by domain or by name, verify before anything enters a sequence, and re-run it on a schedule so the numbers feeding your growth model reflect the market as it is today — not as it was two quarters ago. The free tier is enough to test the workflow against one target segment before you commit budget.
Related guides#
// get started
Find, verify and enrich your first contacts today
Start on the free plan with 25 searches a month, then scale when your team is ready.
Free plan · No credit card required · GDPR & CCPA
// about the author