How to Improve Sales Forecasting Accuracy in 2026: 7 Fixes
Most B2B forecasts miss because the pipeline data underneath them is stale, not because the model is wrong. Here are seven concrete fixes that tighten forecast accuracy inside one quarter.
The short answer on how to improve sales forecasting accuracy: fix the pipeline data first. Most B2B forecasts miss because the records underneath them are stale, not because the math is wrong.
TL;DR
- Forecast accuracy is a data problem before it is a modeling problem. Fix stage definitions, contact data, and close-date hygiene first.
- Measure accuracy as forecast error at the commit level (
|actual − forecast| / actual). Drop the vague "we were close" narrative. - A 90%+ forecast rests on three things: exit criteria per stage, a weekly inspection cadence, and deal-level evidence instead of rep sentiment.
- Weighted-pipeline forecasting is the fastest upgrade from gut feel. Mature teams triangulate: pipeline, history, and AI scoring.
- Bad contact data quietly inflates pipeline. Deals with unreachable stakeholders are the ones that slip.
What does sales forecasting accuracy actually mean?#
Sales forecasting accuracy is the gap between what you said would close and what actually closed. Express it as a percentage. The standard formula:
Forecast Accuracy = 1 − (|Actual − Forecast| / Actual)
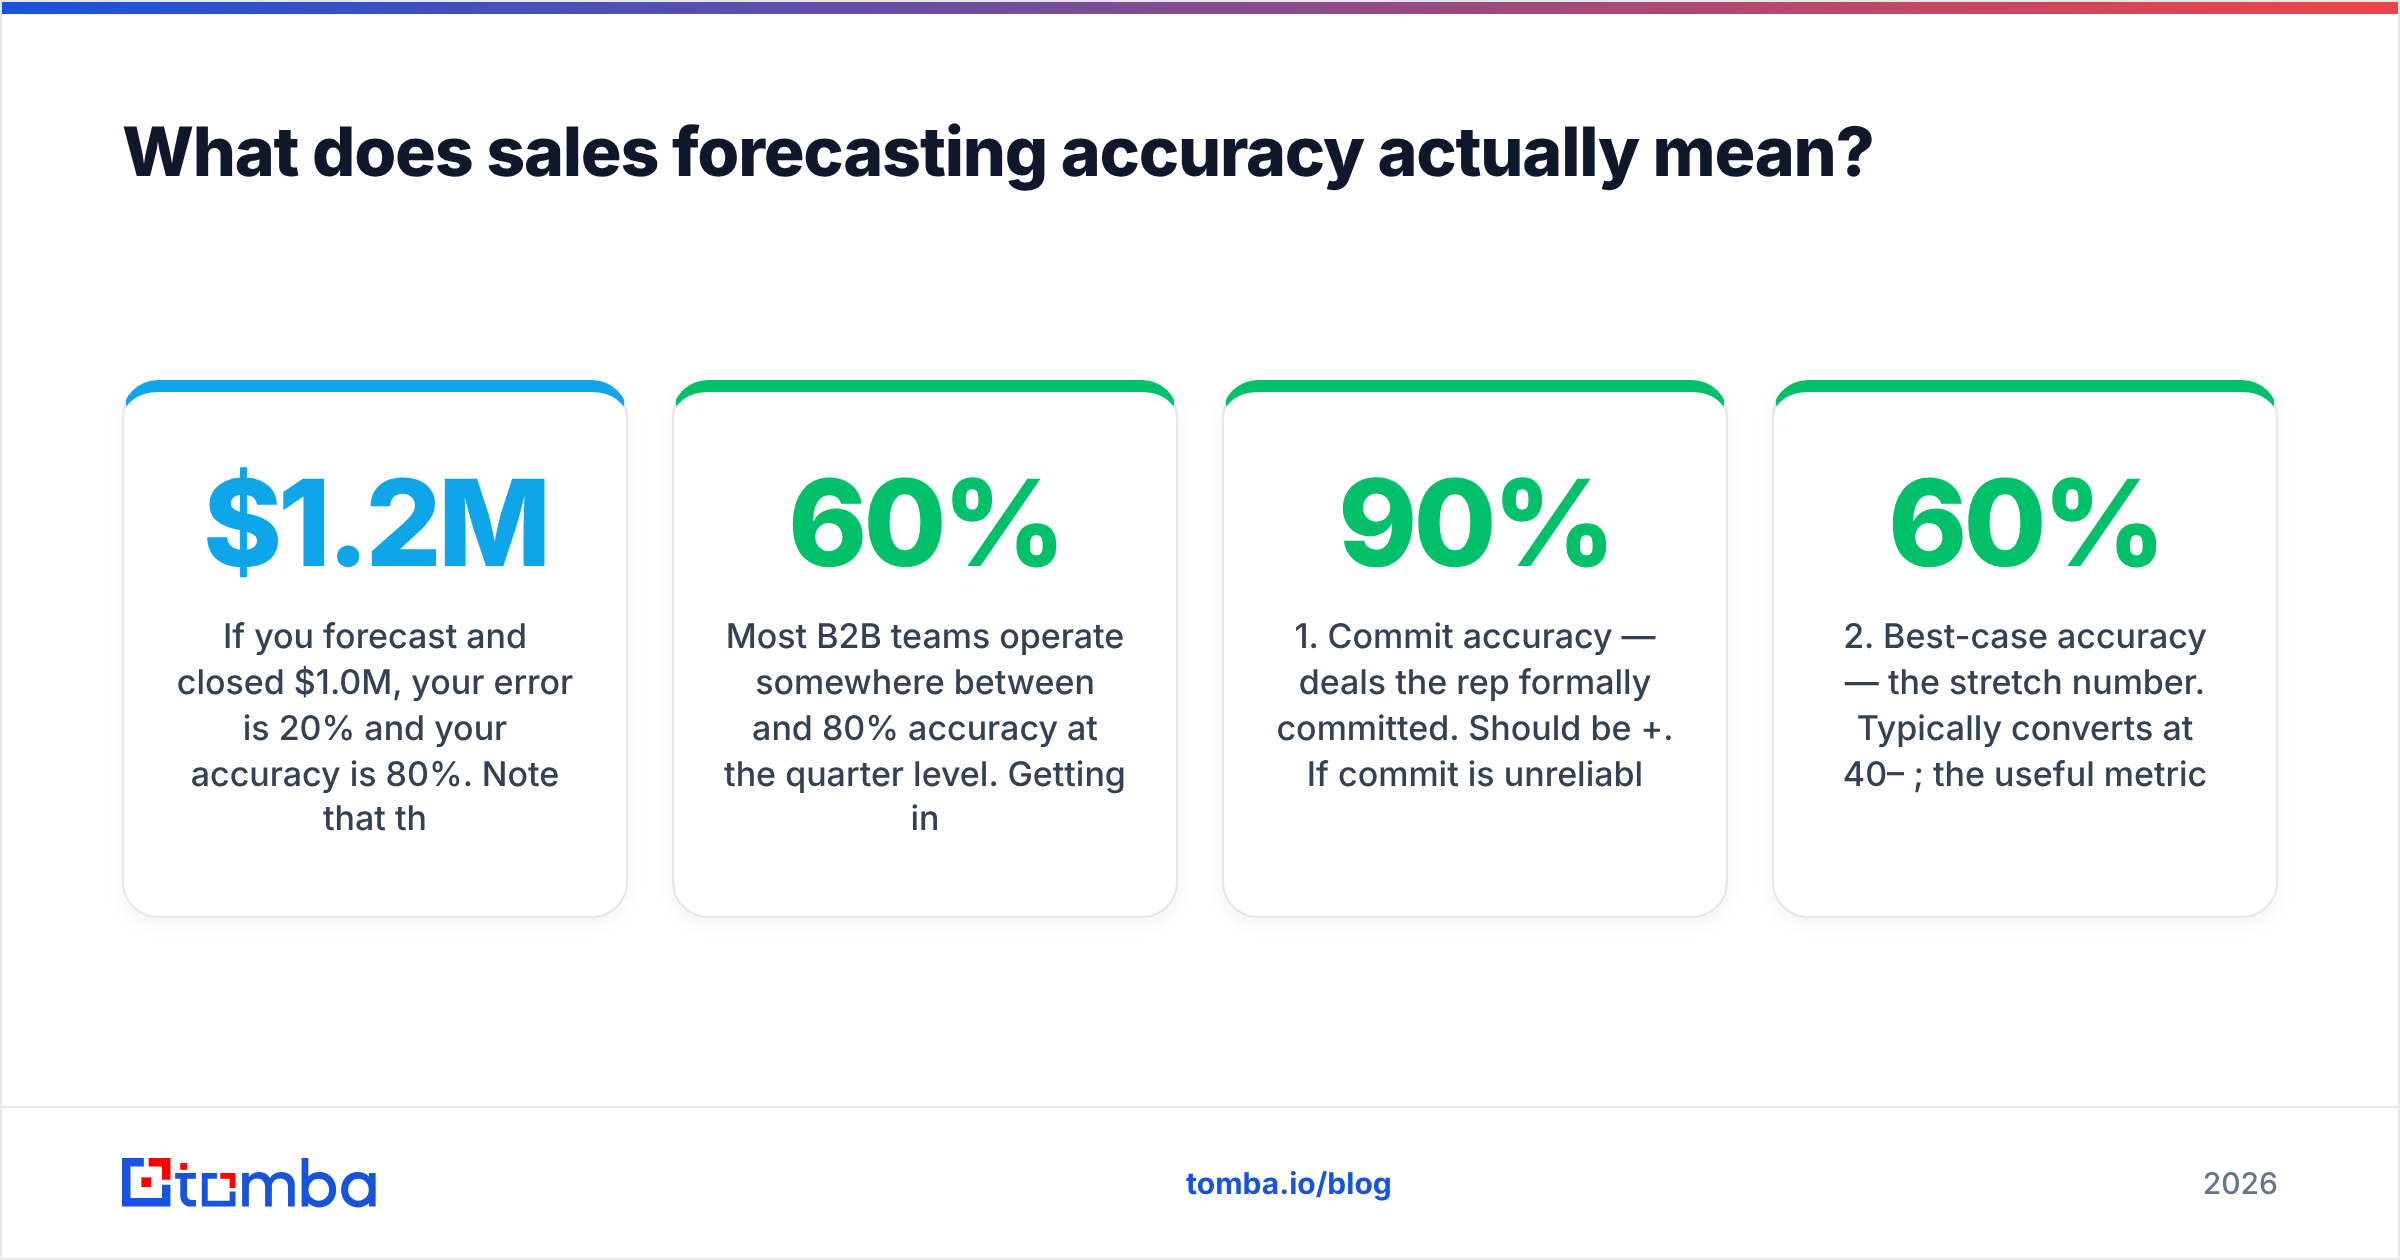
Forecast $1.2M, close $1.0M, and your error is 20%. Your accuracy is 80%. Note that this metric cuts both ways. Sandbagging is as much a miss as happy ears, even though only one of them gets you yelled at.
Most B2B teams land between 60% and 80% accuracy per quarter. The high 80s and low 90s are reachable. But you have to accept the uncomfortable part first: accuracy is capped by the quality of your pipeline records. No model fixes close dates that reps drag forward every Friday.
Track three levels of accuracy separately:
- Commit accuracy — deals the rep formally committed. Should be 90%+. If commit is unreliable, nothing downstream matters.
- Best-case accuracy — the stretch number. It usually converts at 40–60%. What matters is whether that rate is stable, not whether it is high.
- Pipeline coverage accuracy — does your coverage ratio (usually 3x–4x) actually predict attainment? Many teams inherit "3x" from a blog post and never test it against their own win rate.

Why are most B2B sales forecasts wrong?#
Forecasts fail for boring, fixable reasons. Here they are, ranked by how much damage they cause:
Stage definitions are subjective. If "Stage 3 — Demo Completed" means whatever the rep wants it to mean, stage-based probability weighting is arithmetic on fiction. Stages need exit criteria the buyer can verify: a scheduled security review, a shared success plan, a named economic buyer who replied to an email.
Close dates are aspirational. The classic leak is the deal that has been pushed three quarters in a row and still sits in commit. Track "date pushes per opportunity" as a field. Two pushes should trigger an automatic downgrade.
Single-threaded deals get counted as multi-threaded. Gartner's sales research finds that B2B buying groups run six to ten stakeholders. A deal with one contact in the CRM is not a forecastable deal. It is a conversation. This is where contact data quality stops being an ops chore and becomes a forecasting problem.
Reps forecast their hope. Managers forecast their fear. Without evidence-based inspection, the roll-up turns into a negotiation between two biases. The fix: make managers ask for artifacts, not adjectives.
The CRM is stale by Wednesday. If a CRM update costs a rep 40 minutes, it will not happen every week. Auto-capture of activity, contacts, and email engagement is not a nice-to-have. It is the substrate the forecast reads from.
How to improve sales forecasting accuracy, step by step#
Here is how to improve sales forecasting accuracy, in the order that pays off fastest.
- Rewrite stage exit criteria as observable buyer actions. Not "prospect is interested." Instead: "prospect returned a signed mutual action plan." Anything a rep can assert without evidence gets cut.
- Enforce a close-date rule. Any date change needs a note on what changed for the buyer. Deals pushed twice drop out of commit automatically. This one rule tends to recover 5–10 points of accuracy.
- Require multi-threading before commit. Two verified contacts minimum, and one of them holds budget. Verified means the email address resolves. It does not mean someone typed a name into a field.
The first three steps are pure process, and you can ship them this week. The next four need tooling and data enrichment to hold up over time.
- Clean contact records continuously, not quarterly. Contact data decays 25–30% a year through job changes alone. Run your account contacts through an email verifier on a schedule. Flag every account where the champion has gone dark.
- Weight by historical conversion, not by stage label. Pull your own last four quarters of stage-to-close rates and use those numbers. Vendor-default probabilities are almost always wrong for your business.
- Run a structured weekly inspection. Same questions, same order, every week. What changed? What is the next buyer-side commitment? What would have to be true for this to close on the stated date?
- Score the forecast, then score the forecaster. Track accuracy by rep and by manager over time. Chronic sandbaggers and chronic optimists need different coaching, and you cannot tell them apart without a rolling record.
Which forecasting method should you use?#
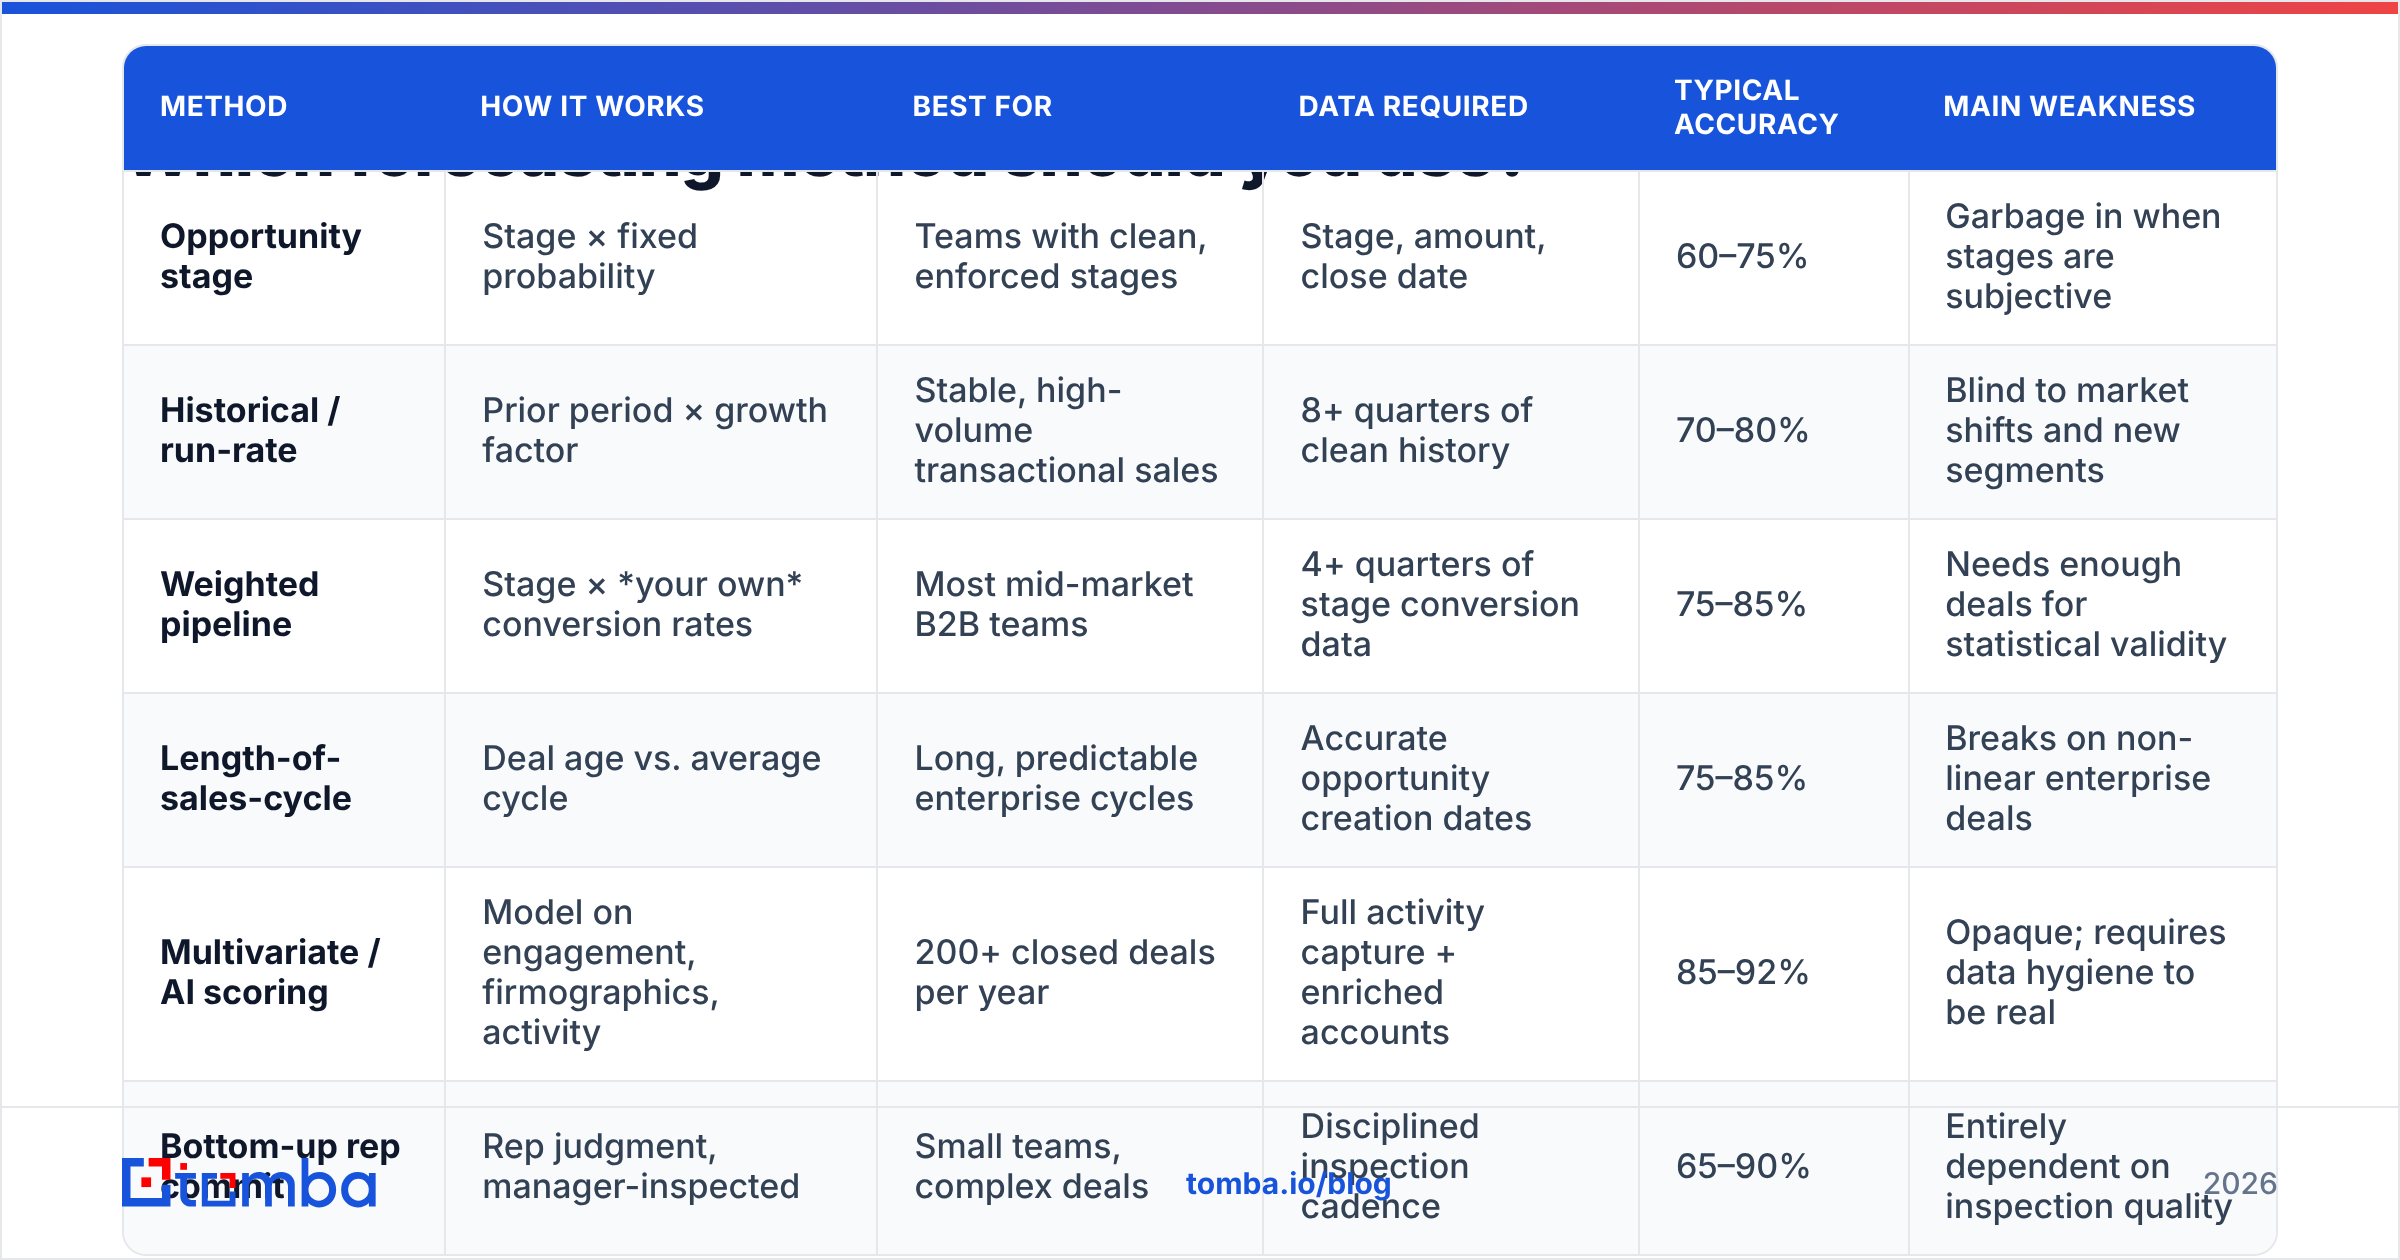
There is no single correct method. There is a correct method for your deal volume and sales cycle length. Here is how the main approaches compare:
| Method | How it works | Best for | Data required | Typical accuracy | Main weakness |
|---|---|---|---|---|---|
| Opportunity stage | Stage × fixed probability | Teams with clean, enforced stages | Stage, amount, close date | 60–75% | Garbage in when stages are subjective |
| Historical / run-rate | Prior period × growth factor | Stable, high-volume transactional sales | 8+ quarters of clean history | 70–80% | Blind to market shifts and new segments |
| Weighted pipeline | Stage × your own conversion rates | Most mid-market B2B teams | 4+ quarters of stage conversion data | 75–85% | Needs enough deals for statistical validity |
| Length-of-sales-cycle | Deal age vs. average cycle | Long, predictable enterprise cycles | Accurate opportunity creation dates | 75–85% | Breaks on non-linear enterprise deals |
| Multivariate / AI scoring | Model on engagement, firmographics, activity | 200+ closed deals per year | Full activity capture + enriched accounts | 85–92% | Opaque; requires data hygiene to be real |
| Bottom-up rep commit | Rep judgment, manager-inspected | Small teams, complex deals | Disciplined inspection cadence | 65–90% | Entirely dependent on inspection quality |
The practical answer for most teams: run weighted pipeline as your primary number. Run historical run-rate as a sanity check. If the two disagree by more than 15%, inspect the gap instead of averaging it away.
How does contact data quality change forecast accuracy?#
More than most revenue leaders expect. Think of your pipeline as a bridge and your contact data as the load rating on the beams. The bridge looks the same either way, until traffic crosses it.
Three mechanisms link contact data to forecast error:
Stakeholder coverage predicts slip. Deals with three or more verified, engaged contacts close on time far more often than single-threaded deals of the same size and stage. Maybe your CRM cannot report contact count per opportunity. Or worse, it counts contacts whose emails bounce. Either way, your stage probabilities are inflated on exactly the deals most likely to slip.
Champion departure is the leading indicator nobody tracks. When a champion changes jobs, the deal does not move stages, so the forecast does not react. The deal quietly dies four weeks later. Continuous verification catches this within days, not at quarter-end. Run periodic checks with a bulk email finder across your open-opportunity contacts. Dead addresses then surface before the deal review does.
Pipeline built on bad data never converts. Say your top-of-funnel lists are 30% invalid. The meetings booked from them skew low-intent. Your stage-to-close rates fill up with deals that were never real, and that corrupts the historical rates you use to weight everything else. Source from verified providers instead — a curated database like BookYourData, or a real-time lookup layer like Tomba's domain search. That keeps the denominator honest.

What cadence keeps the forecast honest?#
Accuracy is a rhythm, not an event. The cadence below is what high-performing teams run, and it is deliberately unglamorous:
- Daily (rep, 10 min): Update anything that changed from a buyer interaction. Not from a hunch — from an interaction.
- Weekly (manager, 45 min per rep): Deal-by-deal inspection of commit and best case. Every commit deal needs a next buyer-side commitment with a date attached. No date, no commit.
- Weekly (ops, automated): Data hygiene report — opportunities with no contacts, contacts with unverified emails, deals with no activity in 14 days, close dates in the past.
- Monthly (leadership, 60 min): Forecast accuracy retrospective. Which deals missed? Was the miss a data problem, a process problem, or a market problem? Categorize every one.
- Quarterly (RevOps): Recompute stage conversion rates from actuals and update the weighting model. Rates drift, and static models decay.
HubSpot's sales research and Salesforce's State of Sales reporting point at the same finding from different angles. Teams that inspect weekly on a fixed structure beat teams that inspect ad hoc, whatever tooling they use. The ritual matters more than the platform.
One rule makes the weekly inspection productive. Managers ask "what would have to be true?" instead of "are you confident?" Confidence is unfalsifiable. Conditions are checkable.
What tools support accurate forecasting?#
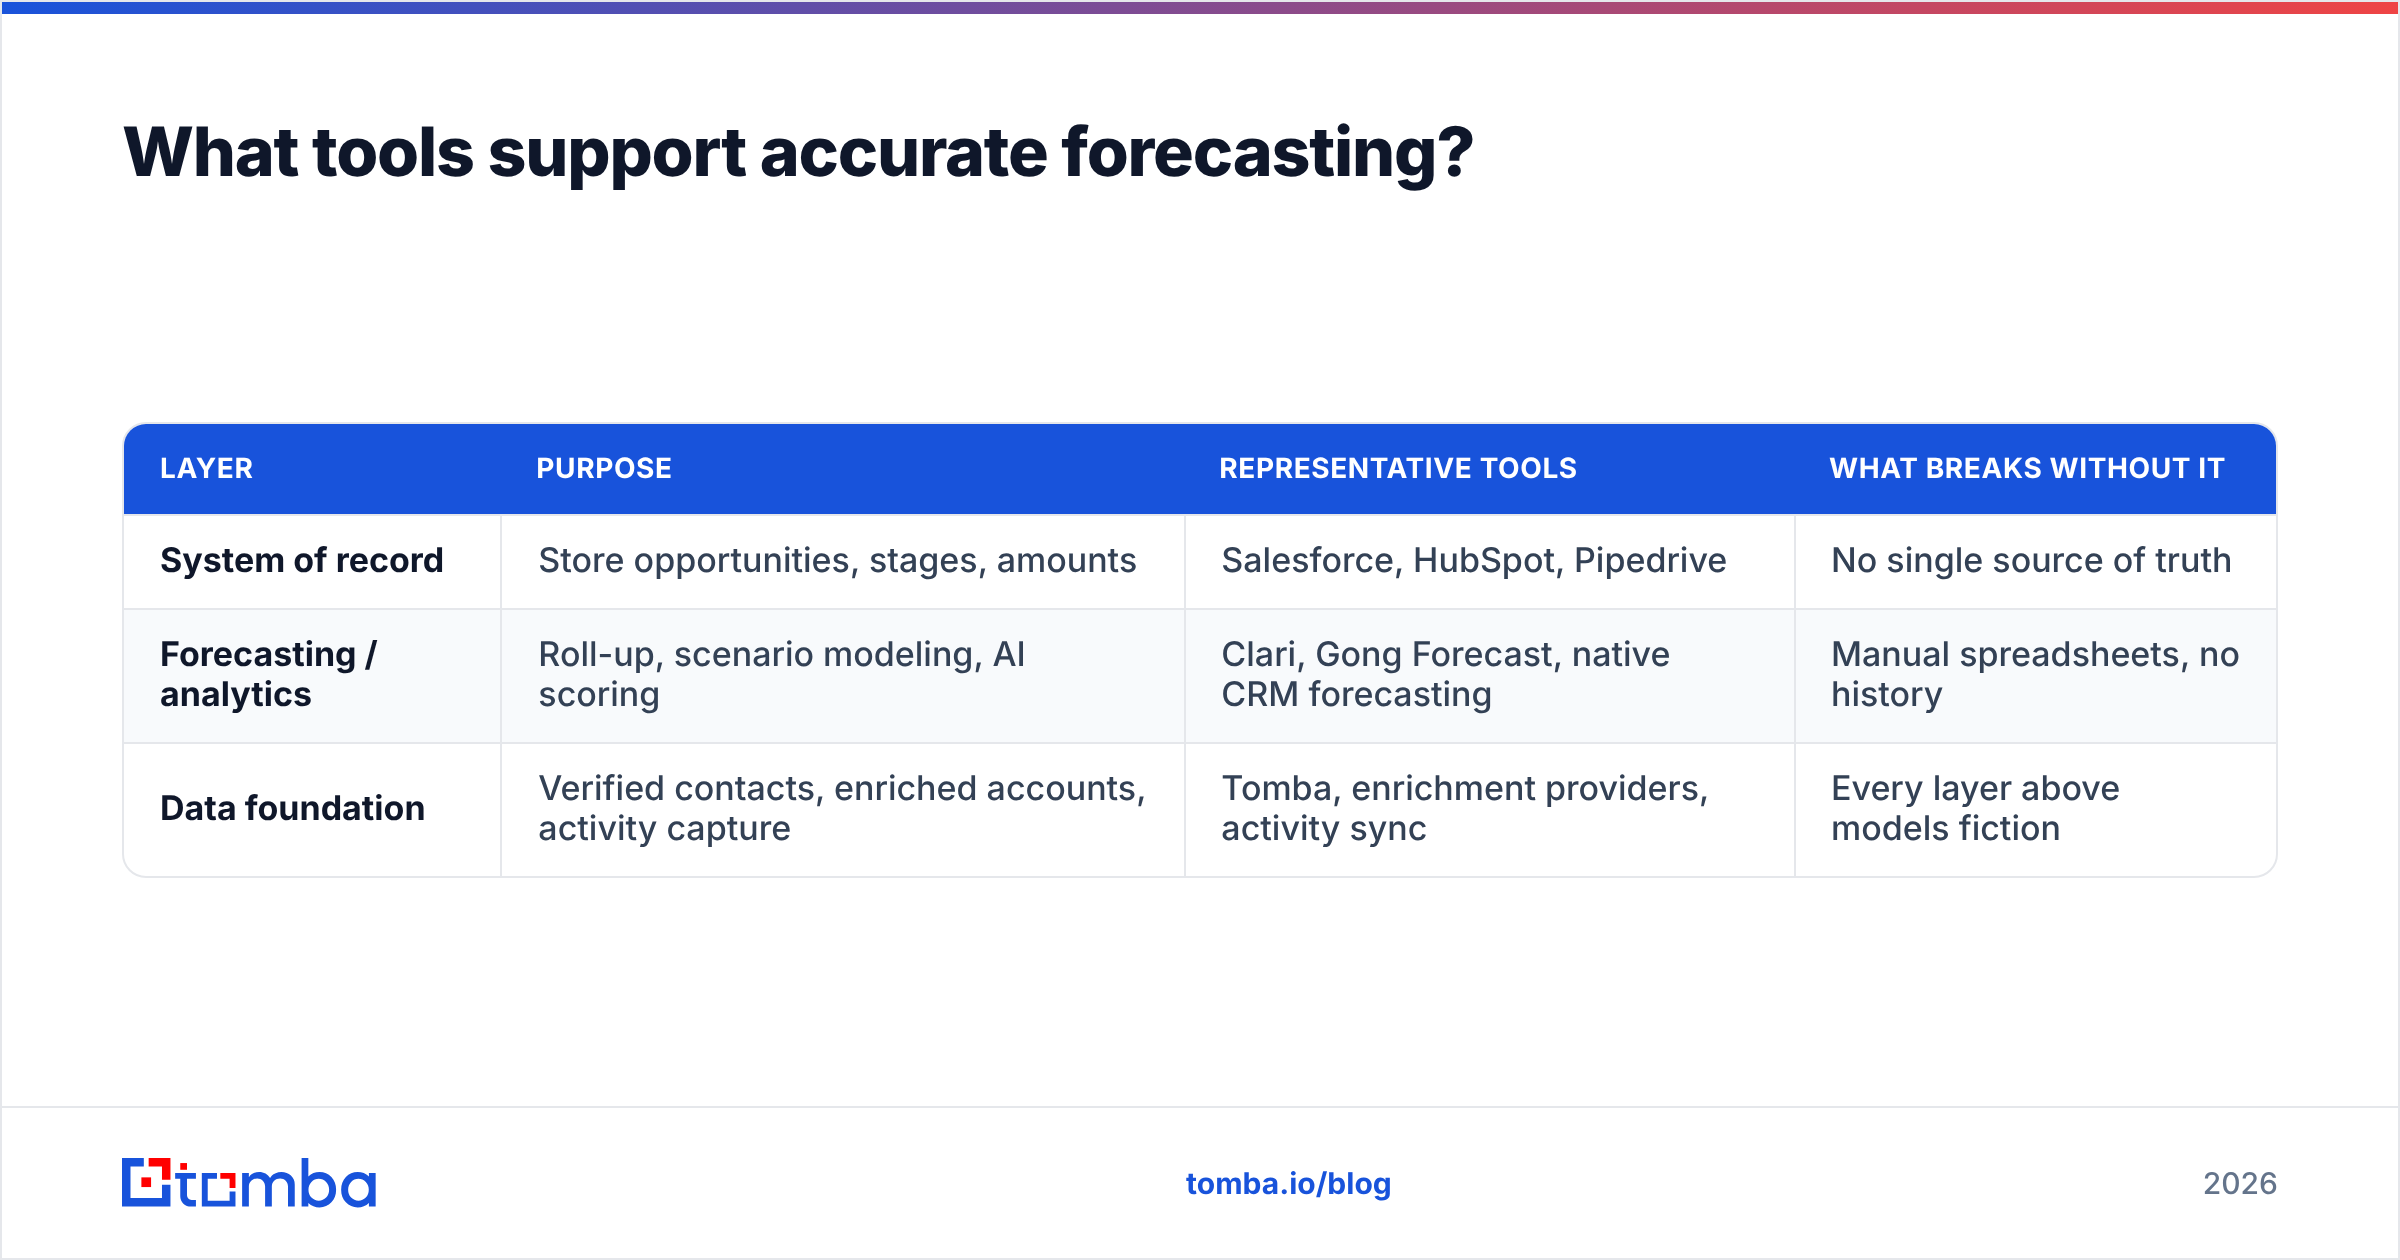
The stack splits into three layers. Teams usually over-invest in the top layer and ignore the bottom one.
| Layer | Purpose | Representative tools | What breaks without it |
|---|---|---|---|
| System of record | Store opportunities, stages, amounts | Salesforce, HubSpot, Pipedrive | No single source of truth |
| Forecasting / analytics | Roll-up, scenario modeling, AI scoring | Clari, Gong Forecast, native CRM forecasting | Manual spreadsheets, no history |
| Data foundation | Verified contacts, enriched accounts, activity capture | Tomba, enrichment providers, activity sync | Every layer above models fiction |
Start at the bottom. A $60k/year forecasting platform sitting on a CRM where 30% of contact emails bounce will produce confident, precise, wrong numbers. Wire verified contact data into the CRM through a Salesforce integration or HubSpot integration. That closes the gap without adding rep workload.
Want programmatic control? Push verification into the pipeline itself with the Tomba API, so every new contact is checked at creation rather than audited later. That layer is cheap next to what it protects. Tomba pricing starts free at 25 searches per month, then Starter at $49/mo, Growth at $99/mo, and Pro at $249/mo — a rounding error against a single misforecast quarter.
How do you know whether accuracy actually improved?#
Set a baseline before you change anything. Otherwise you will be arguing about vibes in six months.
Record these five numbers for the last four completed quarters:
- Commit accuracy — committed vs. closed, per quarter.
- Slip rate — percentage of commit deals that pushed to the next quarter.
- Average close-date pushes per won deal — a direct proxy for close-date honesty.
- Contacts per won opportunity vs. lost opportunity — quantifies your multi-threading gap.
- Percentage of open-pipeline contacts with a verified email — your data-decay exposure.
Then re-measure at the end of each quarter. Expect the numbers to get worse in quarter one, right after you tighten stage criteria. Inflated pipeline gets purged. That is the intervention working, not failing. Real improvement shows up in quarter two and settles in quarter three.
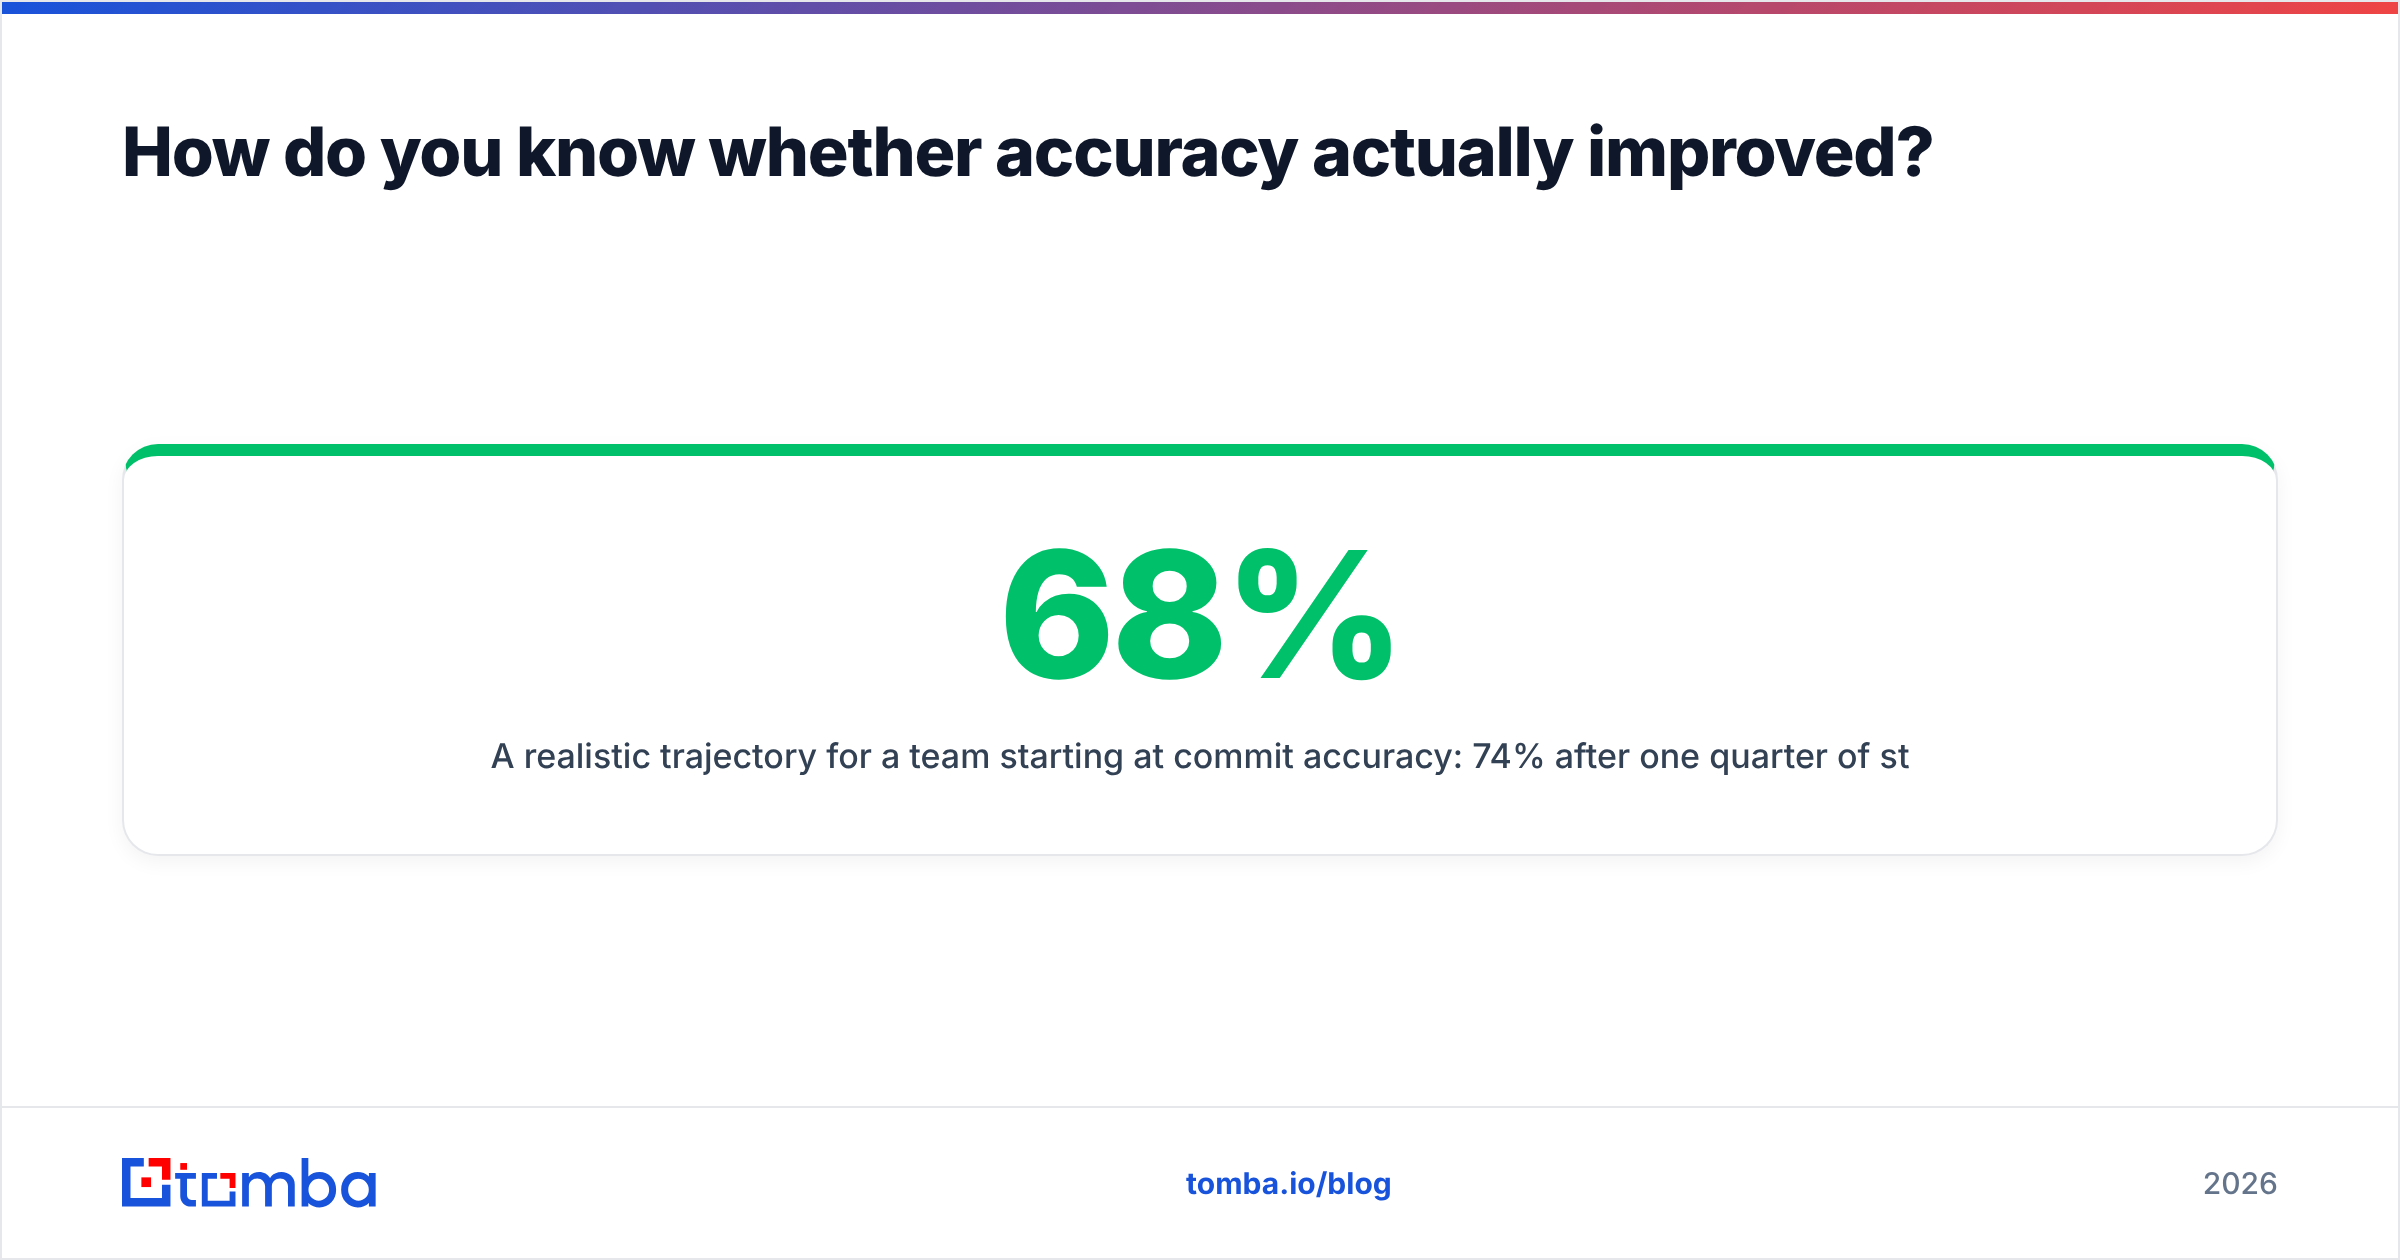
A realistic path for a team starting at 68% commit accuracy: 74% after one quarter of stage discipline, 82% once data hygiene and weekly inspection land, and 88%+ after you recompute weighted conversion rates from clean history. Nobody holds 95% forever, because markets move. But the 60s are a choice, not a fate.
Start with the data layer#
If you act on one item from this guide on how to improve sales forecasting accuracy, make it this one. Check that the people in your pipeline are real, reachable, and current. Multi-threaded deals with verified stakeholders close on schedule. Single-threaded deals built on a bounced address slip, then die.
Use the Tomba Email Finder to fill in the missing decision-makers on every open opportunity. Verify the contacts already sitting in your CRM. Sync the results back into Salesforce or HubSpot so your forecast reads from data that reflects reality. Start on the free tier at 25 searches a month, run it against your current commit list, and see how many of the deals you are counting on have nobody real behind them.
Related guides#
// get started
Find, verify and enrich your first contacts today
Start on the free plan with 25 searches a month, then scale when your team is ready.
Free plan · No credit card required · GDPR & CCPA
Get the Tomba newsletter
Product and data updates
// about the author