How to Increase Sales Revenue in 2026: 9 Proven Plays
Revenue growth is not a motivation problem. It is a math problem with four levers. Here are the nine plays that move those levers, ranked by how fast they pay back.
TL;DR
- Sales revenue only moves through four levers: more qualified opportunities, higher win rate, larger average deal size, and shorter sales cycle. Everything else is a tactic that feeds one of them.
- The fastest payback in most B2B teams is not "more activity" — it is fixing data quality and qualification so existing reps stop burning hours on contacts that were never reachable.
- Expansion revenue from current customers closes 3-5x more reliably than net-new logos, and most teams under-invest in it.
- Pricing is the most under-used lever: a 3% price increase usually beats a 3% volume increase because it drops straight to margin.
- Run the plays in payback order — data hygiene and ICP tightening first (weeks), then win-rate work (a quarter), then pricing and expansion (two quarters).
Revenue growth is a math problem, not a motivation problem. If you want to know how to increase sales revenue in a way that survives next quarter's board meeting, start by admitting that "sell more" is not a strategy. It is a wish.
The number you care about decomposes cleanly:
Revenue = Opportunities × Win Rate × Average Deal Size × (Deals per period)
Every credible growth play pulls on one of those four terms. This guide walks through the nine that produce the most reliable lift in B2B, ranked by how quickly they pay back — plus the diagnostic to figure out which one your team actually needs.
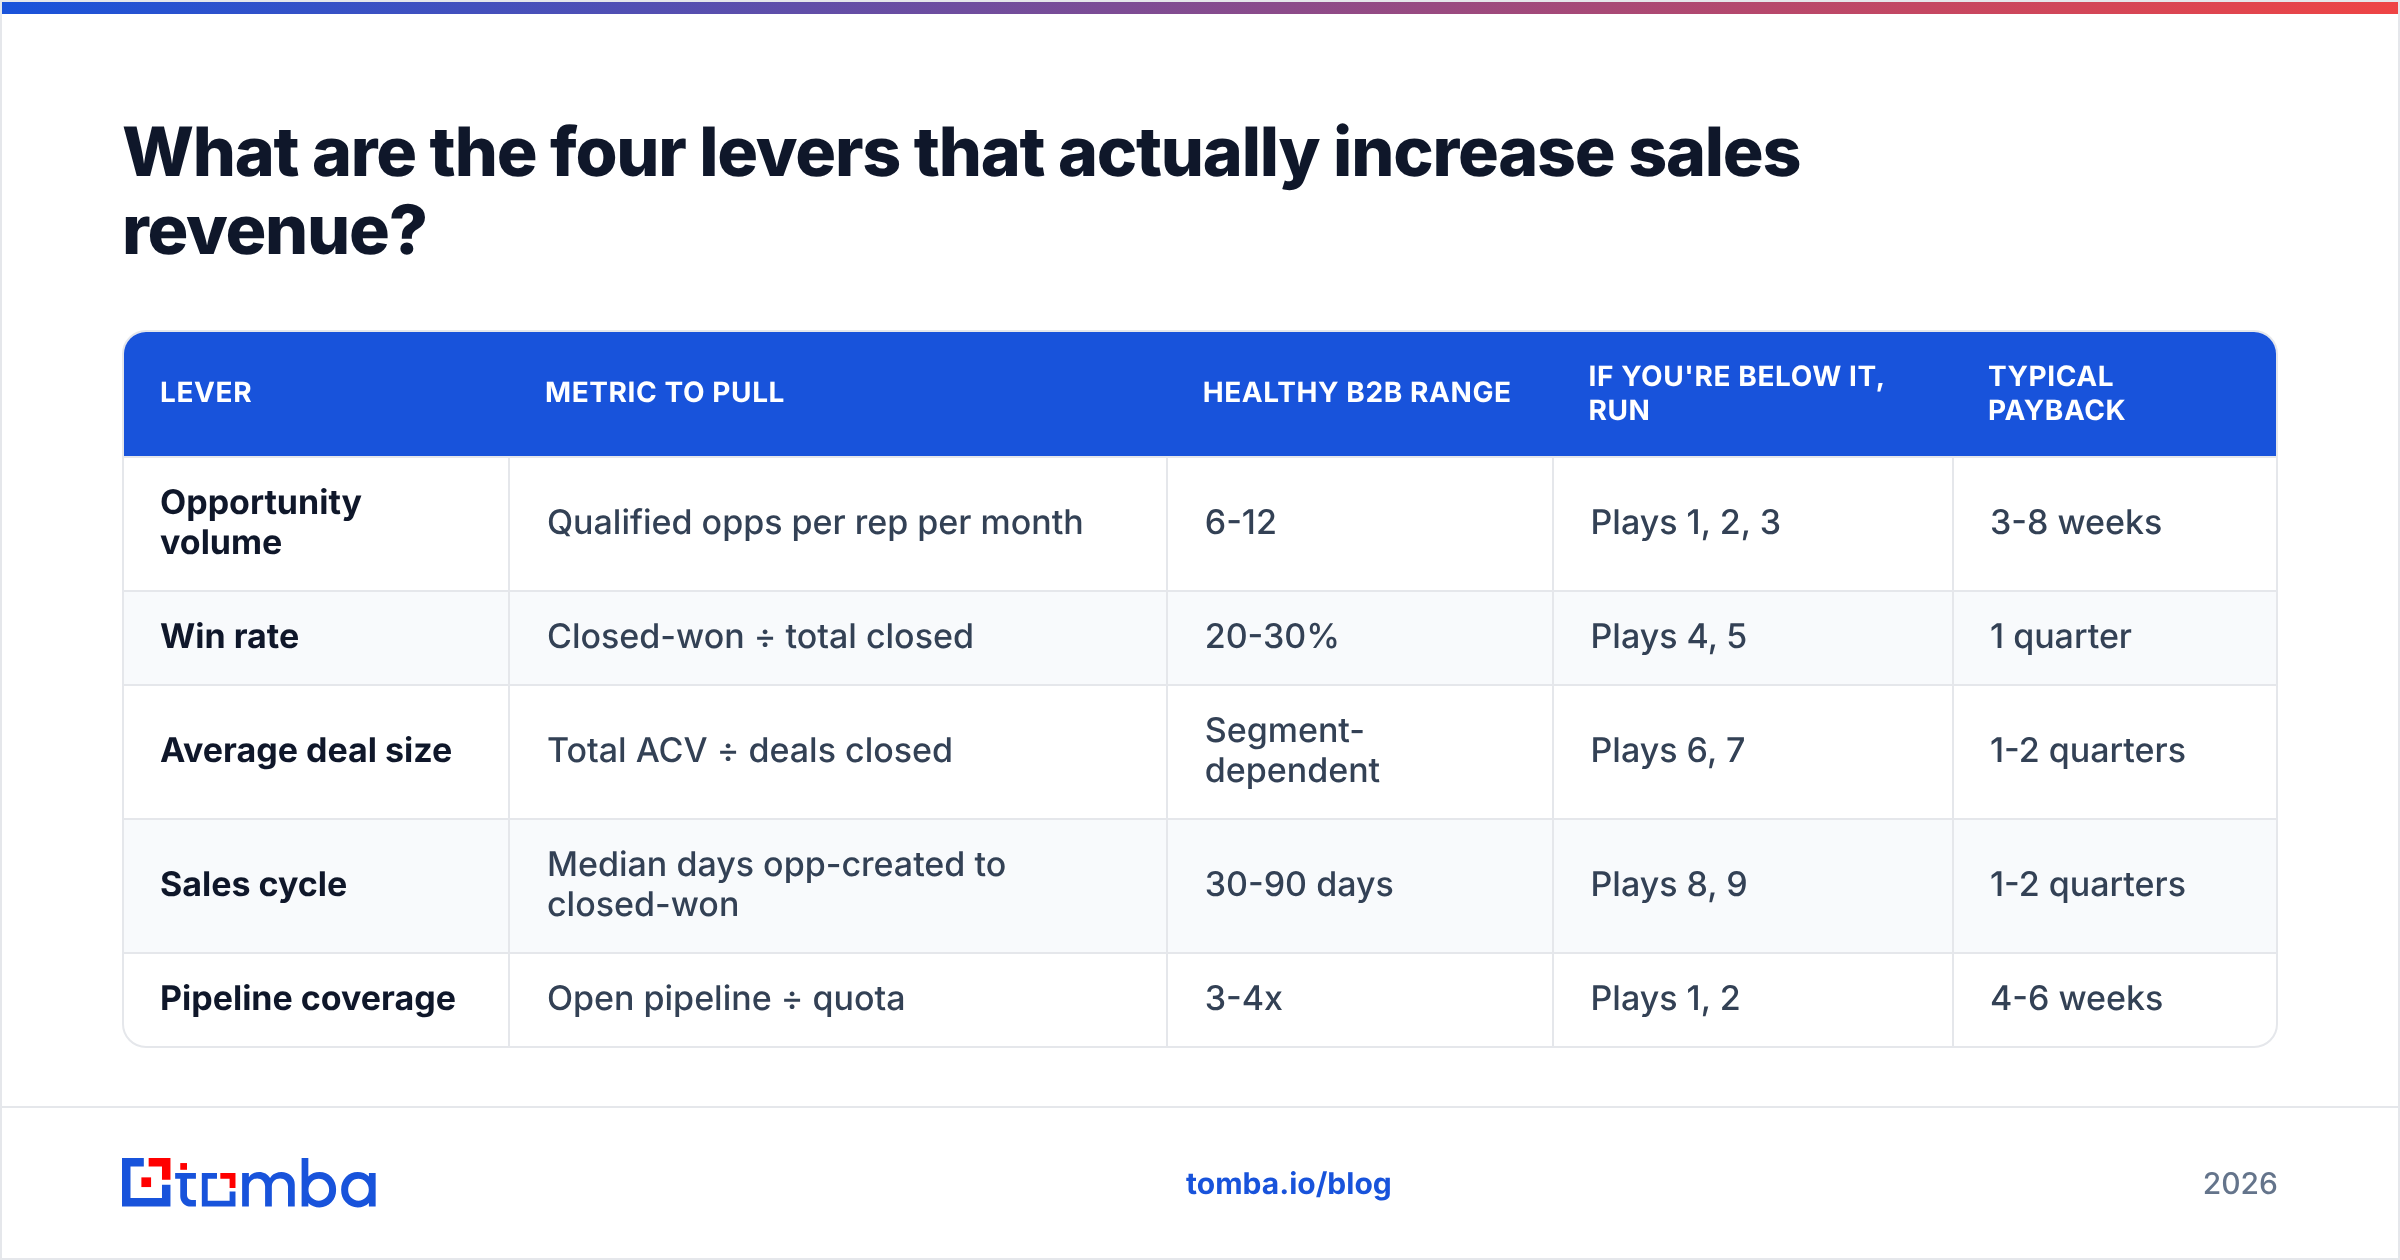
What are the four levers that actually increase sales revenue?#
Before you pick a play, find the broken term. Most teams instinctively reach for "more opportunities" because it feels like effort, when their real constraint is a 14% win rate or a 97-day cycle.
Here is the diagnostic table. Pull the last four quarters of closed-won and closed-lost data, calculate each metric, and compare against typical B2B SaaS ranges.
| Lever | Metric to pull | Healthy B2B range | If you're below it, run | Typical payback |
|---|---|---|---|---|
| Opportunity volume | Qualified opps per rep per month | 6-12 | Plays 1, 2, 3 | 3-8 weeks |
| Win rate | Closed-won ÷ total closed | 20-30% | Plays 4, 5 | 1 quarter |
| Average deal size | Total ACV ÷ deals closed | Segment-dependent | Plays 6, 7 | 1-2 quarters |
| Sales cycle | Median days opp-created to closed-won | 30-90 days | Plays 8, 9 | 1-2 quarters |
| Pipeline coverage | Open pipeline ÷ quota | 3-4x | Plays 1, 2 | 4-6 weeks |
The rule: fix the worst-performing lever first, not the one you enjoy working on. A team with a 34% win rate and 2x coverage has a top-of-funnel problem. A team with 6x coverage and a 12% win rate has a qualification problem, and adding leads will make it worse by diluting rep attention.

How do you increase qualified opportunity volume without hiring?#
Three plays, in payback order.
Play 1 — Kill the data tax. The average outbound rep loses 21% of their week to research and list building, according to repeated time-allocation studies summarized by HubSpot's sales research. Worse, a chunk of the contacts they do build bounce, which drags sender reputation down and quietly suppresses the deliverability of every other email they send.
The fix is boring and it works: source contacts from a verified provider and validate before send rather than after. Running a list through an email verifier before the first touch typically cuts hard bounces to under 2%, which keeps your domain out of filtering purgatory. If you build lists by company rather than by person, a domain search returns the full addressable contact set for a target account in one call instead of thirty manual lookups.
Expected lift: 15-25% more selling hours per rep, with no headcount added. That is the cheapest opportunity volume you will ever buy.
Play 2 — Tighten the ICP until it hurts. Most teams define their ideal customer profile as "companies who might buy." Redefine it as "companies who bought, stayed, and expanded." Pull your closed-won cohort from the last 18 months, filter to accounts with net revenue retention above 100%, and find the three attributes they share — usually a combination of employee-count band, tech stack, and a triggering event.
Then stop prospecting anything outside it for one full quarter. Teams that do this typically see reply rates roughly double, because relevance goes up and volume goes down.
Play 3 — Add a second channel to the same account list. Email-only sequences plateau. Adding a phone touch and a LinkedIn touch to the same target list lifts account-level connect rates substantially without expanding your list at all. This requires contact data beyond email — a phone finder or LinkedIn finder closes that gap so your multichannel sequence doesn't have holes for half the accounts.
How do you increase win rate on the pipeline you already have?#
Play 4 — Install a hard qualification gate. MEDDIC, MEDDPICC, or a simplified three-question version — the framework matters less than the enforcement. The rule: no opportunity enters Stage 2 without a documented economic buyer, a quantified business pain, and a known decision process.
The uncomfortable side effect is that your pipeline will shrink by 20-40% the first month. That is the point. You are removing deals that were never going to close but were consuming forecast attention, discount approvals, and demo hours. Win rate rises because the denominator gets honest.
Play 5 — Run loss reviews, not win reviews. Everyone celebrates wins and learns nothing. Interview five recent losses per quarter — the actual buyer, not your rep's memory of the buyer. Ask one question: "At what point did we stop being the likely choice?"
The answers cluster into three or four fixable patterns almost every time: a missing integration, a pricing model mismatch, a slow security review, or a competitor's proof point you had no answer for. Fix the top pattern and win rate moves by several points within two quarters.
Does raising prices actually increase sales revenue?#
Yes, and it is usually the highest-leverage play on this list — which is exactly why it gets deferred.
Play 6 — Take a disciplined price increase. A 3% price increase on a business with 60% gross margin adds more profit than a 3% volume increase, because volume carries cost of delivery and price does not. Gartner's pricing research has made this point for years, and it still surprises most sales leaders.
The mechanics that make it survivable:
- Grandfather existing customers for one renewal cycle. You are pricing new business, not punishing loyalty.
- Raise the list, protect the floor. Move list price up 8-12% and tighten discount approval thresholds. Realized price rises even if list price gets discounted back to where it was.
- Add a lower tier as an anchor. A cheaper entry option makes the mid-tier read as reasonable and catches deals that would otherwise be no-decision.
- Instrument win rate weekly for eight weeks post-change. If win rate drops more than 3 points on qualified deals, you moved too far — roll back the delta, not the whole change.
- Train reps on one value sentence per persona. Price objections are usually value-articulation failures wearing a costume.
Play 7 — Sell to the customers you already have. Expansion revenue is the least glamorous line on this page and the most reliable. Existing customers convert at multiples of cold prospects because trust, procurement, and integration costs are already paid.
Practical version: build a monthly "expansion signal" list from product usage — accounts hitting seat limits, accounts adding a new department, accounts whose headcount grew 20%+ since signing. Contact enrichment on those accounts surfaces the new stakeholders who joined since your original deal, which is where most expansion conversations actually start.
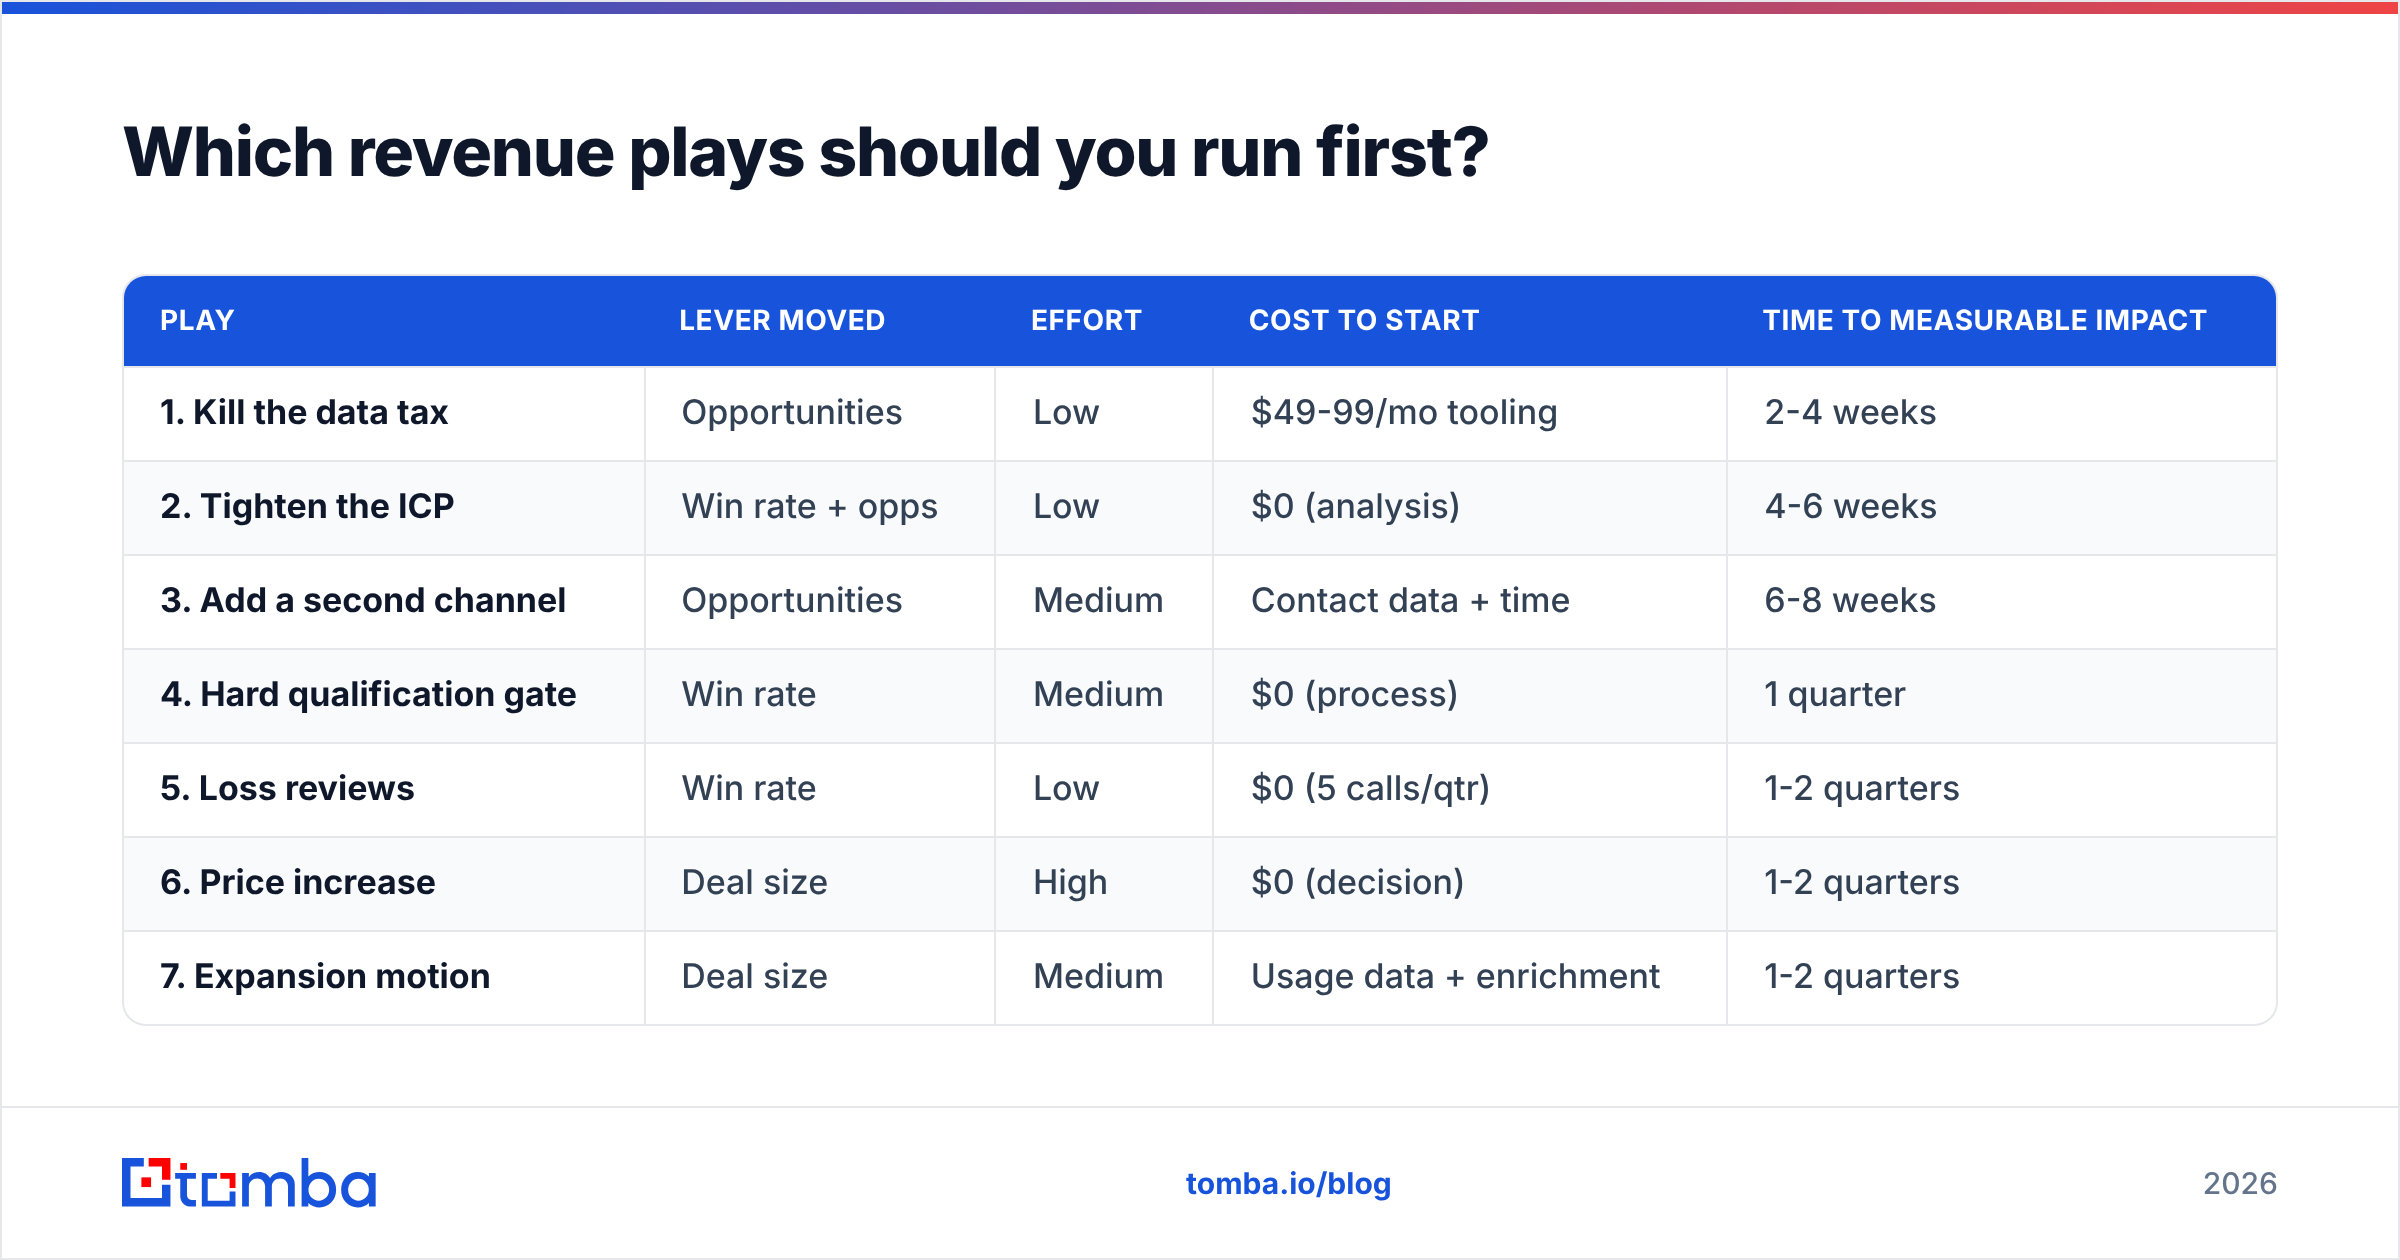
Which revenue plays should you run first?#
Sequence by payback speed, not by ambition. Here is how the nine plays compare on effort, cost, and time-to-impact.
| Play | Lever moved | Effort | Cost to start | Time to measurable impact |
|---|---|---|---|---|
| 1. Kill the data tax | Opportunities | Low | $49-99/mo tooling | 2-4 weeks |
| 2. Tighten the ICP | Win rate + opps | Low | $0 (analysis) | 4-6 weeks |
| 3. Add a second channel | Opportunities | Medium | Contact data + time | 6-8 weeks |
| 4. Hard qualification gate | Win rate | Medium | $0 (process) | 1 quarter |
| 5. Loss reviews | Win rate | Low | $0 (5 calls/qtr) | 1-2 quarters |
| 6. Price increase | Deal size | High | $0 (decision) | 1-2 quarters |
| 7. Expansion motion | Deal size | Medium | Usage data + enrichment | 1-2 quarters |
| 8. Compress the cycle | Deals per period | Medium | $0-low | 1 quarter |
| 9. Fix the handoff | All four | Medium | $0 (process) | 1-2 quarters |
Play 8 — Compress the sales cycle. Median cycle length is the most ignored revenue multiplier. Cutting a 90-day cycle to 70 days means each rep runs roughly 28% more cycles per year with the same win rate. The three biggest time sinks are almost always: waiting for a second stakeholder to join, security/legal review, and unscheduled next steps. Fix them by requiring a named next meeting on the calendar before any call ends, sending your security documentation package proactively at Stage 2 instead of reactively at Stage 4, and multithreading from the first meeting.
Play 9 — Fix the marketing-to-sales handoff. Leads that sit for 24 hours convert at a fraction of leads contacted within an hour. The most common cause is not laziness — it is that the routing rules and the enrichment step are asynchronous. Enrich at the point of form fill, route on firmographics, and set a hard SLA with visible reporting. This is the core of a functioning revenue operations practice, and it usually recovers 5-10% of inbound conversion with no new spend.
How do you measure whether any of this worked?#
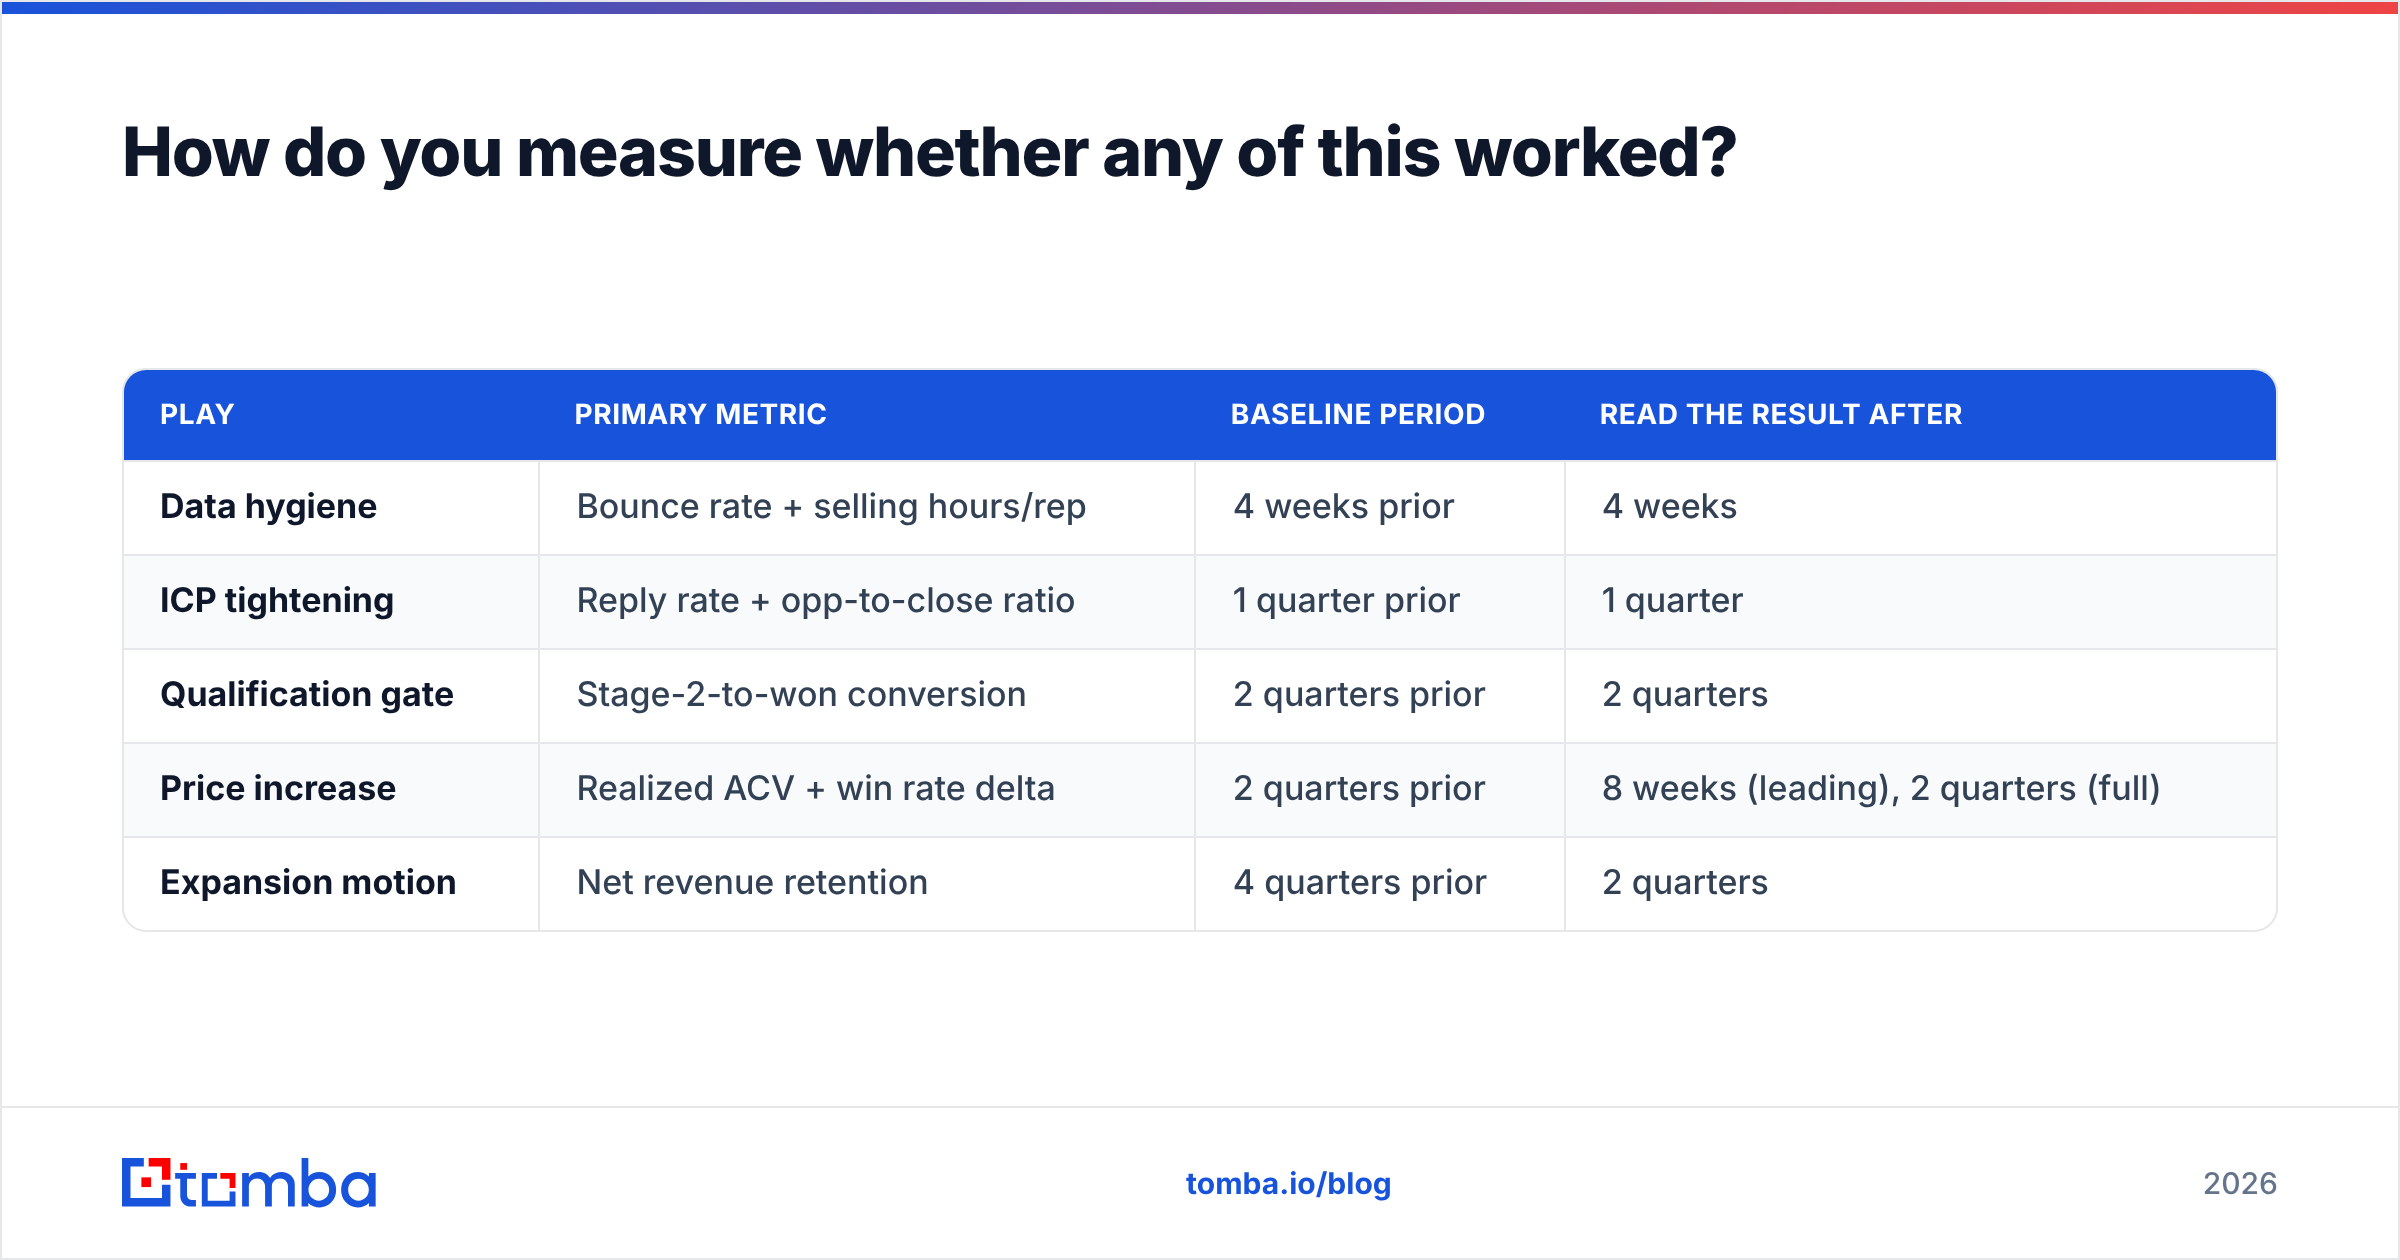
Pick one primary metric per play and instrument it before you start. Retrospective attribution is how good initiatives get killed.
| Play | Primary metric | Baseline period | Read the result after |
|---|---|---|---|
| Data hygiene | Bounce rate + selling hours/rep | 4 weeks prior | 4 weeks |
| ICP tightening | Reply rate + opp-to-close ratio | 1 quarter prior | 1 quarter |
| Qualification gate | Stage-2-to-won conversion | 2 quarters prior | 2 quarters |
| Price increase | Realized ACV + win rate delta | 2 quarters prior | 8 weeks (leading), 2 quarters (full) |
| Expansion motion | Net revenue retention | 4 quarters prior | 2 quarters |
Two guardrails. First, never change two levers in the same eight-week window on the same segment — you lose the ability to attribute the result. Second, watch the counter-metric. A price increase that lifts ACV while quietly cratering win rate is a loss disguised as a win, and it takes two quarters to show up in bookings.
Peer benchmarks help calibrate what "good" looks like. Category reviews on G2 and buyer discussions there are more useful than vendor-published averages, which are selected to flatter.
What tooling stack supports this without bloat?#
You do not need eleven tools. You need clean contact data, a sequencer, a CRM your reps actually update, and a reporting layer. Most teams over-buy at the top of the stack and under-buy at the data layer, which is backwards — every downstream tool inherits the quality of the data you feed it.
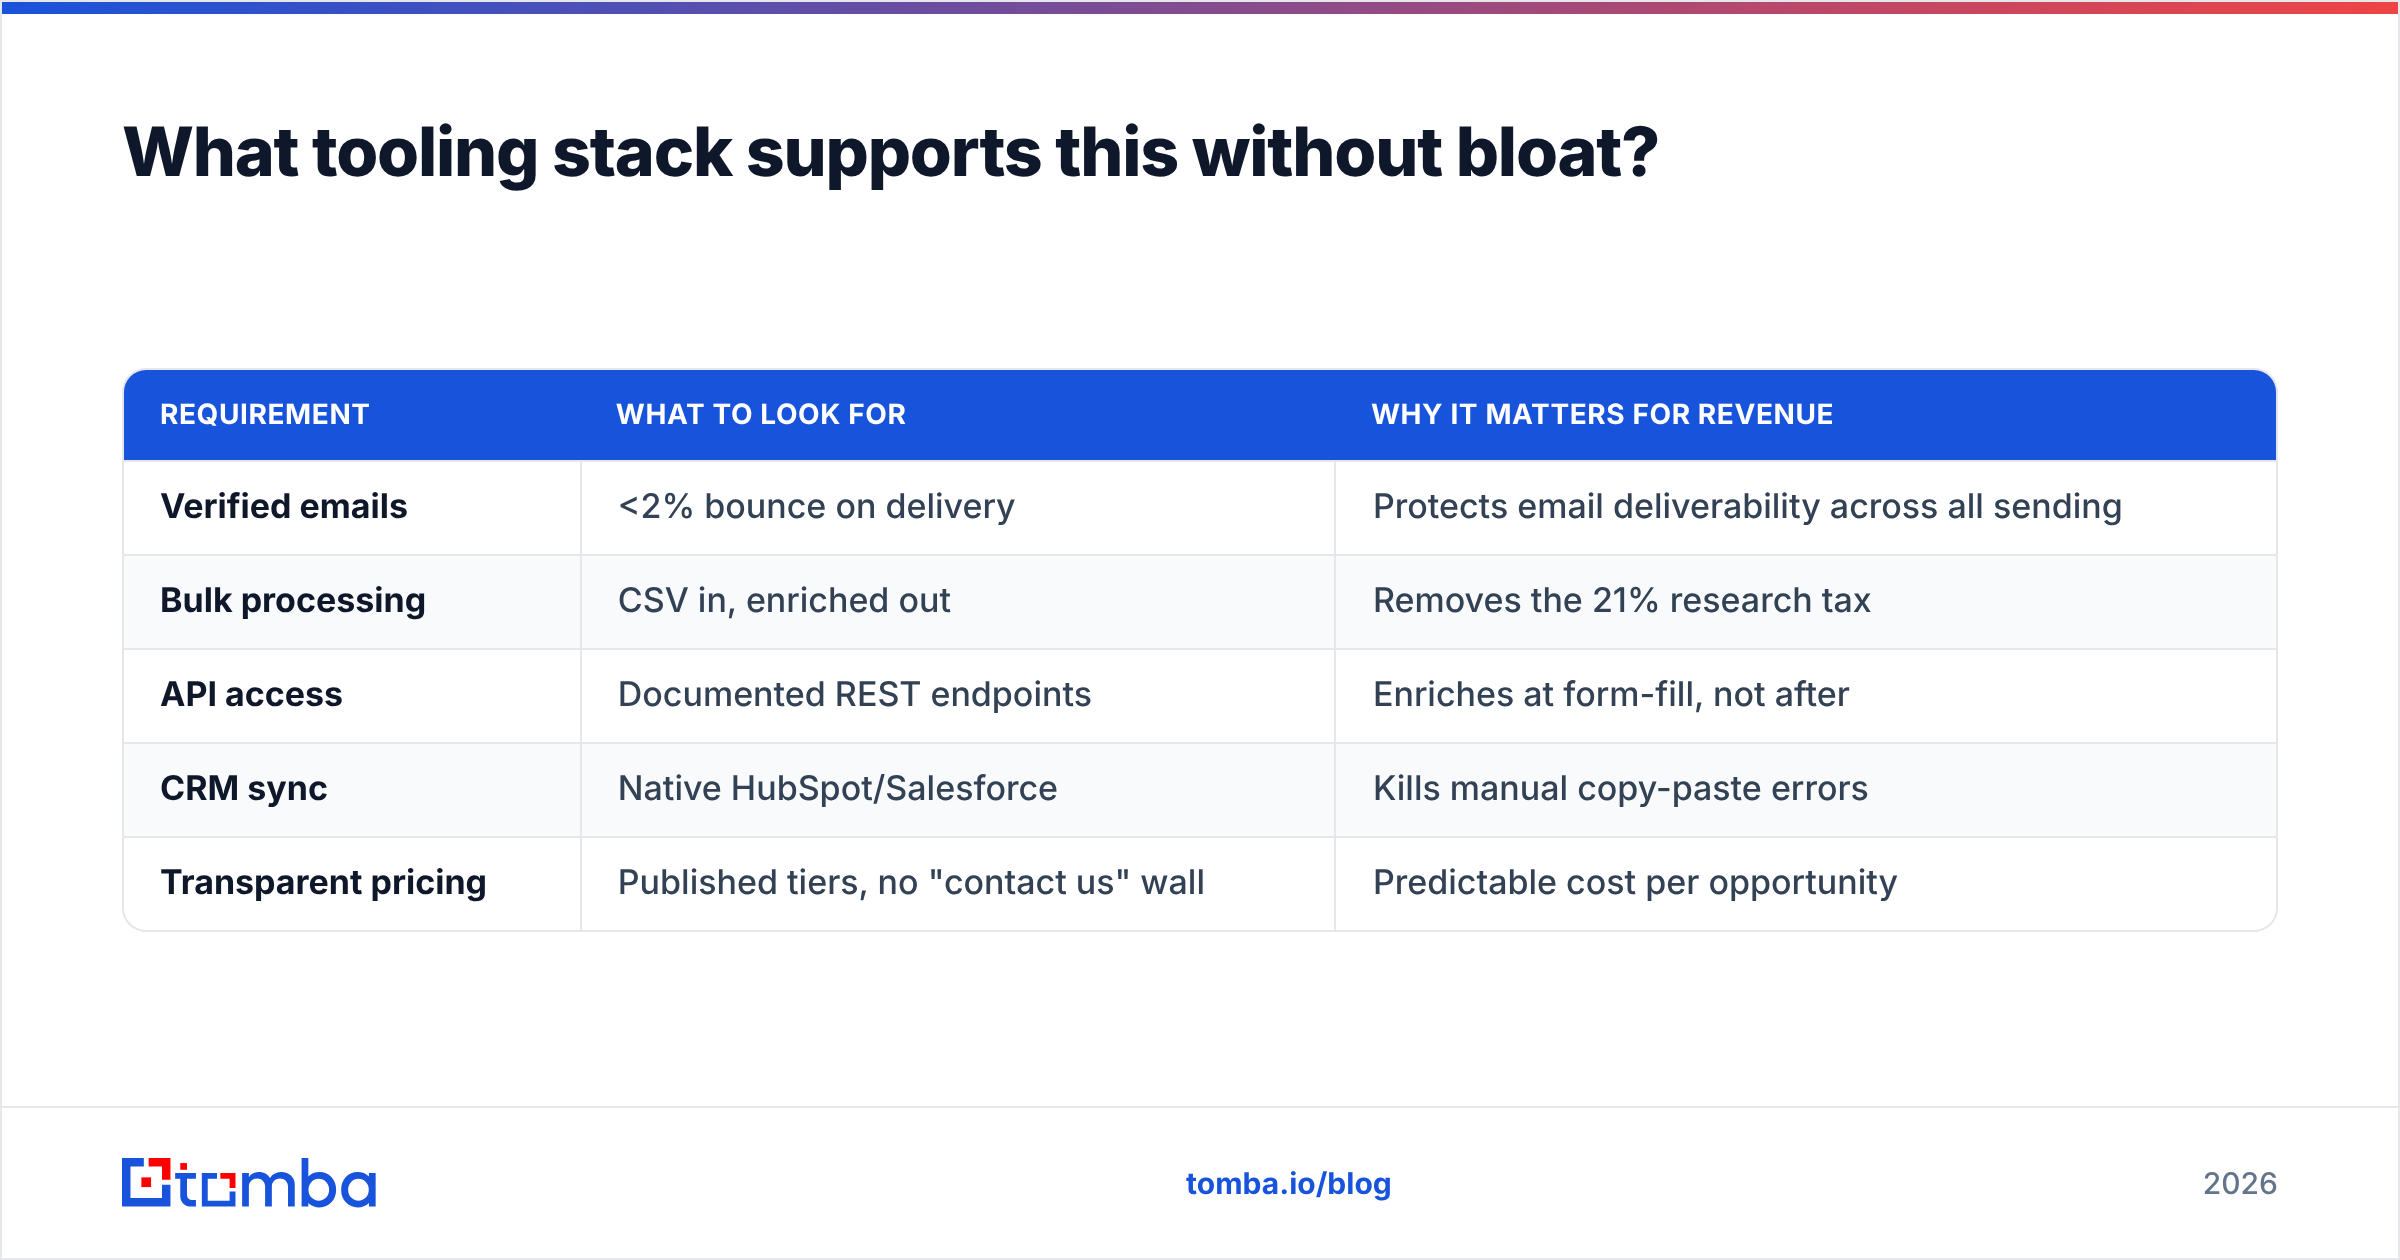
Compare what you are paying at the data layer against what you get:
| Requirement | What to look for | Why it matters for revenue |
|---|---|---|
| Verified emails | <2% bounce on delivery | Protects email deliverability across all sending |
| Bulk processing | CSV in, enriched out | Removes the 21% research tax |
| API access | Documented REST endpoints | Enriches at form-fill, not after |
| CRM sync | Native HubSpot/Salesforce | Kills manual copy-paste errors |
| Transparent pricing | Published tiers, no "contact us" wall | Predictable cost per opportunity |
Providers worth evaluating at this layer span the range: Tomba, BookYourData for pre-built list purchase, and the broader enrichment platforms if you need firmographic depth beyond contact records. The right pick depends on whether you build lists continuously or buy them in batches. Check Tomba pricing against your monthly contact volume — the Free tier covers 25 searches a month for testing, Starter runs $49/mo, and Growth is $99/mo, which is where most 3-8 rep teams land.
Where should you start this week?#
Run the diagnostic table at the top of this post. Calculate your four levers against the healthy ranges. Whichever one is furthest below range is your constraint, and the plays listed next to it are your next 90 days. Ignore the rest until the constraint moves.
For most teams reading this, the answer will be Play 1 — because it is the cheapest, the fastest to show a result, and the one that makes every subsequent play work better. Clean data raises reply rates, protects deliverability, and gives your win-rate and pricing experiments a signal clean enough to read.
Start there. Use the Tomba Email Finder to build a verified contact list for your tightened ICP, measure your bounce rate and selling hours against last month's baseline, and only then move to the next lever. The free tier is enough to test the workflow on a single target account list before you commit a dollar.
Related guides#
Ready to find emails that actually work?
Join 150,000+ professionals who stopped guessing and started sending. Free credits on signup — no credit card required.
Get the Tomba newsletter
Practical outbound tactics and product updates — once every two weeks.
About the author