How to Increase Sales Velocity: The 2026 Operator Playbook
Sales velocity is four numbers, not a vibe. Here is the exact formula, the four levers you can actually move, and which one pays back fastest in 2026.
Want to know how to increase sales velocity? Start with the math, not the tactics. Sales velocity is four numbers, multiplied and divided. Move one of them and your revenue per day moves too. This post shows which number to move first — and why most teams pick the wrong one.
TL;DR
- Sales velocity = (Opportunities × Average Deal Value × Win Rate) ÷ Sales Cycle Length. Four variables, nothing else.
- Most teams pull the "more opportunities" lever first. It is the slowest and most expensive of the four.
- Win rate and cycle length compound hardest. A 5-point win-rate gain plus a 10-day shorter cycle usually beats a 25% pipeline increase.
- Bad contact data taxes every variable at once. Wrong emails pad your opportunity count with dead deals, and they stretch cycle time by weeks.
- Fix order that works: data quality → qualification discipline → deal value → volume. Run it over 30 days, not all at once.
What is sales velocity, exactly?#
Sales velocity is the new revenue your pipeline produces per day. Think of a factory line. It does not matter how much raw material you push in the front if the machines jam halfway down. Velocity measures throughput, not input.
The formula every RevOps team uses:
Sales Velocity = (Number of Opportunities × Average Deal Value × Win Rate) ÷ Sales Cycle Length in Days
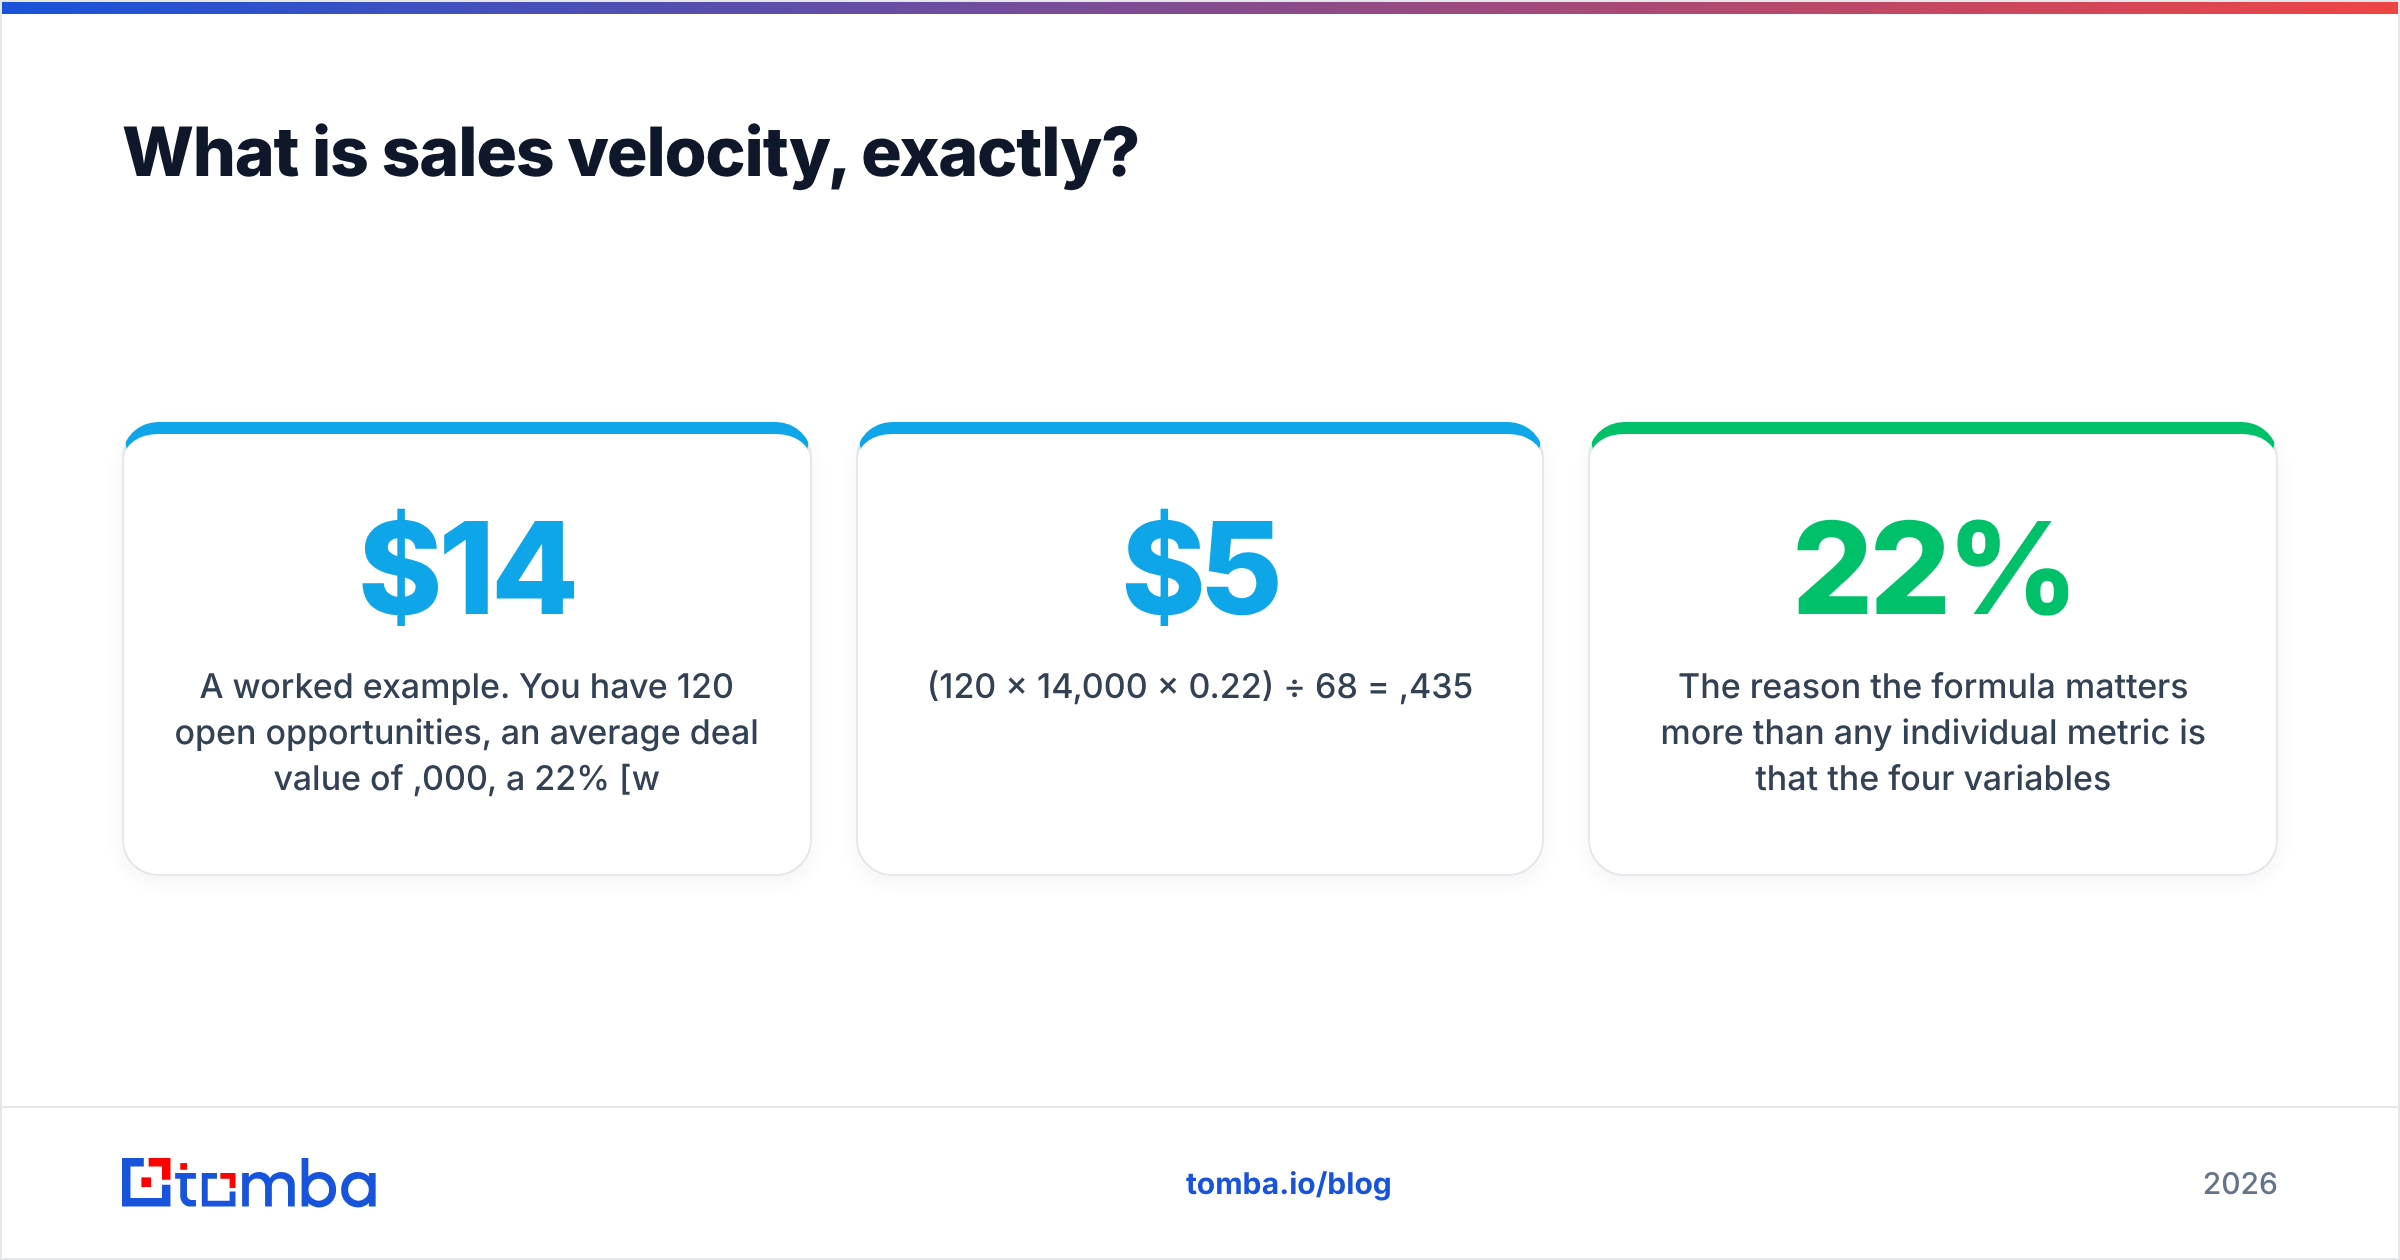
A worked example. You have 120 open opportunities, an average deal value of $14,000, a 22% win rate, and a 68-day sales cycle:
(120 × 14,000 × 0.22) ÷ 68 = $5,435 per day
That is your baseline. Every tactic in this post is judged by one question: does it move that number?
The formula beats any single metric because the four variables interact. Chase pipeline coverage on its own and velocity often falls. You add 40 low-fit opportunities. Win rate slips from 22% to 16%. Cycle length stretches because reps are spread thin. The formula catches that trade-off. A pipeline dashboard does not.
How to increase sales velocity: which lever comes first?#
Here is the part most articles skip. The four levers are not equal. They differ in cost, in time to impact, and in how much of the outcome you control.
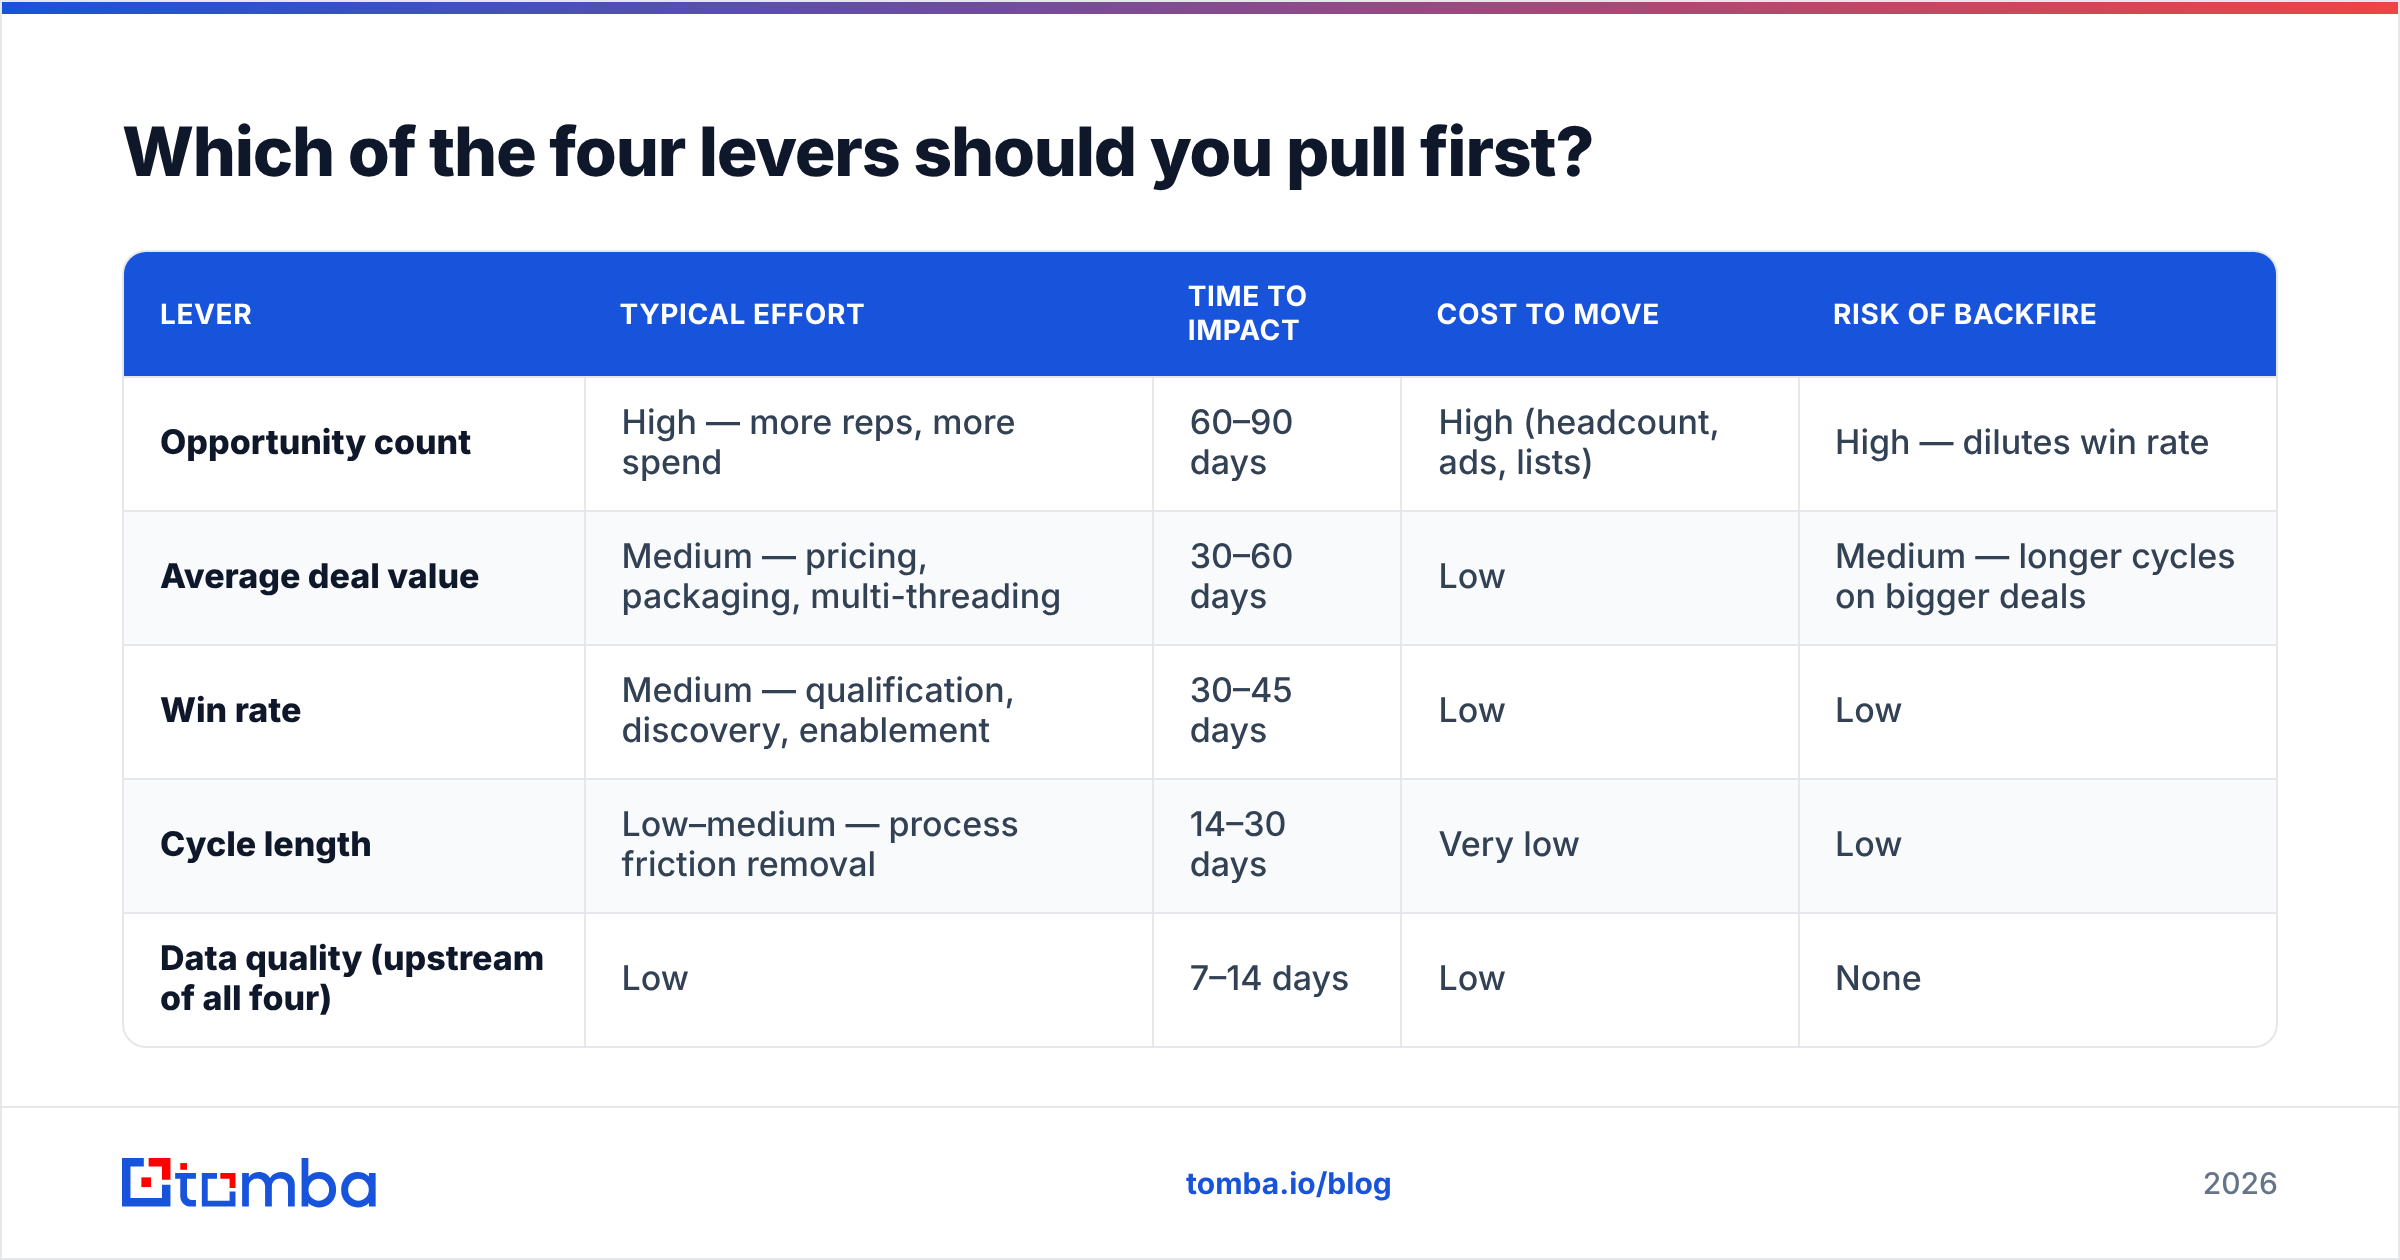
| Lever | Typical effort | Time to impact | Cost to move | Risk of backfire |
|---|---|---|---|---|
| Opportunity count | High — more reps, more spend | 60–90 days | High (headcount, ads, lists) | High — dilutes win rate |
| Average deal value | Medium — pricing, packaging, multi-threading | 30–60 days | Low | Medium — longer cycles on bigger deals |
| Win rate | Medium — qualification, discovery, enablement | 30–45 days | Low | Low |
| Cycle length | Low–medium — process friction removal | 14–30 days | Very low | Low |
| Data quality (upstream of all four) | Low | 7–14 days | Low | None |
Read that table again with cost-per-point in mind. Cycle length and data quality are the cheapest and fastest levers. Almost nobody starts there. They ask for more SDRs instead.
The four-lever priority order for most B2B teams in 2026:
- Clean the contact data feeding the funnel. Wrong emails and dead phone numbers create phantom pipeline. You cannot measure the other three levers until this is fixed.
- Tighten qualification. Fewer, better opportunities lift win rate and shorten cycles at the same time. It is the only lever that improves two variables at once.
- Raise deal value through packaging and multi-threading. It costs less than winning new logos, and existing buyers already trust you.
- Then, and only then, add volume. Volume on a leaky funnel is a tax, not an investment.
How does bad data quietly destroy sales velocity?#
Nobody puts this lever on the whiteboard. It breaks all four variables at once.
Opportunity count gets inflated with ghosts. Say 18% of your prospect emails bounce or land in an abandoned mailbox. Those contacts still sit in your CRM as "engaged" or "attempting contact." Your opportunity count looks healthy. Those records then age forever without resolving.
Win rate drops. A rep works a list where one in five addresses is invalid. That burns close to a day a week on people who do not exist. It is time not spent on discovery calls with real buyers.
Cycle length balloons. The biggest cycle-stretcher in mid-market B2B is not procurement. It is reaching the wrong person first. When your first contact is a departed employee or a generic info@ alias, you lose two to four weeks before you meet the real decision maker.
Deal value shrinks. Single-threaded deals close smaller. If you can only find one contact at an account, you cannot multi-thread, and you cannot sell to the buying committee.
The fix is dull, but it works: verify before you sequence. Run every list through an email verifier before it touches your sequencing tool. Then use domain search to find the three to five people at each account who actually own the problem. A scraper usually surfaces one name, and it is rarely the right one.
Teams that add a verification step before outbound often see bounce rates fall from double digits to under 3%. That shows up in email deliverability, in reply rate, and finally in cycle length.
Want a concrete diagnostic? Pull 200 random contacts from your open opportunities, verify them, and count how many are invalid. Multiply that percentage by your total open pipeline. That is your phantom pipeline number. It is usually bigger than the leadership team expects.
How do you shorten the sales cycle without cutting corners?#
Cycle length is the denominator, so it carries the most leverage. Cut a 68-day cycle to 55 days and velocity rises 24% with zero new pipeline.
Here is where the days go, and what to do about each:
- Time to first meaningful contact (typical: 8–14 days). Verify contact data upfront and call the same day you email. A phone finder paired with email halves the "waiting for a reply" dead zone, because you run two channels at once instead of one after the other.
- Discovery-to-demo gap (typical: 6–10 days). Book the demo on the discovery call itself, with a calendar open on screen. Never end a call without the next date confirmed.
- Stakeholder discovery (typical: 10–20 days). This is the biggest single sink. Map the buying committee before the first call, not after the demo. Enrich the account, find finance, security, and the economic buyer, then name them out loud in discovery: "who else usually weighs in on this?"
- Security and procurement review (typical: 7–25 days). Pre-load your SOC 2 report, DPA, and security questionnaire answers into a shared link. Send it at proposal stage, before anyone asks.
- Signature (typical: 3–9 days). Send the contract with the proposal, not after the verbal yes.
Three of those five fixes change the order of steps, not the skill of your reps. That is why cycle length is cheap to move. You are not retraining anyone. You are resequencing.
Salesforce research on sales productivity keeps finding the same thing: reps spend under a third of their time actually selling (Salesforce State of Sales). The rest goes to admin, research, and data entry. Every hour you win back from manual prospect research compresses cycle time across every open deal.
Can you raise win rate and deal value at the same time?#
Yes. The mechanism is the same for both: multi-threading.
A single-threaded deal has one champion and one contact. It is the most fragile thing in B2B sales. Your champion changes jobs, goes on leave, or loses budget authority, and the deal dies with no warning.
Deals with four or more engaged contacts close at higher rates and at larger values. Most enterprise sales research shows the same pattern, including Gartner's B2B buying research, which puts the typical buying group at six to ten stakeholders.
A practical multi-threading sequence:
- Map before you pitch. Use data enrichment or LinkedIn to spot the likely committee: economic buyer, technical evaluator, end user, and the blocker (usually security or finance).
- Ask your champion for the intro. Do not cold-add. "Who owns the security review here? Mind if I loop them in early so we don't lose two weeks later?" This shortens the cycle too.
- Give each persona a different artifact. The end user gets a workflow demo. Finance gets a payback model. Security gets the questionnaire, pre-filled.
- Track thread count as a pipeline metric. If your average is under three contacts per opportunity, that is your win-rate ceiling.
On deal value, the fastest non-pricing move is packaging. Bundle the thing buyers always add in month three into the first contract. You are not raising prices. You are raising the size of what they say yes to.
What does a 30-day sales velocity sprint look like?#
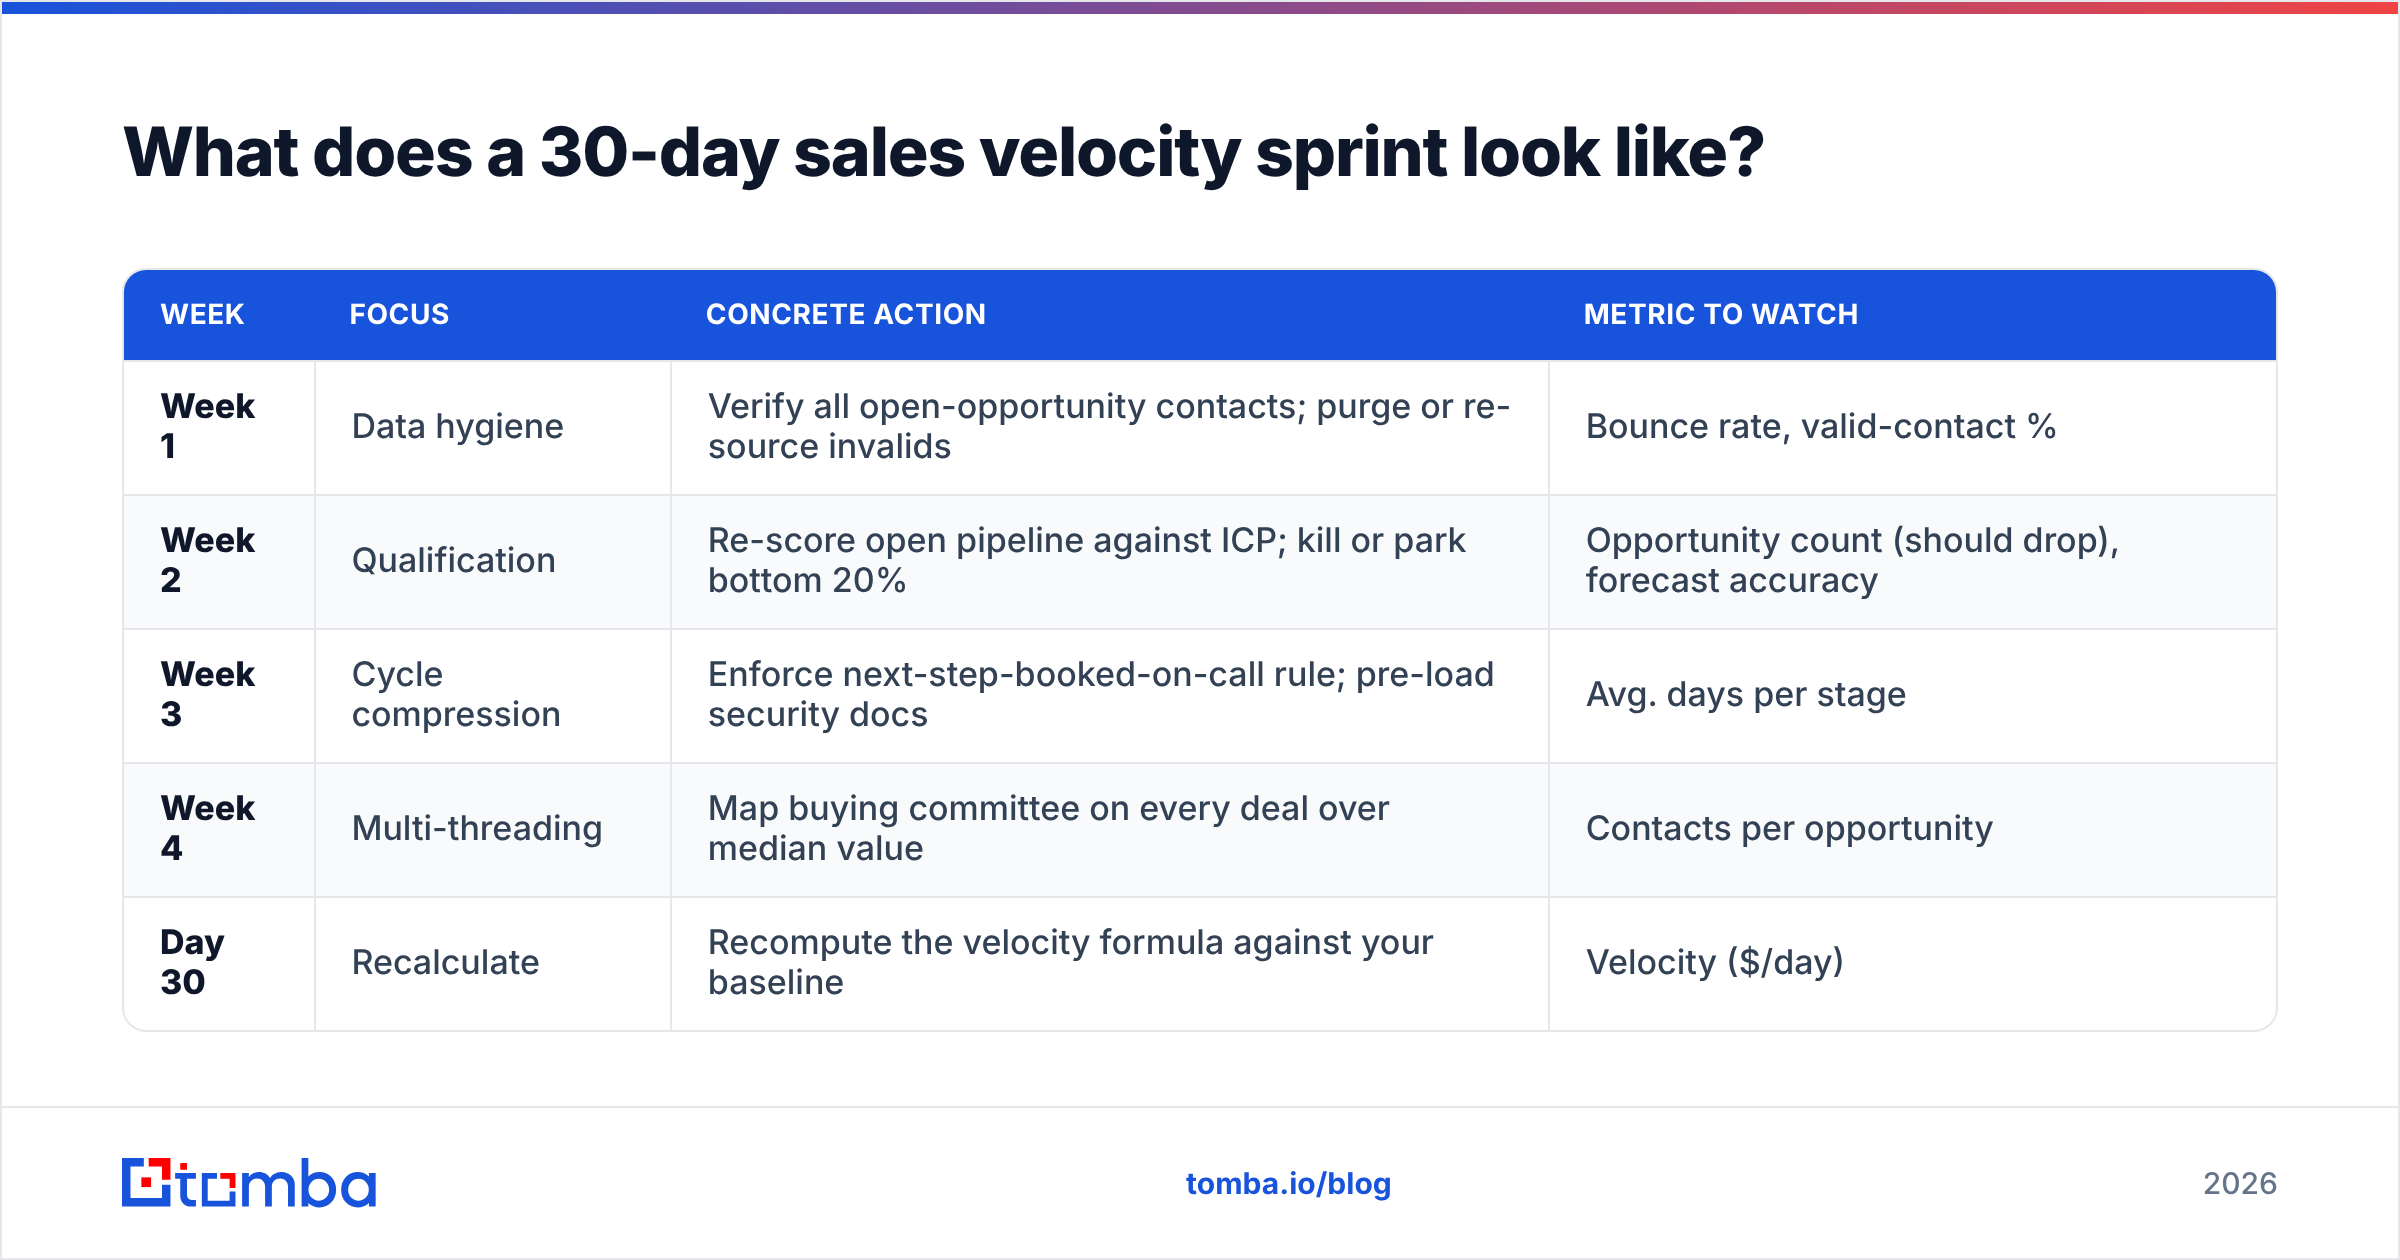
A 30-day sprint is the practical answer to how to increase sales velocity without guessing. Do not run all four levers at once. You will not know what worked. Sequence it:
| Week | Focus | Concrete action | Metric to watch |
|---|---|---|---|
| Week 1 | Data hygiene | Verify all open-opportunity contacts; purge or re-source invalids | Bounce rate, valid-contact % |
| Week 2 | Qualification | Re-score open pipeline against ICP; kill or park bottom 20% | Opportunity count (should drop), forecast accuracy |
| Week 3 | Cycle compression | Enforce next-step-booked-on-call rule; pre-load security docs | Avg. days per stage |
| Week 4 | Multi-threading | Map buying committee on every deal over median value | Contacts per opportunity |
| Day 30 | Recalculate | Recompute the velocity formula against your baseline | Velocity ($/day) |
Two rules make this sprint work.
First, recalculate velocity with the same formula every time. Change the definition mid-sprint and you have measured nothing.
Second, expect opportunity count to fall in week 2 while velocity still rises. That is the whole point. Killing 20 dead deals lifts win rate and shortens the average cycle at once. The formula rewards you for it, even though the pipeline dashboard looks worse.
Which tools actually move each lever?#
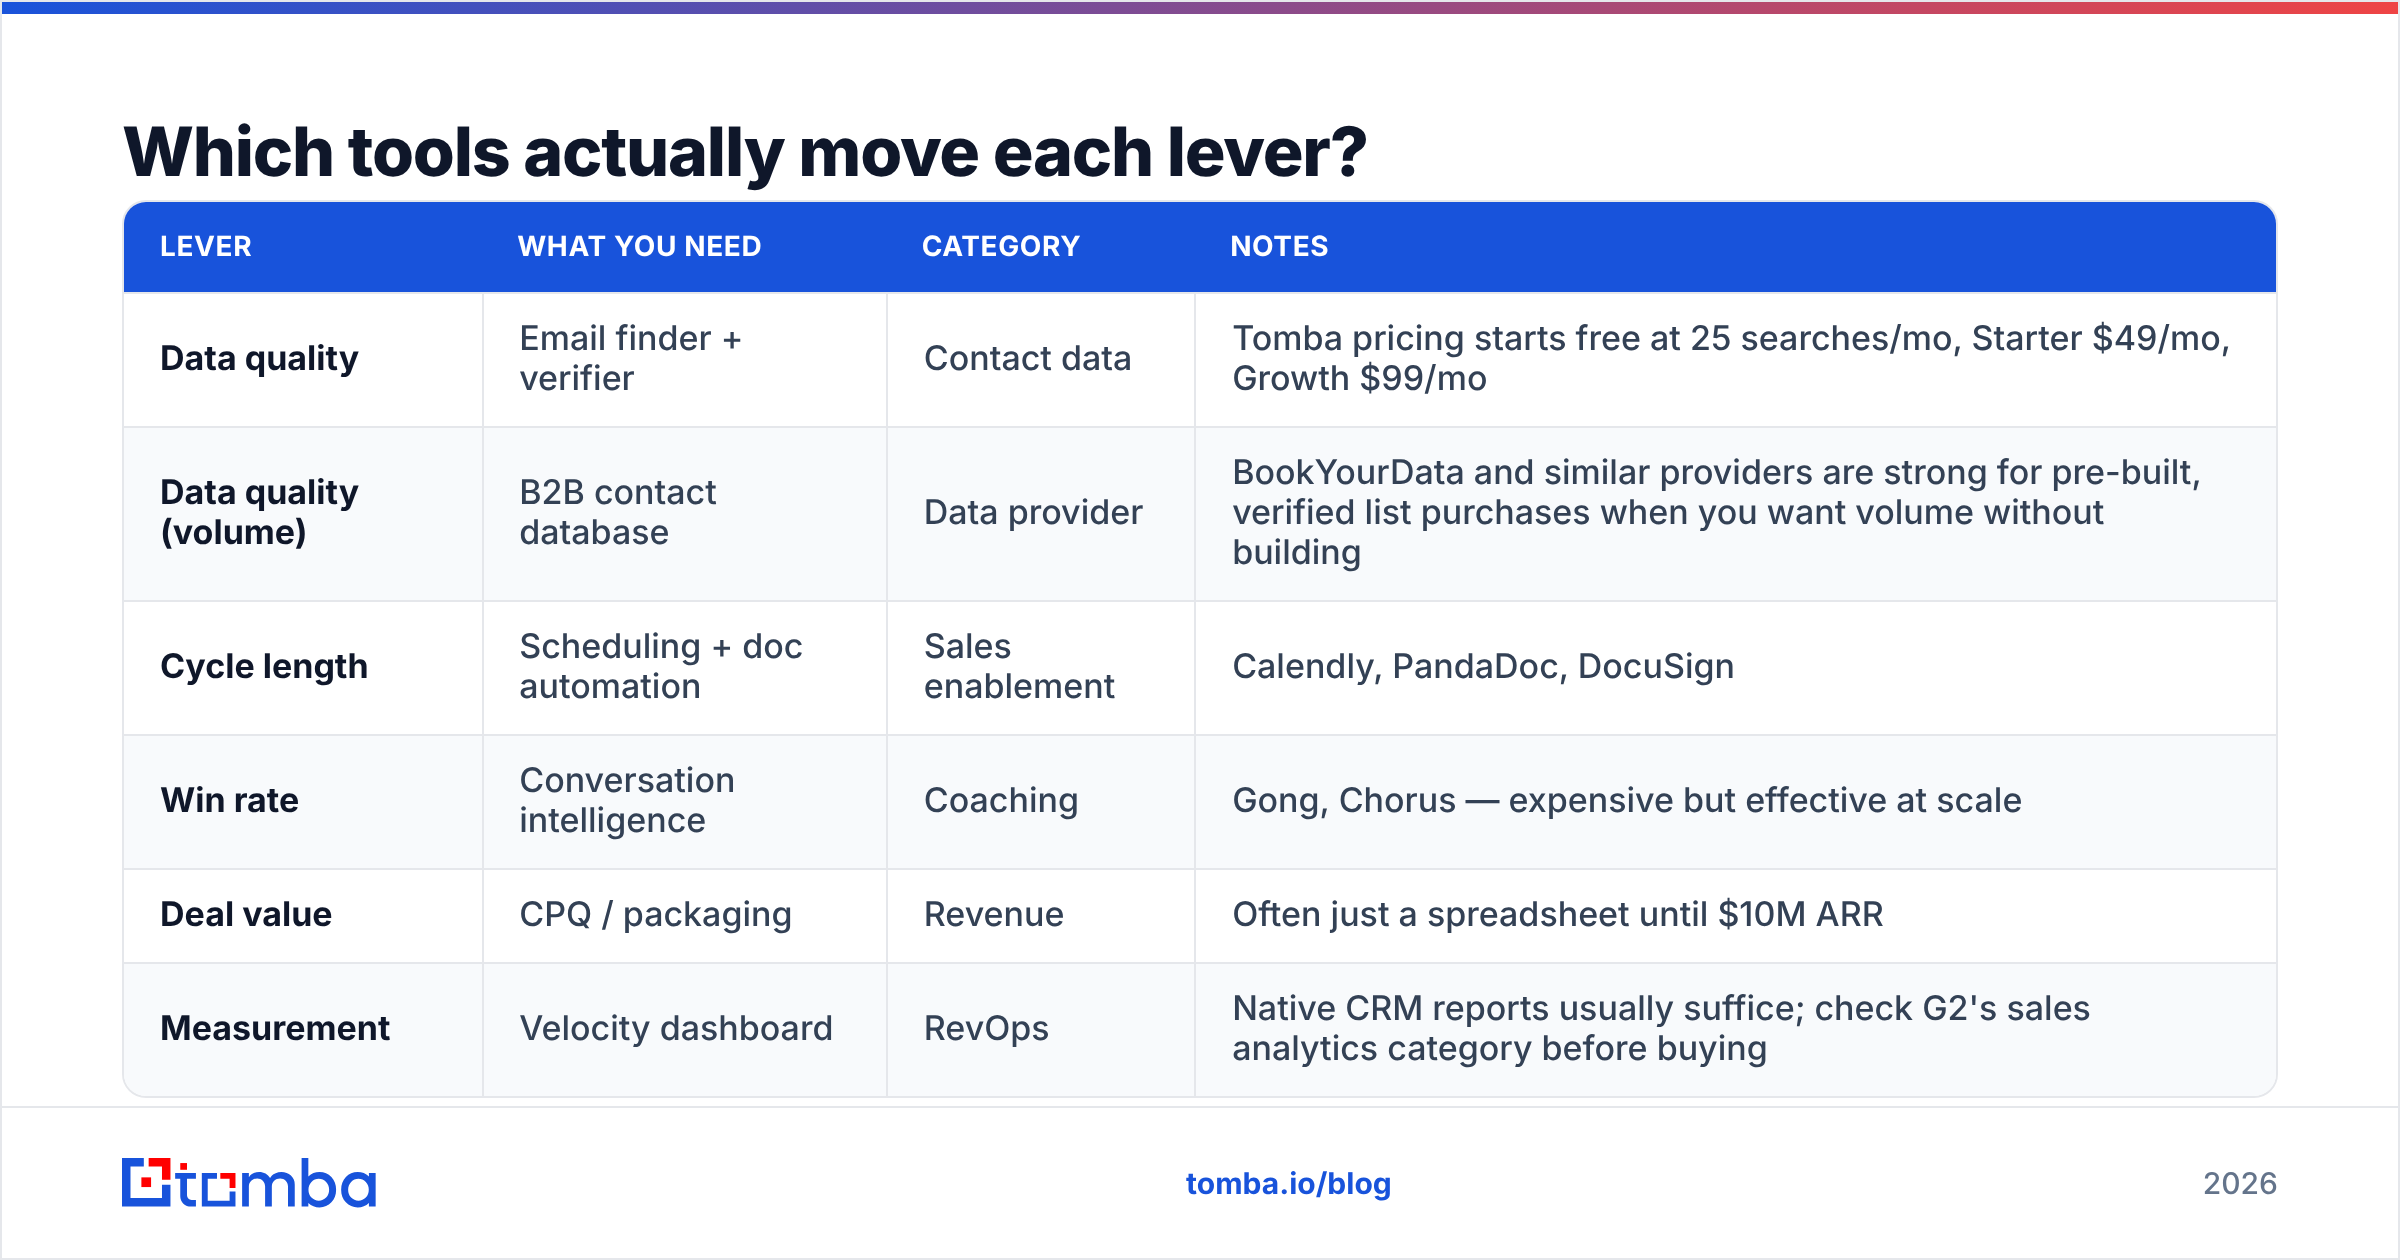
A short, honest map. No single tool moves all four. Anyone who says otherwise is selling you a suite.
| Lever | What you need | Category | Notes |
|---|---|---|---|
| Data quality | Email finder + verifier | Contact data | Tomba pricing starts free at 25 searches/mo, Starter $49/mo, Growth $99/mo |
| Data quality (volume) | B2B contact database | Data provider | BookYourData and similar providers are strong for pre-built, verified list purchases when you want volume without building |
| Cycle length | Scheduling + doc automation | Sales enablement | Calendly, PandaDoc, DocuSign |
| Win rate | Conversation intelligence | Coaching | Gong, Chorus — expensive but effective at scale |
| Deal value | CPQ / packaging | Revenue | Often just a spreadsheet until $10M ARR |
| Measurement | Velocity dashboard | RevOps | Native CRM reports usually suffice; check G2's sales analytics category before buying |
The buying advice is simple: start with the cheapest lever you have not touched. If you have never verified your contact data, that is a $49–$99/month fix with a two-week payback, and it sits upstream of everything else. Conversation intelligence at $1,200+ per seat per year is a fine investment — after your data is clean, not before.
Already running outbound at volume? A bulk email finder plus a verification pass before each campaign is the lowest-effort velocity gain available. Doing account-based work? Data enrichment on target accounts is what makes multi-threading possible at all.
How do you keep velocity from decaying?#
Velocity is not a project. Contact data decays about 2–3% per month as people change jobs. An untouched database loses a quarter of its accuracy in a year. Three habits keep the number honest:
- Monthly re-verification of any contact record older than 90 days that is still in an open deal.
- Quarterly velocity review at team level, with the four variables broken out so you can see which one moved.
- Stage-exit criteria in writing. Vague stages are the number one cause of cycle-length inflation. Deals sit in "negotiation" for six weeks with no defined exit.
Track the four variables as a trend line, not a snapshot. One month's velocity number tells you almost nothing. Six months of the four variables tells you exactly which part of your go-to-market is breaking.
Start with the cheapest lever#
If you take one thing from this guide on how to increase sales velocity: verify your data before you buy anything else. Phantom pipeline is the most expensive line item in B2B sales, and it is invisible on every dashboard you look at today.
The Tomba Email Finder is built for this step. Find and verify the real decision makers at your target accounts by name or domain, so the pipeline you measure is pipeline that exists. The free tier gives you 25 searches a month, enough to run the 200-contact diagnostic above. Starter is $49/mo when you are ready to run it across your whole open pipeline. Clean the input first. Then pull the other three levers with numbers you can trust.
Related guides#
// get started
Find, verify and enrich your first contacts today
Start on the free plan with 25 searches a month, then scale when your team is ready.
Free plan · No credit card required · GDPR & CCPA
// about the author