How to Measure Intent Data: A Practical 2026 Framework
Most intent dashboards show surge scores nobody can act on. Here's how to measure intent data with baselines, decay windows, and a lift test that proves whether your signals are worth paying for.
TL;DR
- Intent data is only measurable against a baseline. A "surge score of 92" means nothing until you know what that account's normal research volume looks like over the prior 8–12 weeks.
- The four metrics that matter: signal-to-meeting rate, time-to-first-touch, decay half-life, and holdout lift. Everything else on the vendor dashboard is decoration.
- Run a holdout test before renewing any intent vendor. Split accounts randomly, work half with intent prioritization and half without, and compare meetings booked per 100 accounts over a full sales cycle.
- Intent signals expire fast. Most B2B research surges lose predictive value within 14–30 days, so measure your median time from signal fired to first human touch.
- A signal you can't contact is worth zero. Measure contactability — the share of surging accounts where you actually have a verified, deliverable email for the right role.
What is intent data, and what are you actually measuring?#
Intent data is the record of research behavior that suggests a company is evaluating a purchase. It comes in three flavors, and they are not interchangeable:
- First-party intent — behavior on properties you own: pricing page views, docs visits, demo form abandons, repeat sessions from the same company. Highest signal quality, lowest volume.
- Second-party intent — behavior on a specific third-party property you have a relationship with, most commonly a review site like G2 or a trade publication. Someone comparing you against a named competitor is a strong buying signal.
- Third-party intent — aggregated content-consumption data across a publisher co-op or bidstream network. Highest volume, lowest resolution, most prone to false positives.
- Technographic and hiring signals — a company installing a competitor's tag, posting a "RevOps Manager" req, or migrating stacks. Slower-moving, but far more durable than a content surge.
Here's the trap: vendors sell you a score, but scores are model outputs, not observations. When you ask "how to measure intent data," you're really asking two separate questions — is this signal real, and does acting on it change outcomes? Those need different tests.
The first question is about statistical validity. The second is about incrementality. Most teams skip both and just look at how many accounts turned red this week.

Why do most intent dashboards fail the smell test?#
Because they report volume where they should report deviation.
A Fortune 500 company with 40,000 employees will always generate more content consumption than a 60-person startup. If your vendor ranks accounts by raw topic volume, you'll get a leaderboard of large enterprises that were never in market — and your reps will burn three weeks discovering that.
The fix is baselining. For every account and topic pair, compute the trailing 8–12 week average consumption, then measure the current week as a multiple of that baseline. An account running at 4x its own normal is interesting. An account running at 1.1x its own normal is noise, no matter how big the absolute number.
The second failure is attribution laundering. A vendor shows you that 38% of your closed-won deals had an intent signal in the 90 days before close. That number is almost meaningless — of course accounts that bought were researching. The question is whether accounts with signals close at a higher rate than accounts without, holding everything else constant. That requires a control group, which no vendor dashboard will give you by default.
Third: stale signals. Research from B2B buying-behavior studies consistently shows buying committees compress evaluation into short windows. A signal that fired 45 days ago and sat in a queue is not intent data — it's history.
How do you measure intent data? The five core metrics#
Track these five and you can defend your intent spend to a CFO. Track the vendor's default dashboard and you can't.
- Baseline-adjusted surge ratio — current-period topic consumption divided by the account's own trailing 8-week median. Set your action threshold at 3x or higher and re-tune quarterly. This kills the enterprise-bias problem in one calculation.
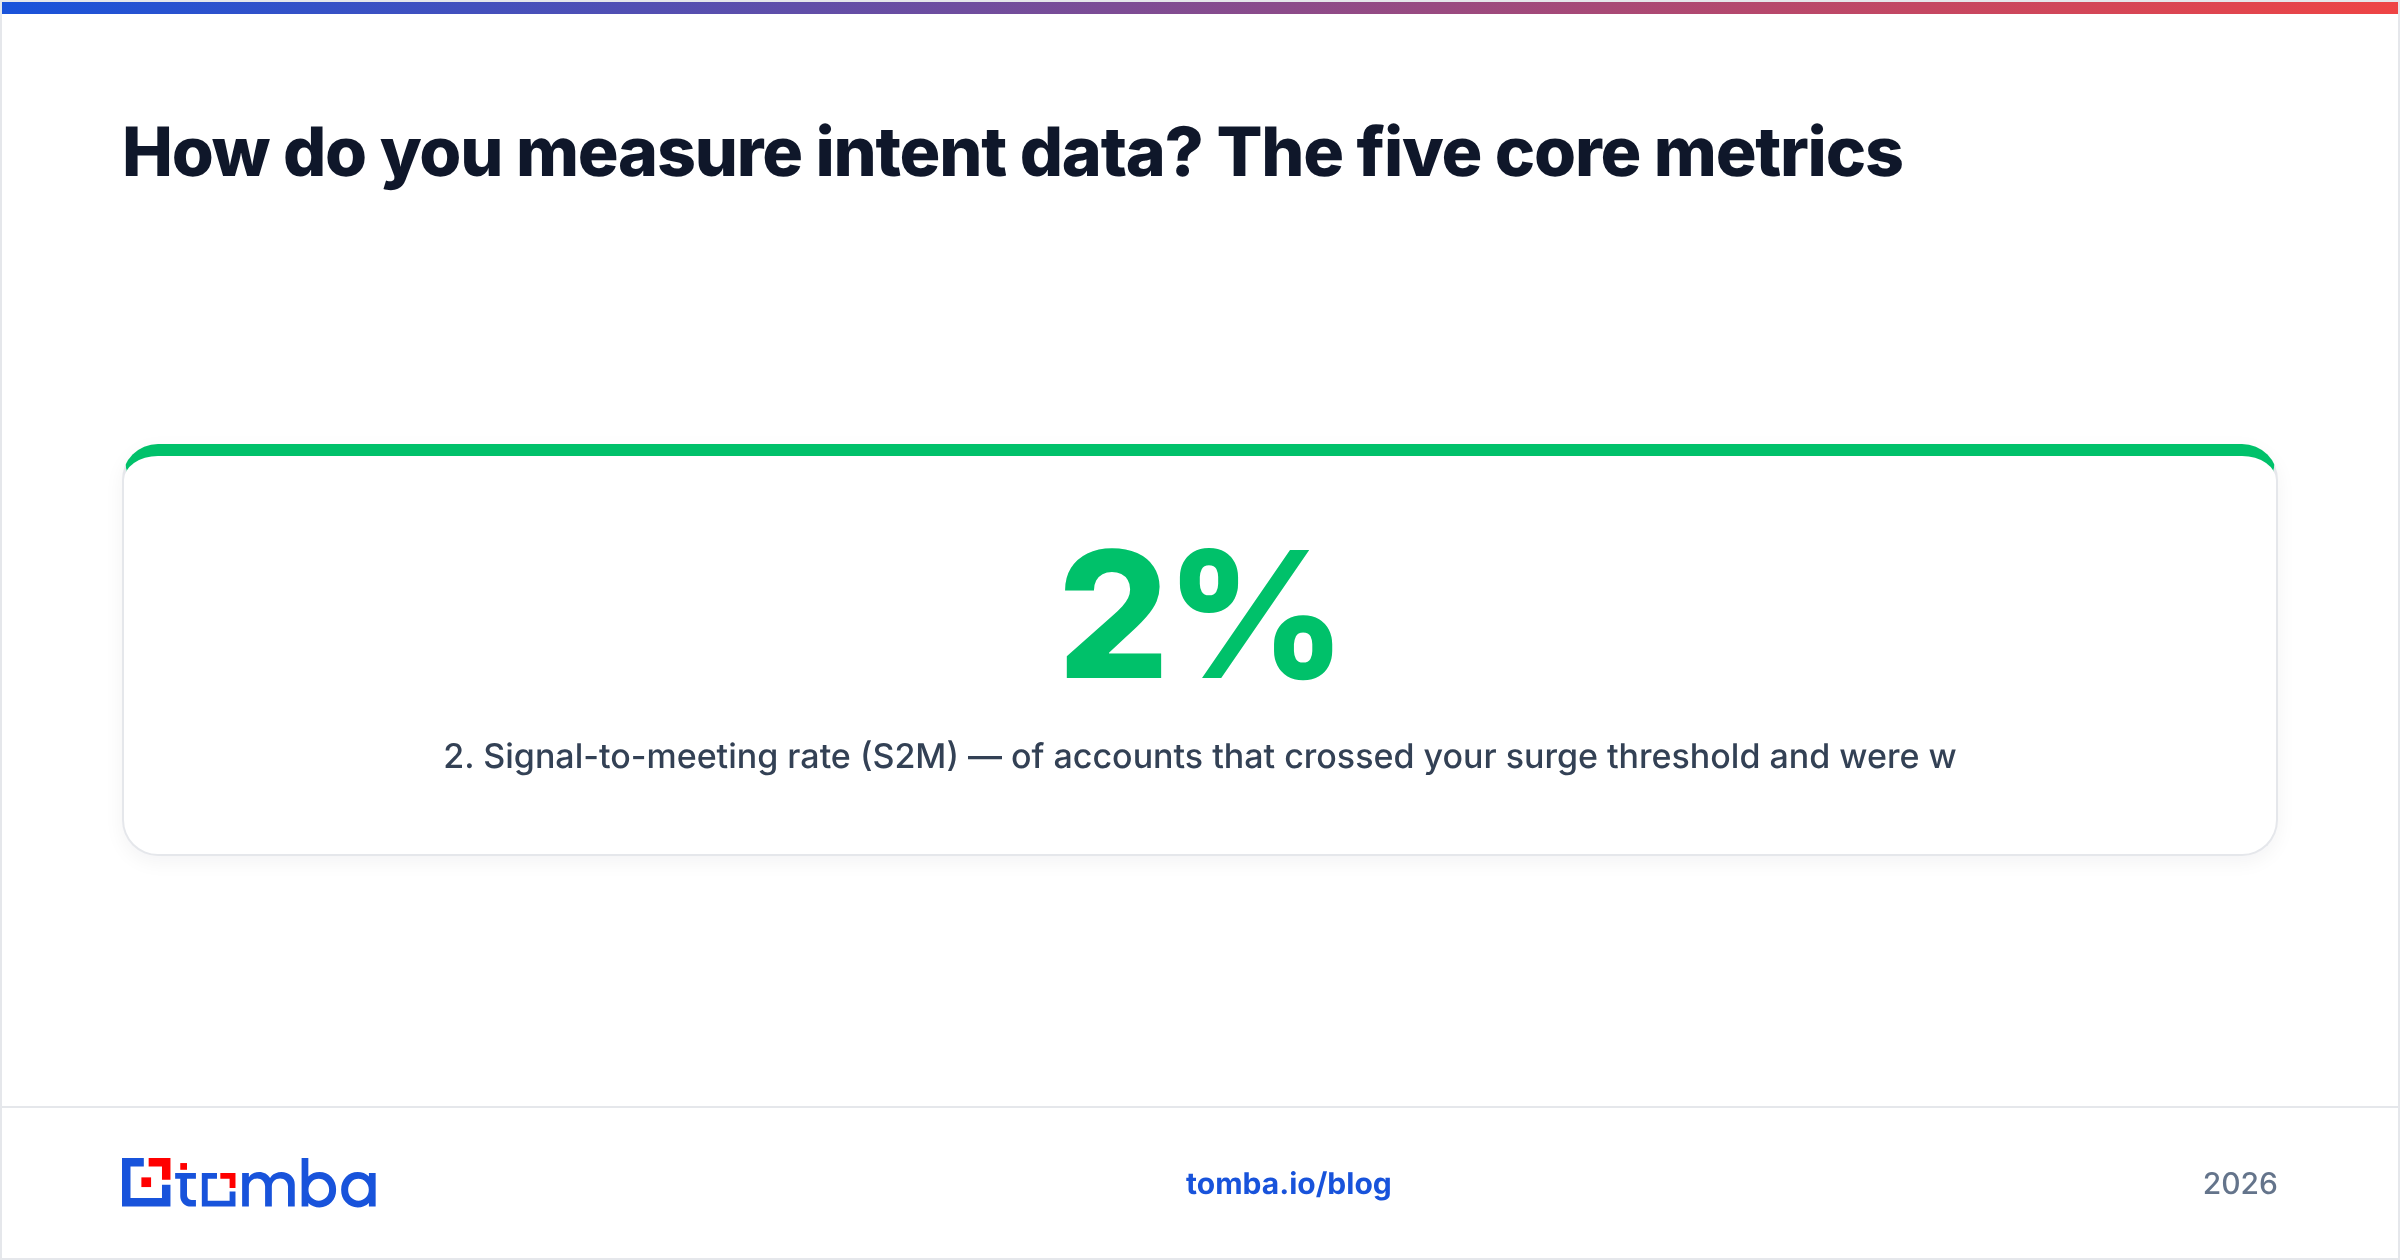
- Signal-to-meeting rate (S2M) — of accounts that crossed your surge threshold and were worked, what percentage produced a booked meeting within 30 days? A healthy third-party program lands between 2% and 6%. First-party intent should land 5–10x higher.
- Time-to-first-touch (TTFT) — median hours from signal fire to a human touch (not an automated sequence enrollment). Under 48 hours is the target. Above 7 days, you are effectively measuring a random account list.
- Decay half-life — how long after a signal fires does the S2M rate drop to half its day-one value? Compute this by bucketing worked signals into 0–3, 4–7, 8–14, 15–30, and 31+ day cohorts and comparing conversion. Most third-party signals halve inside two weeks.
- Contactability rate — the percentage of surging accounts where you hold a verified, deliverable email for a person in the buying role you care about. This is the metric that quietly caps everything else, and almost nobody tracks it.
That last one deserves emphasis. If your intent tool flags 400 surging accounts a month and you only have valid contacts at 130 of them, your effective signal volume is 130 — and your real cost per actionable signal is triple what the invoice says. Running those domains through a domain search and a email verifier pass before you calculate ROI changes the math substantially.
What does a proper intent lift test look like?#
A holdout test. It's the only method that answers "did intent data cause anything?"
Setup:
- Take your ICP-qualified account universe — say 2,000 accounts.
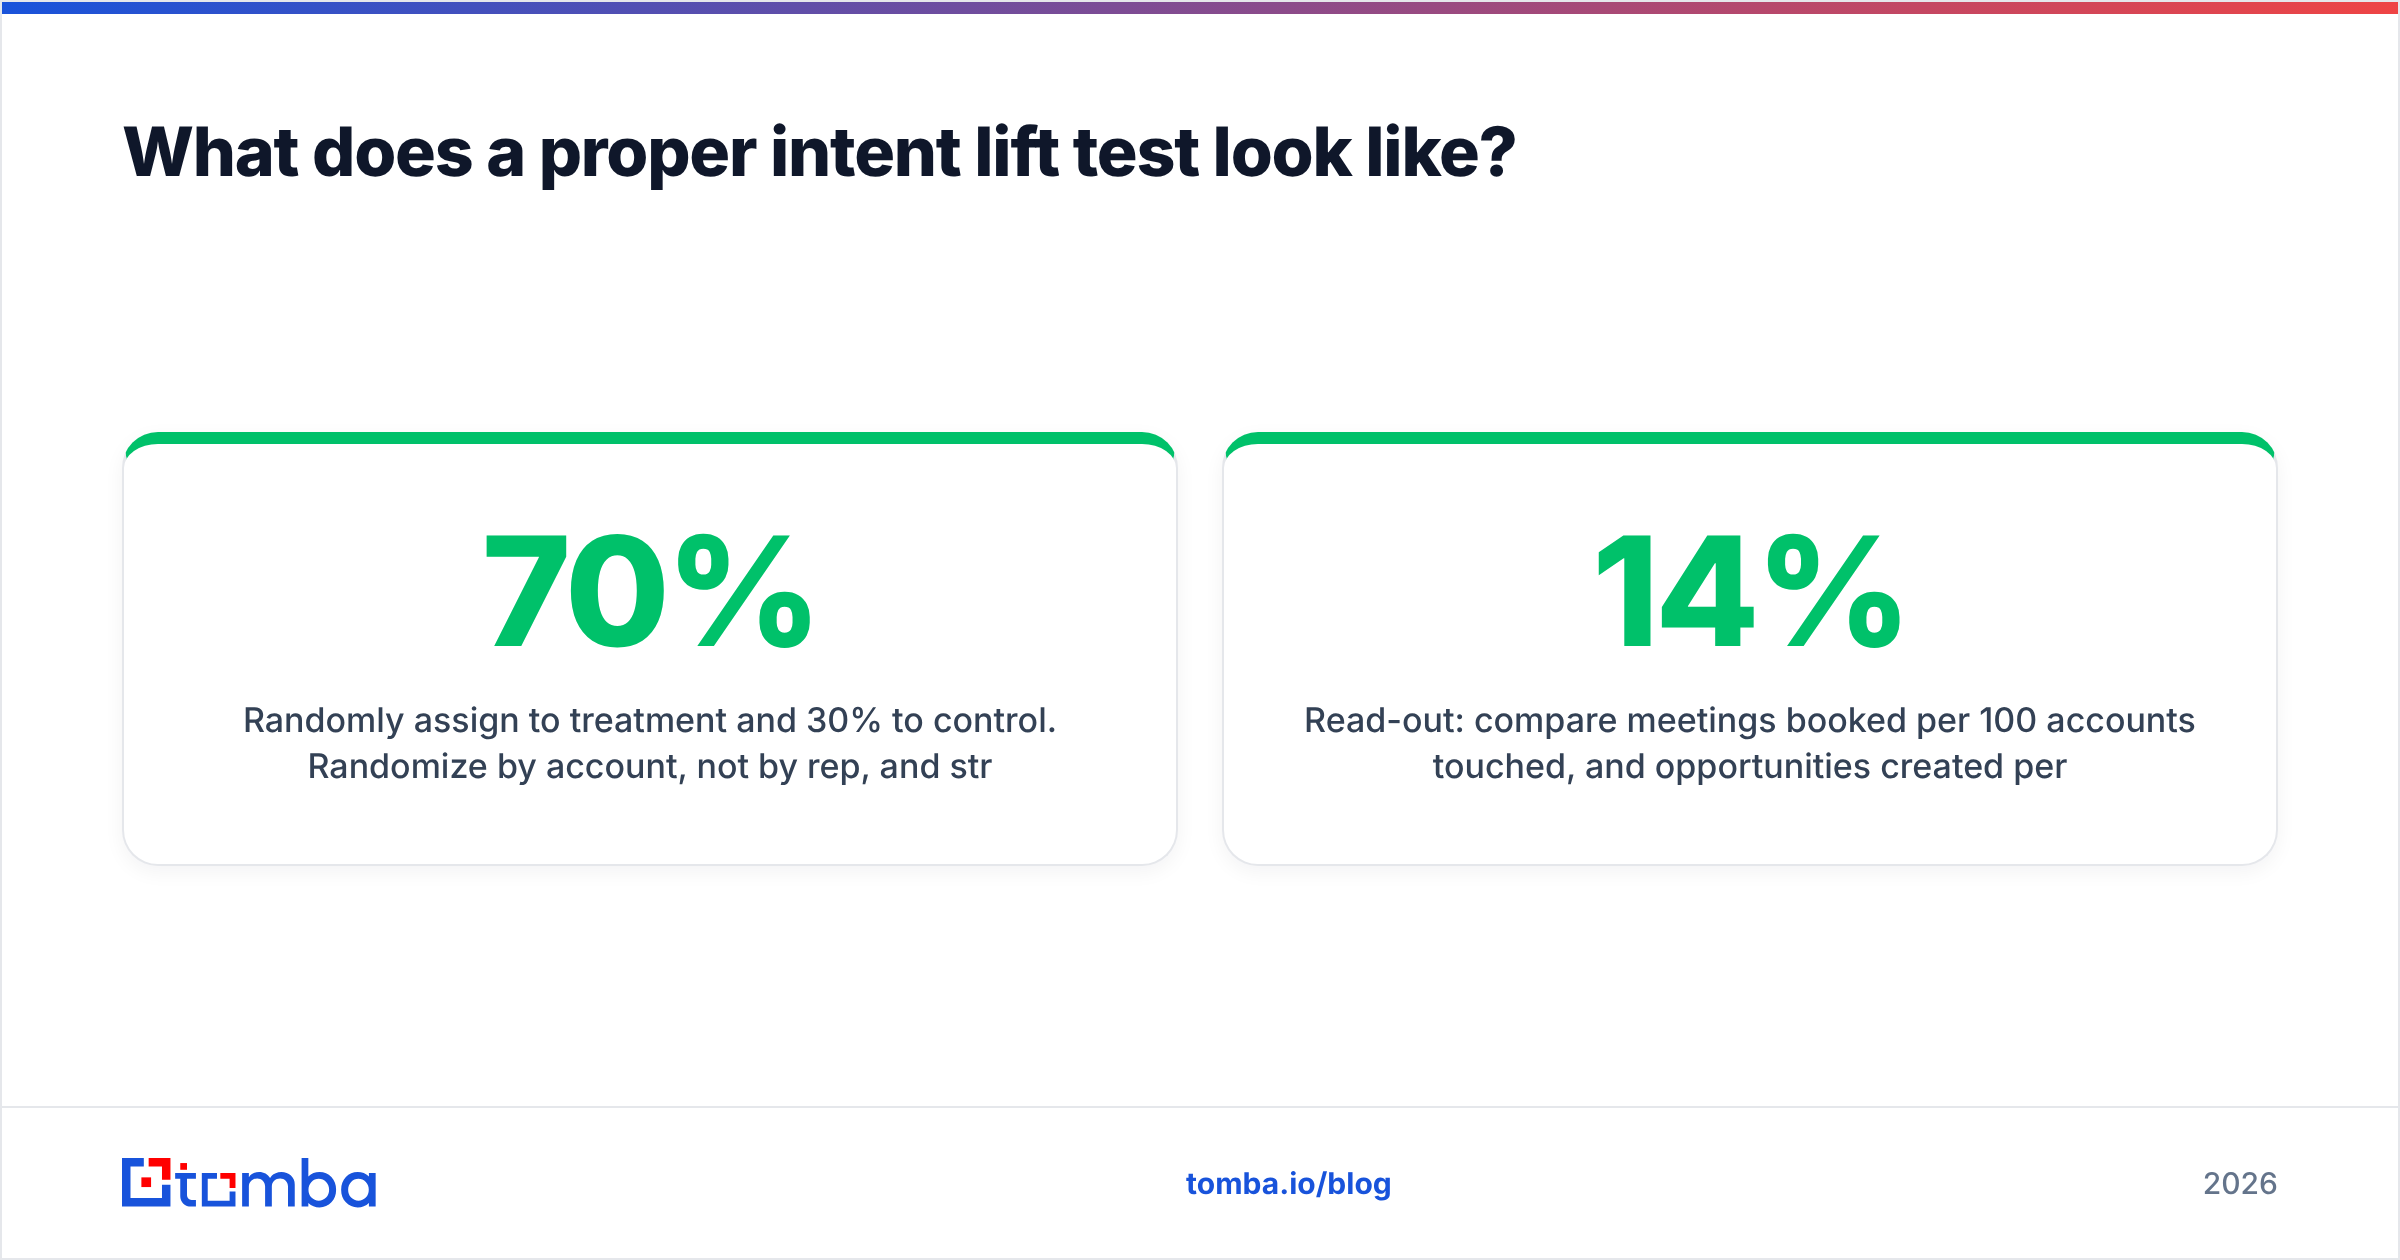
- Randomly assign 70% to treatment and 30% to control. Randomize by account, not by rep, and stratify by segment and company size so both arms look alike.
- The treatment arm gets intent-prioritized sequencing: surging accounts jump the queue, messaging references the researched topic.
- The control arm gets worked in the normal order with generic messaging, at the same total activity volume. Same effort, different prioritization.
- Run for one full sales cycle plus 30 days. For most B2B teams that's 90–120 days.
Read-out: compare meetings booked per 100 accounts touched, and opportunities created per 100 accounts touched, between arms. If treatment produces 4.1 meetings per 100 and control produces 3.6, that's a 14% relative lift — real, but you now have a number to divide the subscription cost by.
The most common mistake is letting the treatment arm receive more total activity than control. Then you're measuring effort, not intent. Hold activity volume constant and vary only the ordering and the messaging.
Keep a written pre-registration: your primary metric, your threshold, your run length, decided before you look at results. Otherwise you will find a subgroup where intent "worked" and believe it.
How do intent data sources compare on measurability?#
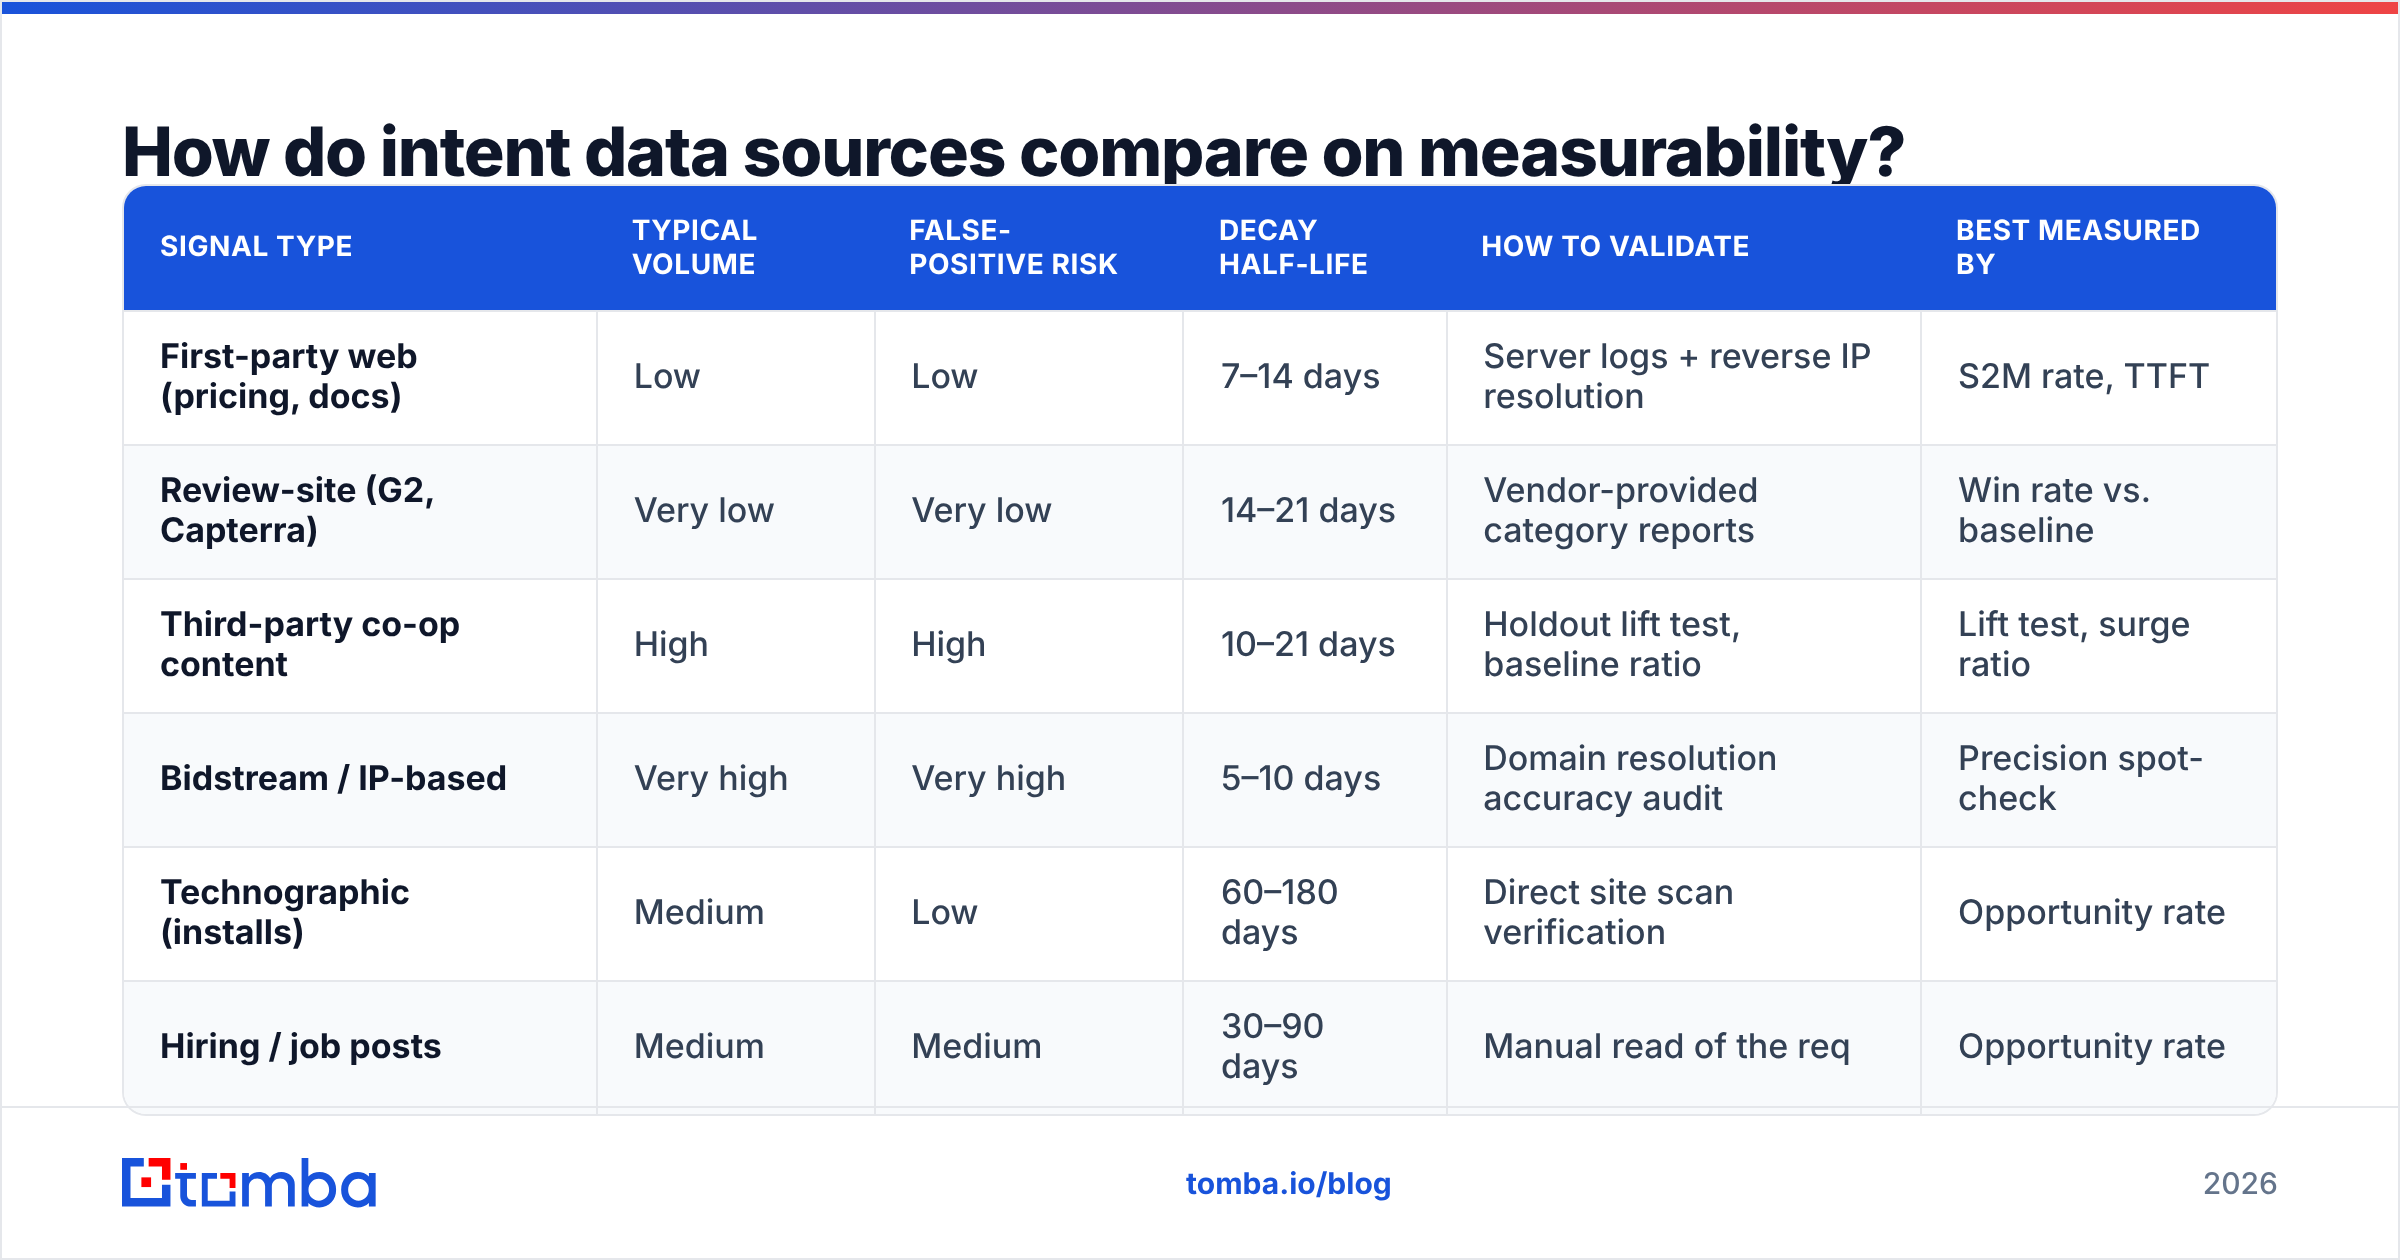
Different sources demand different measurement approaches, and they carry very different cost-per-actionable-signal profiles.
| Signal type | Typical volume | False-positive risk | Decay half-life | How to validate | Best measured by |
|---|---|---|---|---|---|
| First-party web (pricing, docs) | Low | Low | 7–14 days | Server logs + reverse IP resolution | S2M rate, TTFT |
| Review-site (G2, Capterra) | Very low | Very low | 14–21 days | Vendor-provided category reports | Win rate vs. baseline |
| Third-party co-op content | High | High | 10–21 days | Holdout lift test, baseline ratio | Lift test, surge ratio |
| Bidstream / IP-based | Very high | Very high | 5–10 days | Domain resolution accuracy audit | Precision spot-check |
| Technographic (installs) | Medium | Low | 60–180 days | Direct site scan verification | Opportunity rate |
| Hiring / job posts | Medium | Medium | 30–90 days | Manual read of the req | Opportunity rate |
Two practical notes on this table. First, decay half-life is why routing speed matters more than score precision — a mediocre signal worked in 12 hours beats an excellent one worked in 12 days. Second, bidstream data needs a precision audit before you trust it at all: pull 50 flagged accounts, manually check whether the identified company plausibly has any connection to the topic, and compute the hit rate. Below 40%, stop paying for it.
What should you do the moment a signal fires?#
Signals decay, so the operational chain matters as much as the measurement. A workable sequence:
Step 1 — Filter by baseline, not by score. Only route accounts above your 3x surge ratio and inside your ICP. Everything else goes to a nurture list.
Step 2 — Resolve to people. A surging domain is not a lead. You need the two or three roles who own the problem the topic maps to. Pull them from your B2B database or run the domain through an email finder to get named contacts with role context.
Step 3 — Verify before sending. Surge-triggered sends often go to stale contact records, and bounce spikes damage sender reputation exactly when you need deliverability most. Verify in bulk, drop the unknowns, and route catch-all domains through a separate, lower-volume path.
Step 4 — Reference the topic, not the surge. Never write "I saw you were researching data warehouses." It reads like surveillance and it tanks reply rates. Write about the problem the topic implies. Measure the difference — split-test topic-aware copy against generic copy and compare response rate.
Step 5 — Log the signal ID on the activity record. This is the boring step everyone skips, and it's the reason most teams can't compute S2M three months later. Stamp the signal type, fire date, and surge ratio onto every touch in your CRM. No stamp, no measurement.

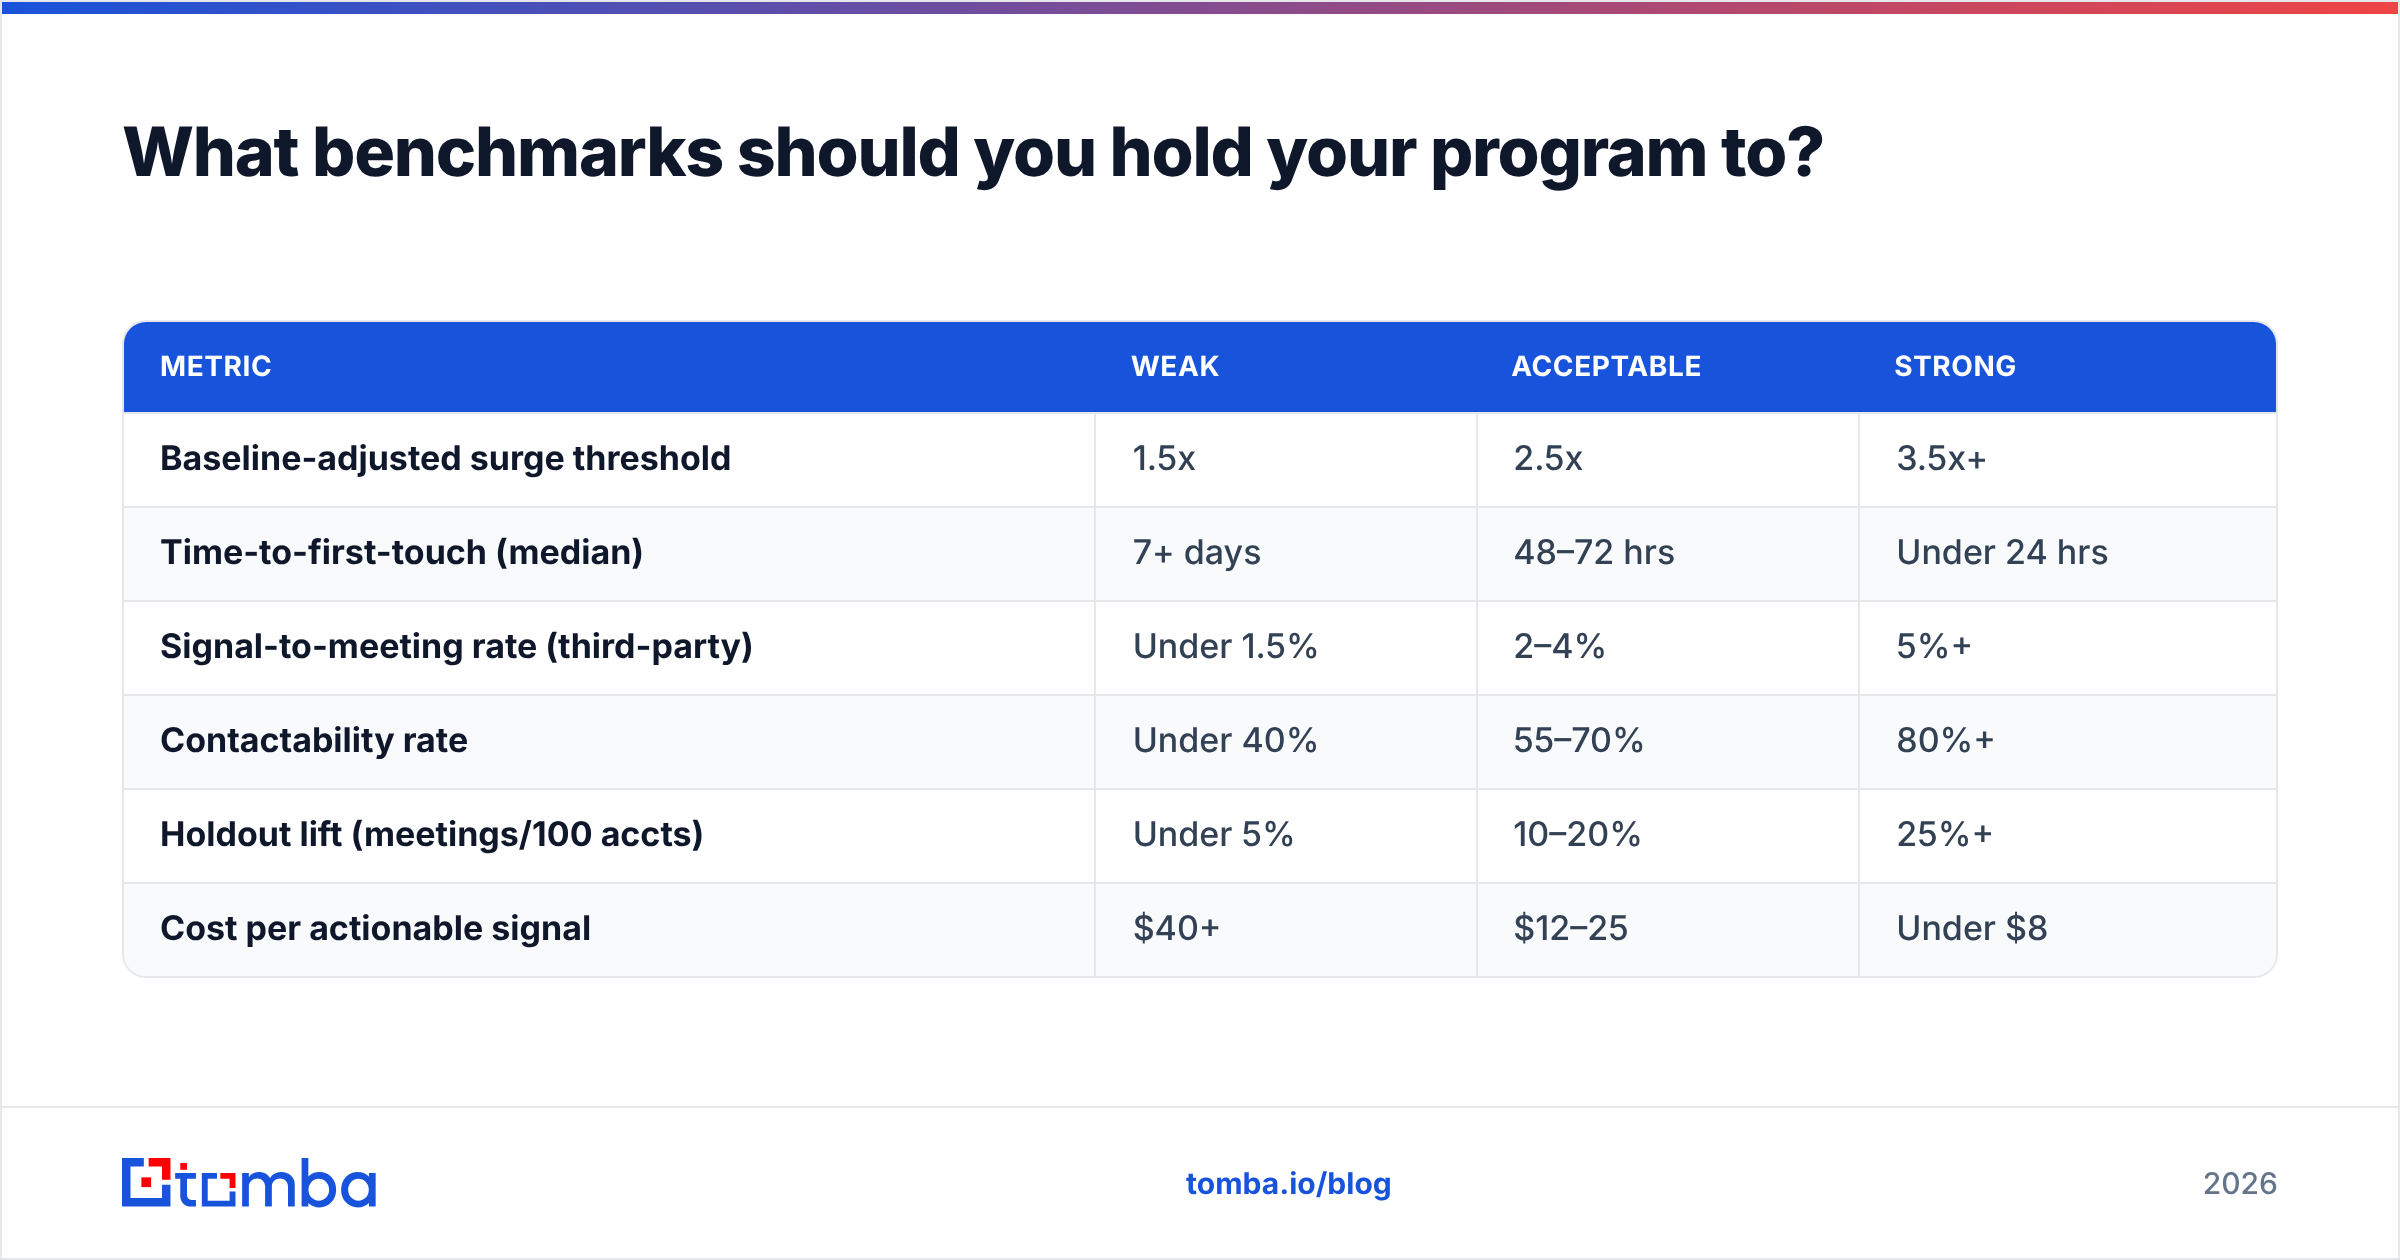
What benchmarks should you hold your program to?#
Benchmarks vary by motion, but these ranges hold up across mid-market B2B outbound teams running intent-prioritized sequences:
| Metric | Weak | Acceptable | Strong |
|---|---|---|---|
| Baseline-adjusted surge threshold | 1.5x | 2.5x | 3.5x+ |
| Time-to-first-touch (median) | 7+ days | 48–72 hrs | Under 24 hrs |
| Signal-to-meeting rate (third-party) | Under 1.5% | 2–4% | 5%+ |
| Contactability rate | Under 40% | 55–70% | 80%+ |
| Holdout lift (meetings/100 accts) | Under 5% | 10–20% | 25%+ |
| Cost per actionable signal | $40+ | $12–25 | Under $8 |
Cost per actionable signal is the number to bring into a renewal conversation. Take the annual subscription, divide by the count of signals that (a) cleared your baseline threshold, (b) fell inside ICP, and (c) had a verified contact attached. That denominator is usually 20–35% of the raw signal count the vendor quotes in the sales deck. Doing this arithmetic honestly has saved teams five-figure renewals.
Also track the metric nobody wants to publish: rep trust rate. Survey your AEs quarterly — what share of intent-flagged accounts did they find worth working? If that number is under 50%, your threshold is too loose, and no amount of dashboard polish will fix it.
How does intent measurement fit into your broader data stack?#
Intent is a prioritization layer, not a data source. It tells you when, never who or how to reach them. That means your measurement is bounded by the quality of the contact layer underneath it.
Three integration points worth wiring properly:
- Reverse resolution for first-party visits. Anonymous traffic is your highest-value intent, and it's wasted unless you can name the company. Visitor identification turns a session into an account, which is the precondition for measuring first-party S2M at all.
- Enrichment at signal-fire time, not at import time. Contact records decay roughly 25–30% per year through job changes. Enriching when the signal fires — rather than relying on a record imported 14 months ago — measurably lifts your contactability rate. Route it through the Tomba API so it happens inside the workflow rather than in a monthly batch job.
- Closed-loop write-back. Push meeting and opportunity outcomes back to the signal record. Without this, you can compute S2M once, manually, in a spreadsheet, and never again.
For teams building their own scoring on top of purchased signals, platforms like HubSpot and Salesforce both support custom scoring objects that can hold the surge ratio and fire timestamp as first-class fields. Use them rather than cramming everything into a text note.
What are the most common measurement mistakes?#
Measuring correlation and calling it causation. "Accounts with intent close 2x more" is not evidence unless there's a control arm. High-growth companies both buy more and research more; the research didn't cause the purchase.
Aggregating across signal types. A first-party pricing-page view and a bidstream topic hit are not the same event and should never sit in the same average. Report them separately or your good signals will be dragged down by your noisy ones.
Ignoring the denominator. Reporting "82 meetings from intent" without the account count it came from is a vanity metric. Always express as a rate per 100 accounts worked.
Not re-tuning thresholds. Buying seasons shift, competitors launch, topics get diluted as more vendors buy the same taxonomy. Re-fit your surge threshold every quarter against fresh outcome data.
Letting bounce rates ride. If your intent-triggered campaigns bounce at 6% while your regular campaigns bounce at 1.5%, you're measuring intent through a broken pipe. Run a bulk verify pass on every intent-sourced list before it enters a sequence, and monitor email deliverability separately for that segment.
Which intent vendors should you evaluate?#
There's a healthy market — Bombora, 6sense, Demandbase, ZoomInfo, and a growing set of first-party-focused tools. Rather than ranking them, run every candidate through the same four questions:
- Can you export raw, per-account, per-topic weekly consumption — not just a composite score? If no, you cannot baseline, and you cannot measure.
- What's the domain-resolution methodology, and what precision do they claim on a manual audit?
- Will they support a holdout structure during the pilot, or do they insist on flagging every account?
- What's the median signal latency from observed behavior to your CRM?
Vendors that answer all four cleanly are worth piloting. Vendors that deflect to case studies are selling you a dashboard.
For a wider comparison of how data-and-signal platforms stack up on coverage and price, both G2 and Capterra carry enough verified reviews to spot patterns — read the 3-star reviews, not the 5-star ones, since that's where the measurement complaints live.
Turn signals into contacts you can actually reach#
Intent tells you which accounts to work this week. It doesn't tell you who to email, and it won't fix a contact list where a third of the addresses bounce. That gap — between a surging domain and a verified inbox — is where most intent programs quietly lose their ROI.
Close it by resolving every flagged domain to named, role-matched, deliverable contacts before the signal decays. The Tomba Email Finder does exactly that: feed it a domain and a role, get back verified professional emails with confidence scores you can route on. Start on the free tier with 25 searches a month to benchmark your contactability rate, then scale on the $49/mo Starter or $99/mo Growth plan once you know your cost per actionable signal. Full Tomba pricing is public, and the API drops straight into the workflow that fires when a signal hits — so you measure intent against contacts you can actually reach, not domains you can only stare at.
Related guides#
// get started
Find, verify and enrich your first contacts today
Start on the free plan with 25 searches a month, then scale when your team is ready.
Free plan · No credit card required · GDPR & CCPA
// about the author