How to Predict Sales in 2026: A Practical Forecasting Guide
Most sales forecasts miss because they measure opinions, not evidence. Here are five forecasting methods, the data each one needs, and how to pick the model that fits your pipeline.
TL;DR
- There is no single answer to how to predict sales. There are five methods, and the right one depends on how much clean history you have.
- Rep-judgment forecasting is the most common approach and the least accurate. Teams that use it alone land 20-40% off their called number.
- Pipeline-coverage math (3x-5x of quota) is the fastest upgrade for teams under two years old with thin history.
- Regression and weighted-stage models only work if your CRM stage rules are enforced. Sloppy stages produce confident, wrong numbers.
- Forecast accuracy is a data problem first and a math problem second. Bad contact data inflates the top of the funnel, and that error flows into every stage below it.
Knowing how to predict sales means estimating how much revenue will close in a set window, using a repeatable method rather than a gut feeling. Most teams do it badly. The math is not the hard part. The trouble is that nobody audits the inputs they feed it.
This guide covers the five methods that work in B2B. For each one: what it needs, when it breaks, and how to spot forecast drift before the quarter ends.
What does "predicting sales" actually mean?#
People use the phrase "sales forecast" for three different things. Mixing them up is the first source of error.
- The commit — deals reps will stake their name on. This should be 90%+ accurate. If it is not, your rep judgment is uncalibrated.
- The forecast — commit plus a weighted slice of best-case pipeline. Leadership plans headcount against this number.
- The target — quota. It is a wish, not a prediction. Treating it as one is how boards get surprised.
A prediction says what will happen, based on today's evidence. A target says what you want to happen. When a VP asks whether you are going to hit the number, they want you to compare the first to the third, honestly.
The window matters too. This quarter needs different signals than next fiscal year. In-quarter work leans on deal-level data: stage, age, activity, buying-committee coverage. Annual work leans on trends: win rate, average deal size, and how fast new pipeline gets created.

Which sales forecasting method should you use?#
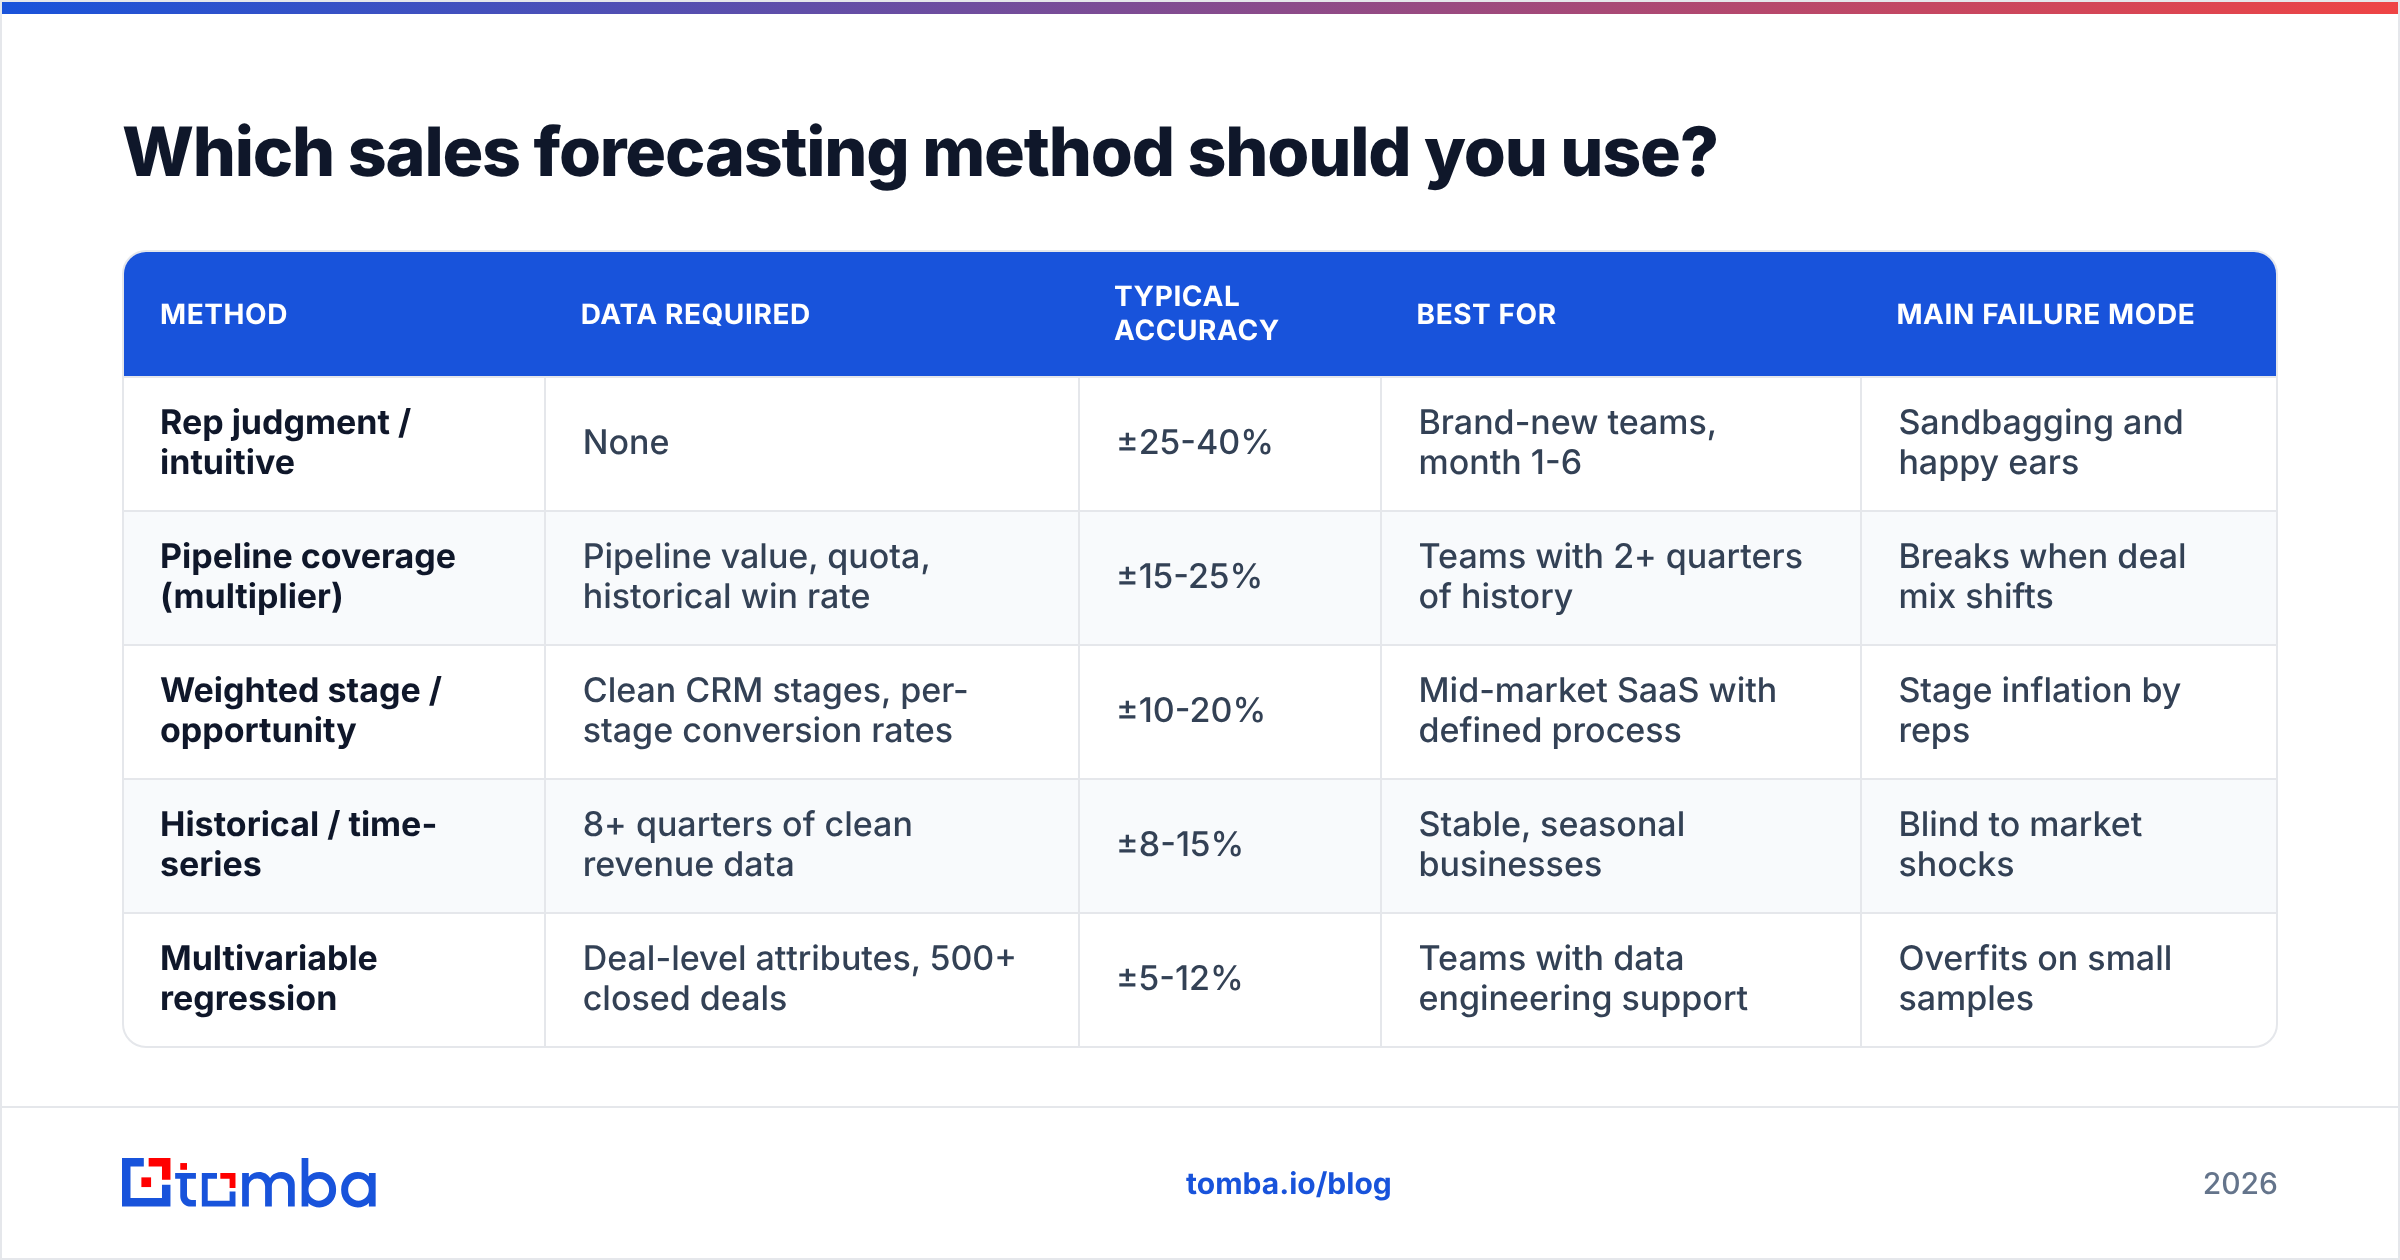
Here is the honest comparison. No method wins everywhere. Each one trades accuracy for data you may not have.
| Method | Data required | Typical accuracy | Best for | Main failure mode |
|---|---|---|---|---|
| Rep judgment / intuitive | None | ±25-40% | Brand-new teams, month 1-6 | Sandbagging and happy ears |
| Pipeline coverage (multiplier) | Pipeline value, quota, historical win rate | ±15-25% | Teams with 2+ quarters of history | Breaks when deal mix shifts |
| Weighted stage / opportunity | Clean CRM stages, per-stage conversion rates | ±10-20% | Mid-market SaaS with defined process | Stage inflation by reps |
| Historical / time-series | 8+ quarters of clean revenue data | ±8-15% | Stable, seasonal businesses | Blind to market shocks |
| Multivariable regression | Deal-level attributes, 500+ closed deals | ±5-12% | Teams with data engineering support | Overfits on small samples |
Read that table as a ladder, not a menu. You climb it as your data matures. A twelve-person startup running regression on 40 closed deals is putting decimal points on noise.
The five methods, in the order you should adopt them#
1. Intuitive forecasting. Ask each rep what will close, then add it up. It is cheap, fast, and biased. Use it as a sanity check on a real model, never as the model itself.
2. Pipeline coverage. Divide open pipeline by remaining quota. If you close 25% of pipeline, you need 4x coverage. Below that ratio, you are already short. The only lever left is pipeline creation.
3. Weighted stage forecasting. Give each stage its real conversion rate, not the default in your CRM. Discovery at 12%, demo at 30%, proposal at 55%, contract at 85%. Then multiply and sum. Recalculate those weights every quarter.
4. Length-of-cycle forecasting. Score deals by age instead of stage. A deal 40 days into a 45-day cycle beats a proposal that has sat open for seven months. This one quietly beats stage-weighting when CRM hygiene is poor, because deal age cannot be faked.
5. Multivariable regression. Model close odds against deal size, source, industry, stakeholder count, and days since last touch. This is where AI forecasting tools operate. It needs a lot of closed-lost data to mean anything.
Most healthy teams run two models side by side. One is quantitative and sets the baseline. The other is rep commit, used as an override. When the two disagree by more than 15%, that gap is your review agenda.
Why do most sales forecasts miss?#
Because the inputs are wrong, and nobody checks the inputs.
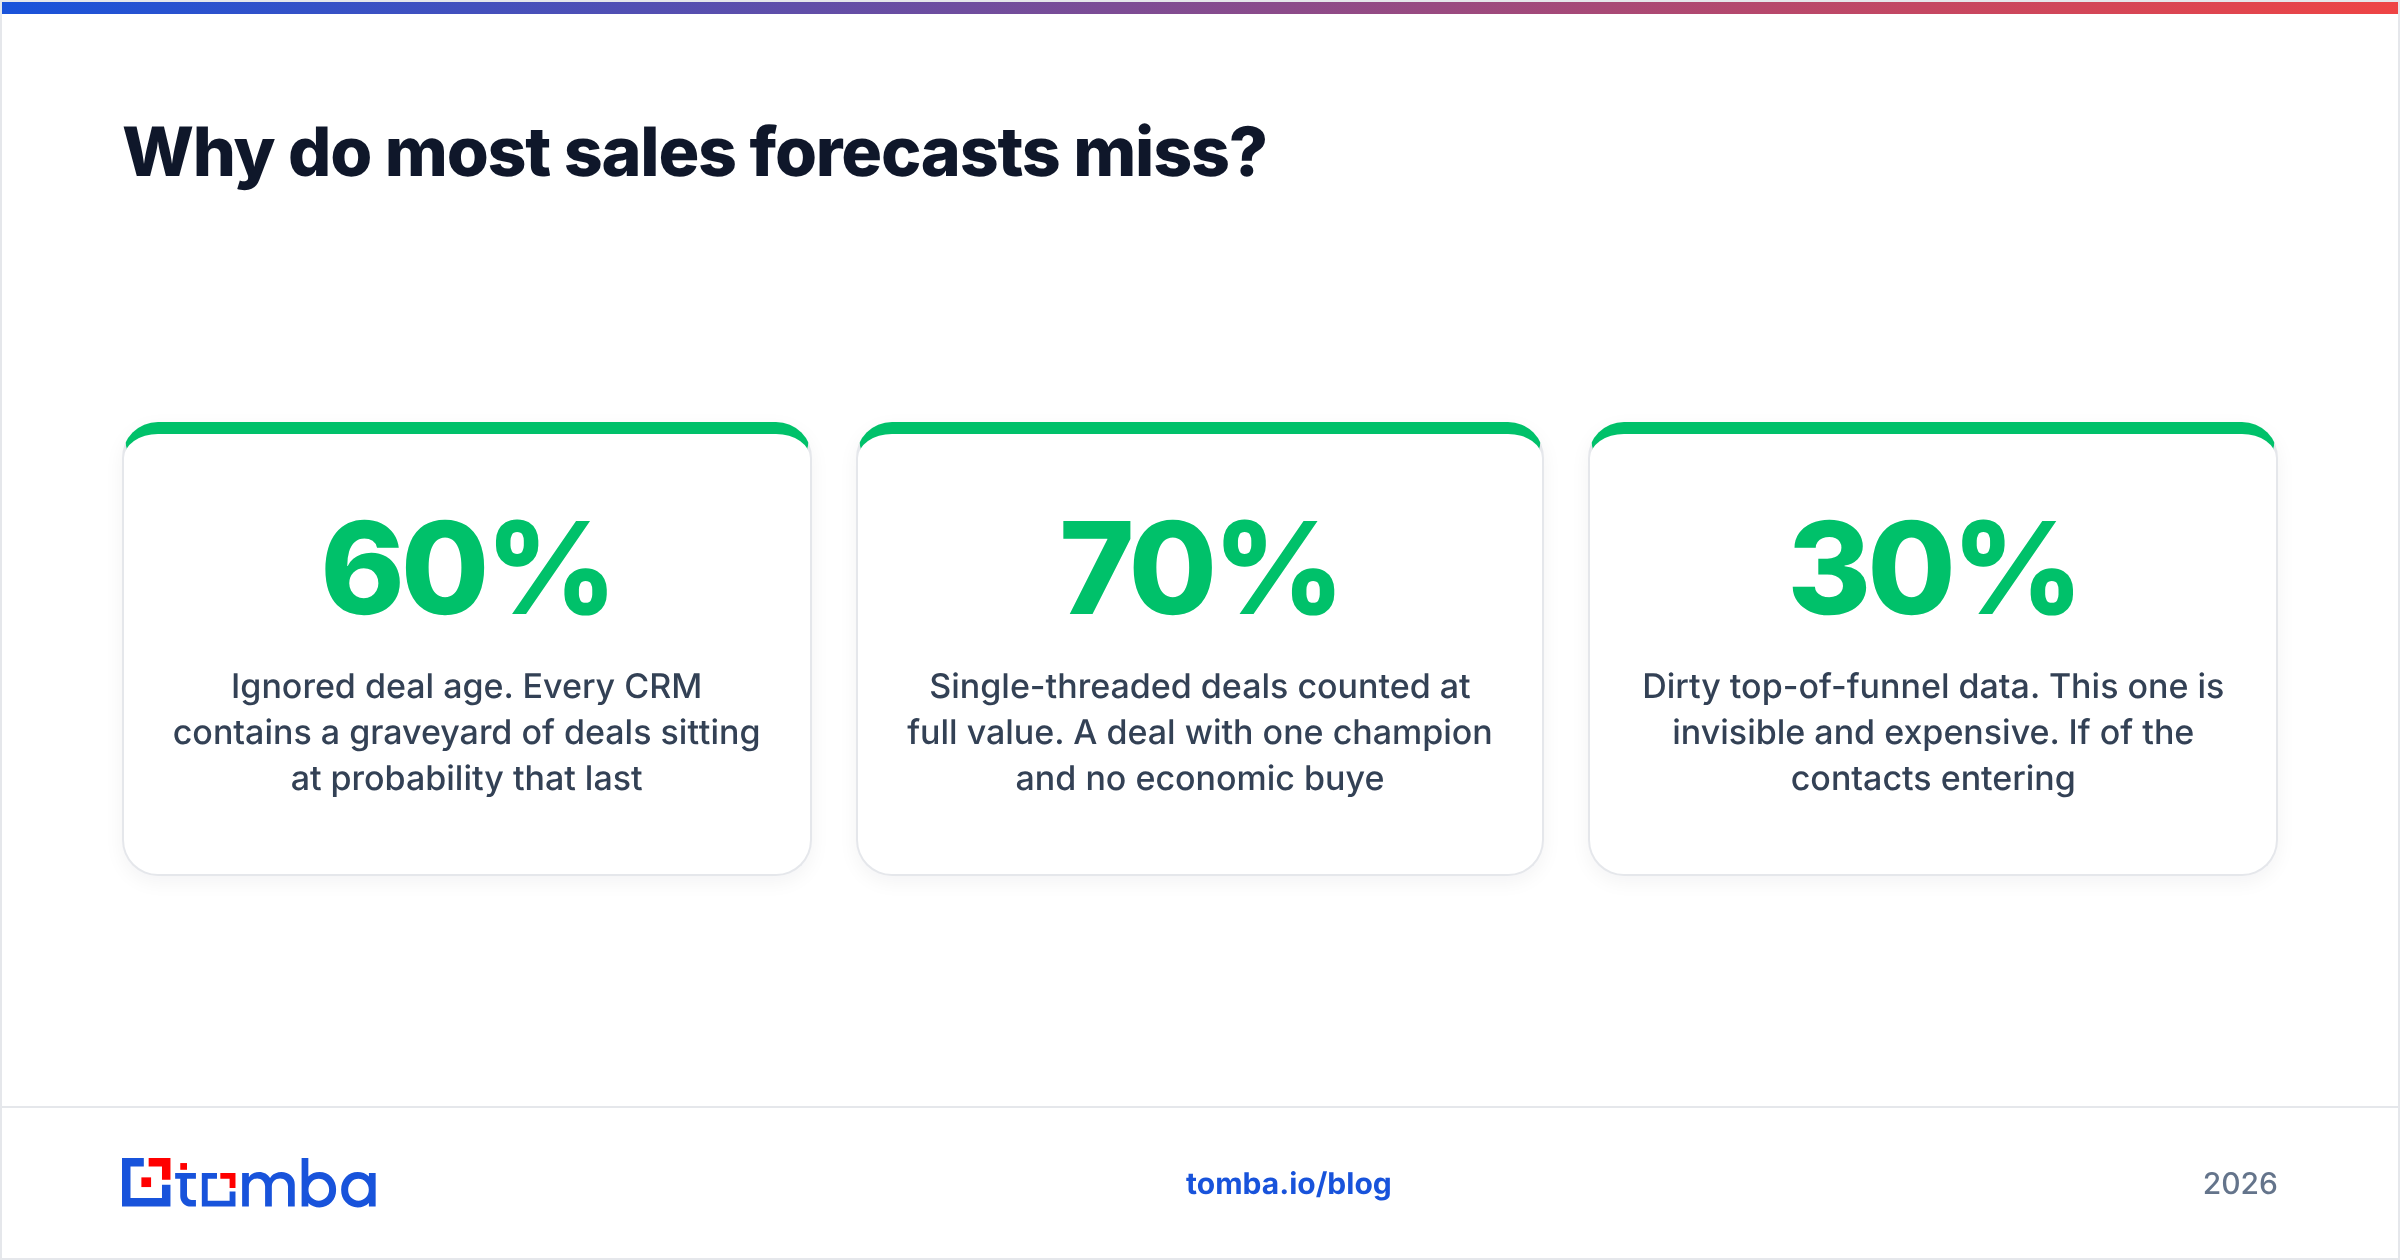
Stage inflation. Reps move deals to proposal because the pipeline review is Thursday, not because a proposal exists. Fix it with exit criteria you can verify: a signed mutual action plan, a security review filed, a named procurement contact. If a manager cannot check the artifact in thirty seconds, the stage rule is too soft.
Ignored deal age. Every CRM holds a graveyard of deals stuck at 60% since March. Decay probability by deal age automatically. Any deal past twice your average cycle should count for close to nothing, whatever the stage says.
Single-threaded deals counted at full value. A deal with one champion and no economic buyer is not a 70% deal. Track stakeholder count as a forecast input. Deals with three or more engaged contacts close at much higher rates across most B2B segments — HubSpot's sales research and similar benchmarks keep flagging this pattern.
Dirty top-of-funnel data. This one is invisible and expensive. Say 30% of the contacts entering your pipeline have bad emails or the wrong role. Your MQL-to-SQL rate looks broken, your conversion math is off, and every weight you derived from it is wrong. Running an email verifier over inbound and sourced lists before they reach the CRM is dull work. It also removes a whole class of forecast error.
No forecast versioning. If you never save last month's forecast, you can never measure your own accuracy. Snapshot the forecast weekly. Compare called to actual at quarter close. Your error rate is itself a metric worth managing.
How to predict sales: build a forecast model from scratch#
Assume you have a CRM, twelve months of history, and no data scientist. This sequence works.
Step 1 — Set your baseline conversion rates. Pull every deal created in the last four quarters. For each stage, work out what share of the deals that entered it closed won. Use time-of-entry cohorts, not time-of-close data. Otherwise you will overstate late-stage rates badly.
Step 2 — Find your true cycle length. Use the median, not the mean. One eighteen-month enterprise deal will wreck a mean in a mid-market dataset.
Step 3 — Segment before you model. Inbound and outbound convert at different rates. So do SMB and enterprise. So do new logos and expansions. One blended win rate hides the mix shift that will blow up your forecast later. Three to five segments is usually enough.
Step 4 — Build the weighted pipeline math. For each open deal: value × stage weight × age decay factor. Sum by segment, then by rep, then by team.
Step 5 — Add pipeline creation velocity. Deals that do not exist yet can still close this quarter. If your cycle is 45 days and you are 30 days in, new pipeline still lands. Model it apart from existing pipeline.
Step 6 — Compare against rep commit and reconcile. The delta is the conversation.
Step 7 — Measure error and recalibrate. After each quarter, work out the variance per segment and adjust the weights. Almost everyone skips this step. It is the only reason the model gets better.
What data do you actually need to predict sales accurately?#
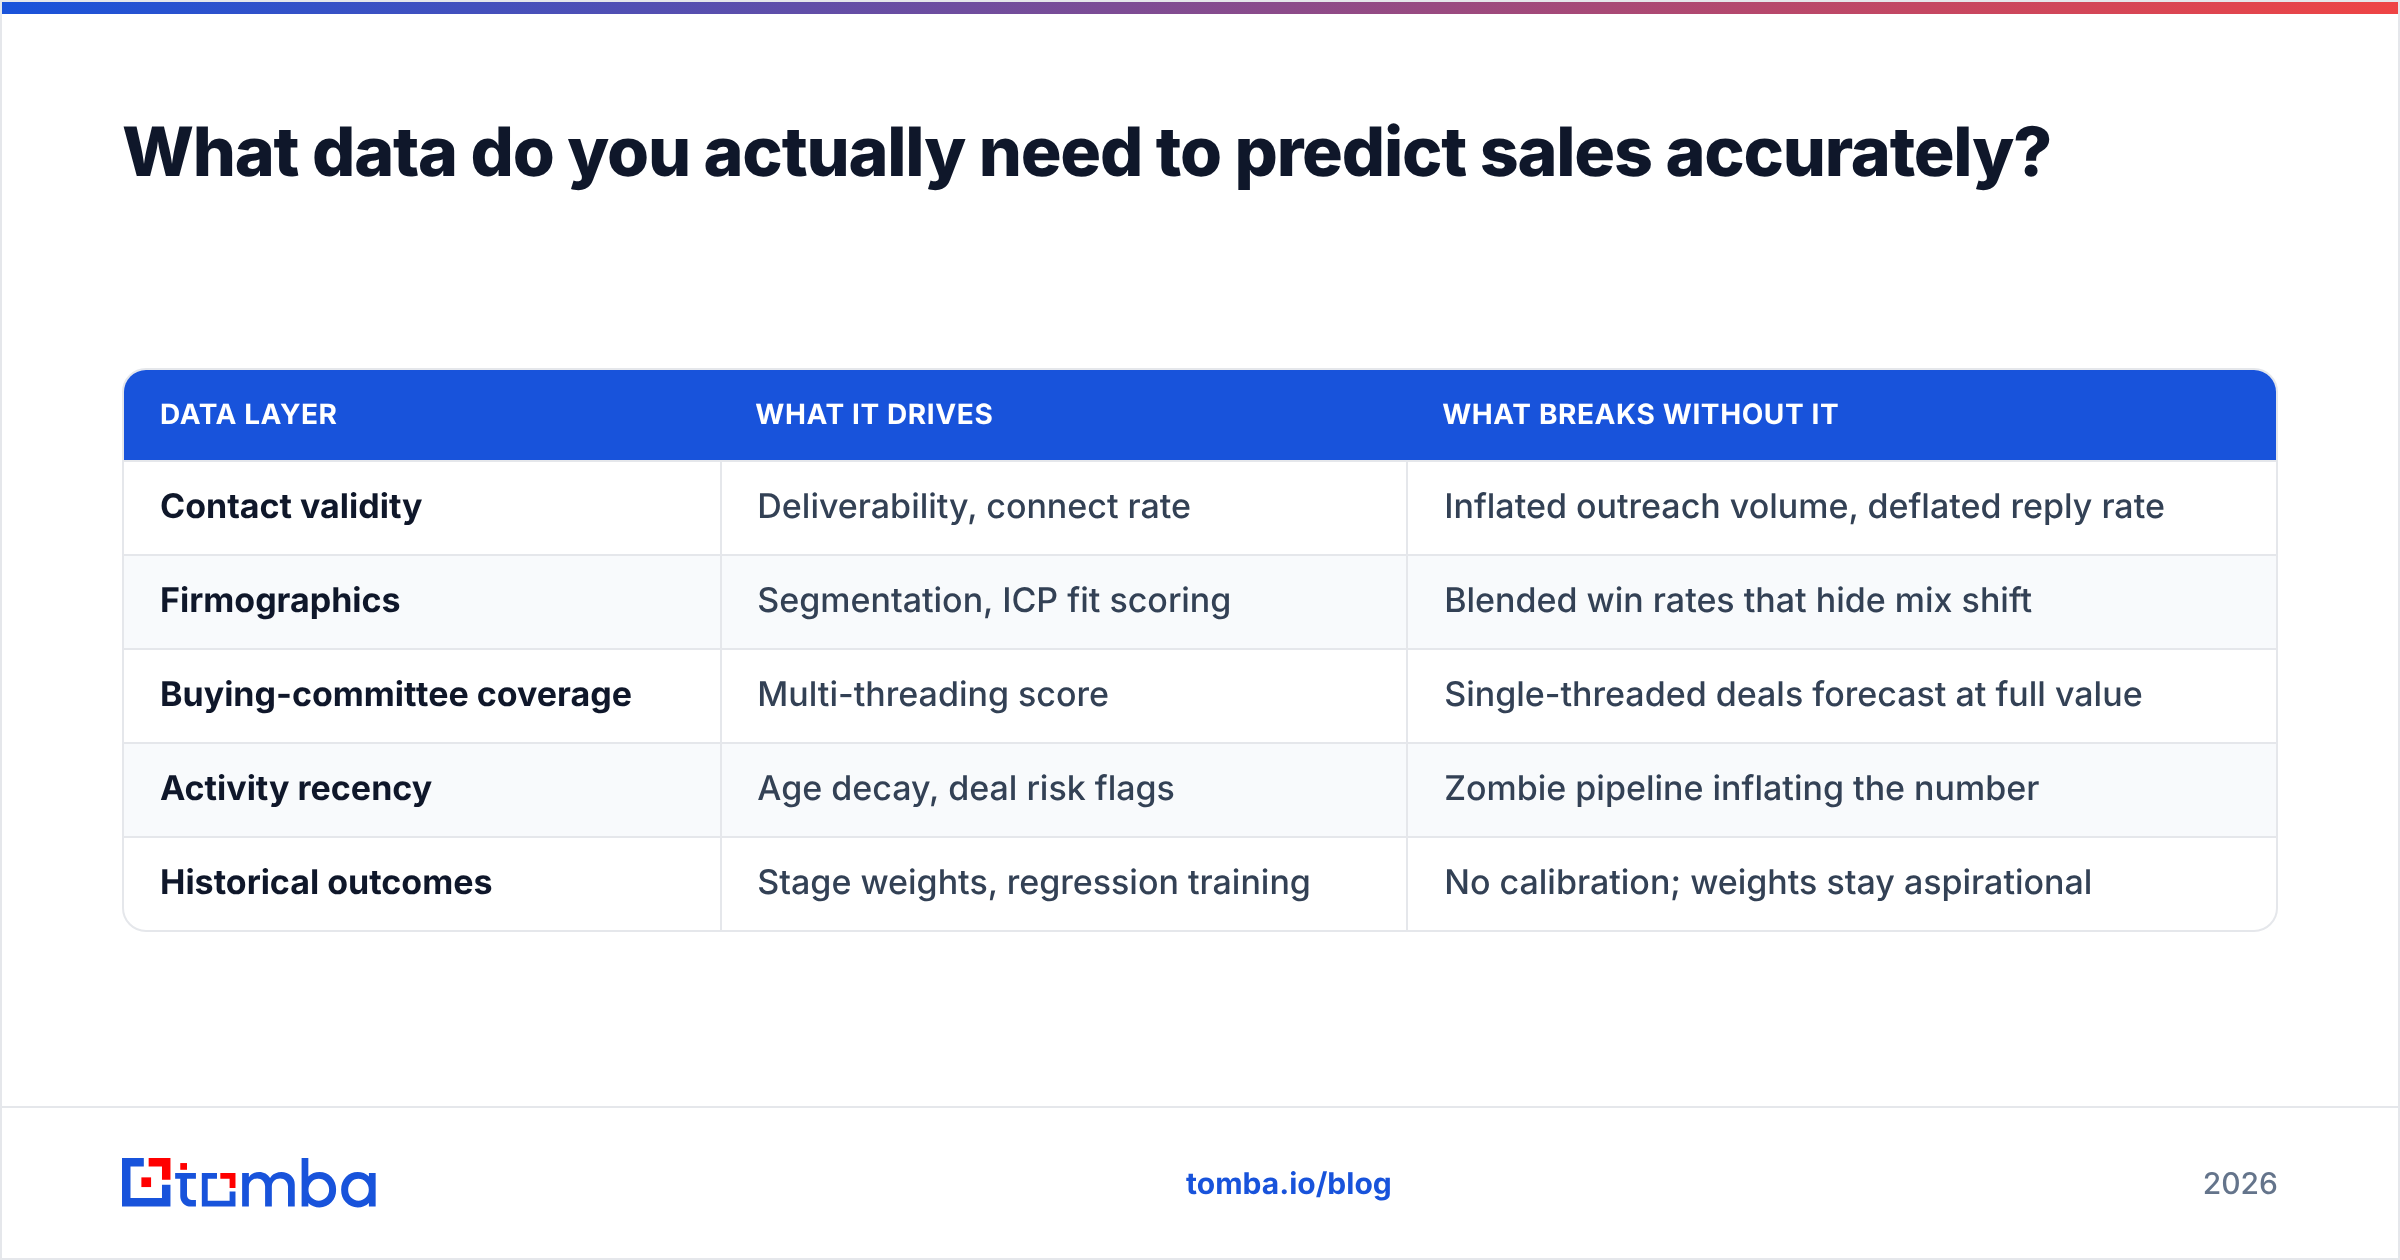
Forecast quality follows pipeline quality. Pipeline quality follows contact data quality. The chain looks like this:
| Data layer | What it drives | What breaks without it |
|---|---|---|
| Contact validity | Deliverability, connect rate | Inflated outreach volume, deflated reply rate |
| Firmographics | Segmentation, ICP fit scoring | Blended win rates that hide mix shift |
| Buying-committee coverage | Multi-threading score | Single-threaded deals forecast at full value |
| Activity recency | Age decay, deal risk flags | Zombie pipeline inflating the number |
| Historical outcomes | Stage weights, regression training | No calibration; weights stay aspirational |
The first row is where most teams leak accuracy without noticing. Say your outbound list bounces at 25%. Your contacted count is fiction. Your reply-rate denominator is wrong. And the conversion ratio behind your whole forecast measures a group of people who do not exist.
Cleaning that layer is simple work. Verify emails before import. Enrich company records so segmentation stays consistent. Confirm the contacts on a deal match the roles your ICP requires. Tools like data enrichment and domain search turn that into a batch job instead of manual cleanup. If you buy contact lists, providers such as BookYourData supply verified B2B records, which cuts the pre-import work. That helps most when you need coverage in a segment you have never prospected.
Beyond contact data, four inputs punch above their weight:
- Days since the last meaningful activity — the best single predictor of deal slippage in most CRM data.
- Contacts with two-way engagement — replies received, not emails sent.
- A next step on the calendar — deals without a dated next step slip far more often.
- Source channel — inbound and outbound close at different rates, so blending them corrupts both.
Can AI predict sales better than a spreadsheet?#
Sometimes. The condition is volume. AI forecasting tools — revenue intelligence platforms like Gong and the forecasting modules inside major CRMs — run models over deal attributes and conversation data. They spot patterns humans miss: which words in a discovery call track with a win, which competitor mentions predict a loss.
They need data to work. The rough bar is a few hundred closed deals per segment. Below that, a well-kept weighted-stage spreadsheet does better. You get confident predictions built on noise, which is worse than an honest spreadsheet, because it shuts down the human review that would have caught the error.
One more caveat: these models are trained on your past. They predict more of what already happened. A price change, a new rival, or a category shift will not show up until it has already hurt you. Keep human judgment in the loop for exactly that reason.
What AI genuinely does better than a spreadsheet:
- Deal risk flagging — surfacing the deal that went quiet before a human notices.
- Activity-to-outcome links — showing which behaviors actually predict wins.
- Rep calibration scoring — learning that one rep sandbags by 20% and another overcommits by 30%, then adjusting.
- Anomaly detection — flagging a quarter whose mix looks unlike any prior quarter.
For a broader view of how vendors compare on data and modeling claims, G2's sales analytics category is a fair neutral starting point.
How do you know if your forecast is any good?#
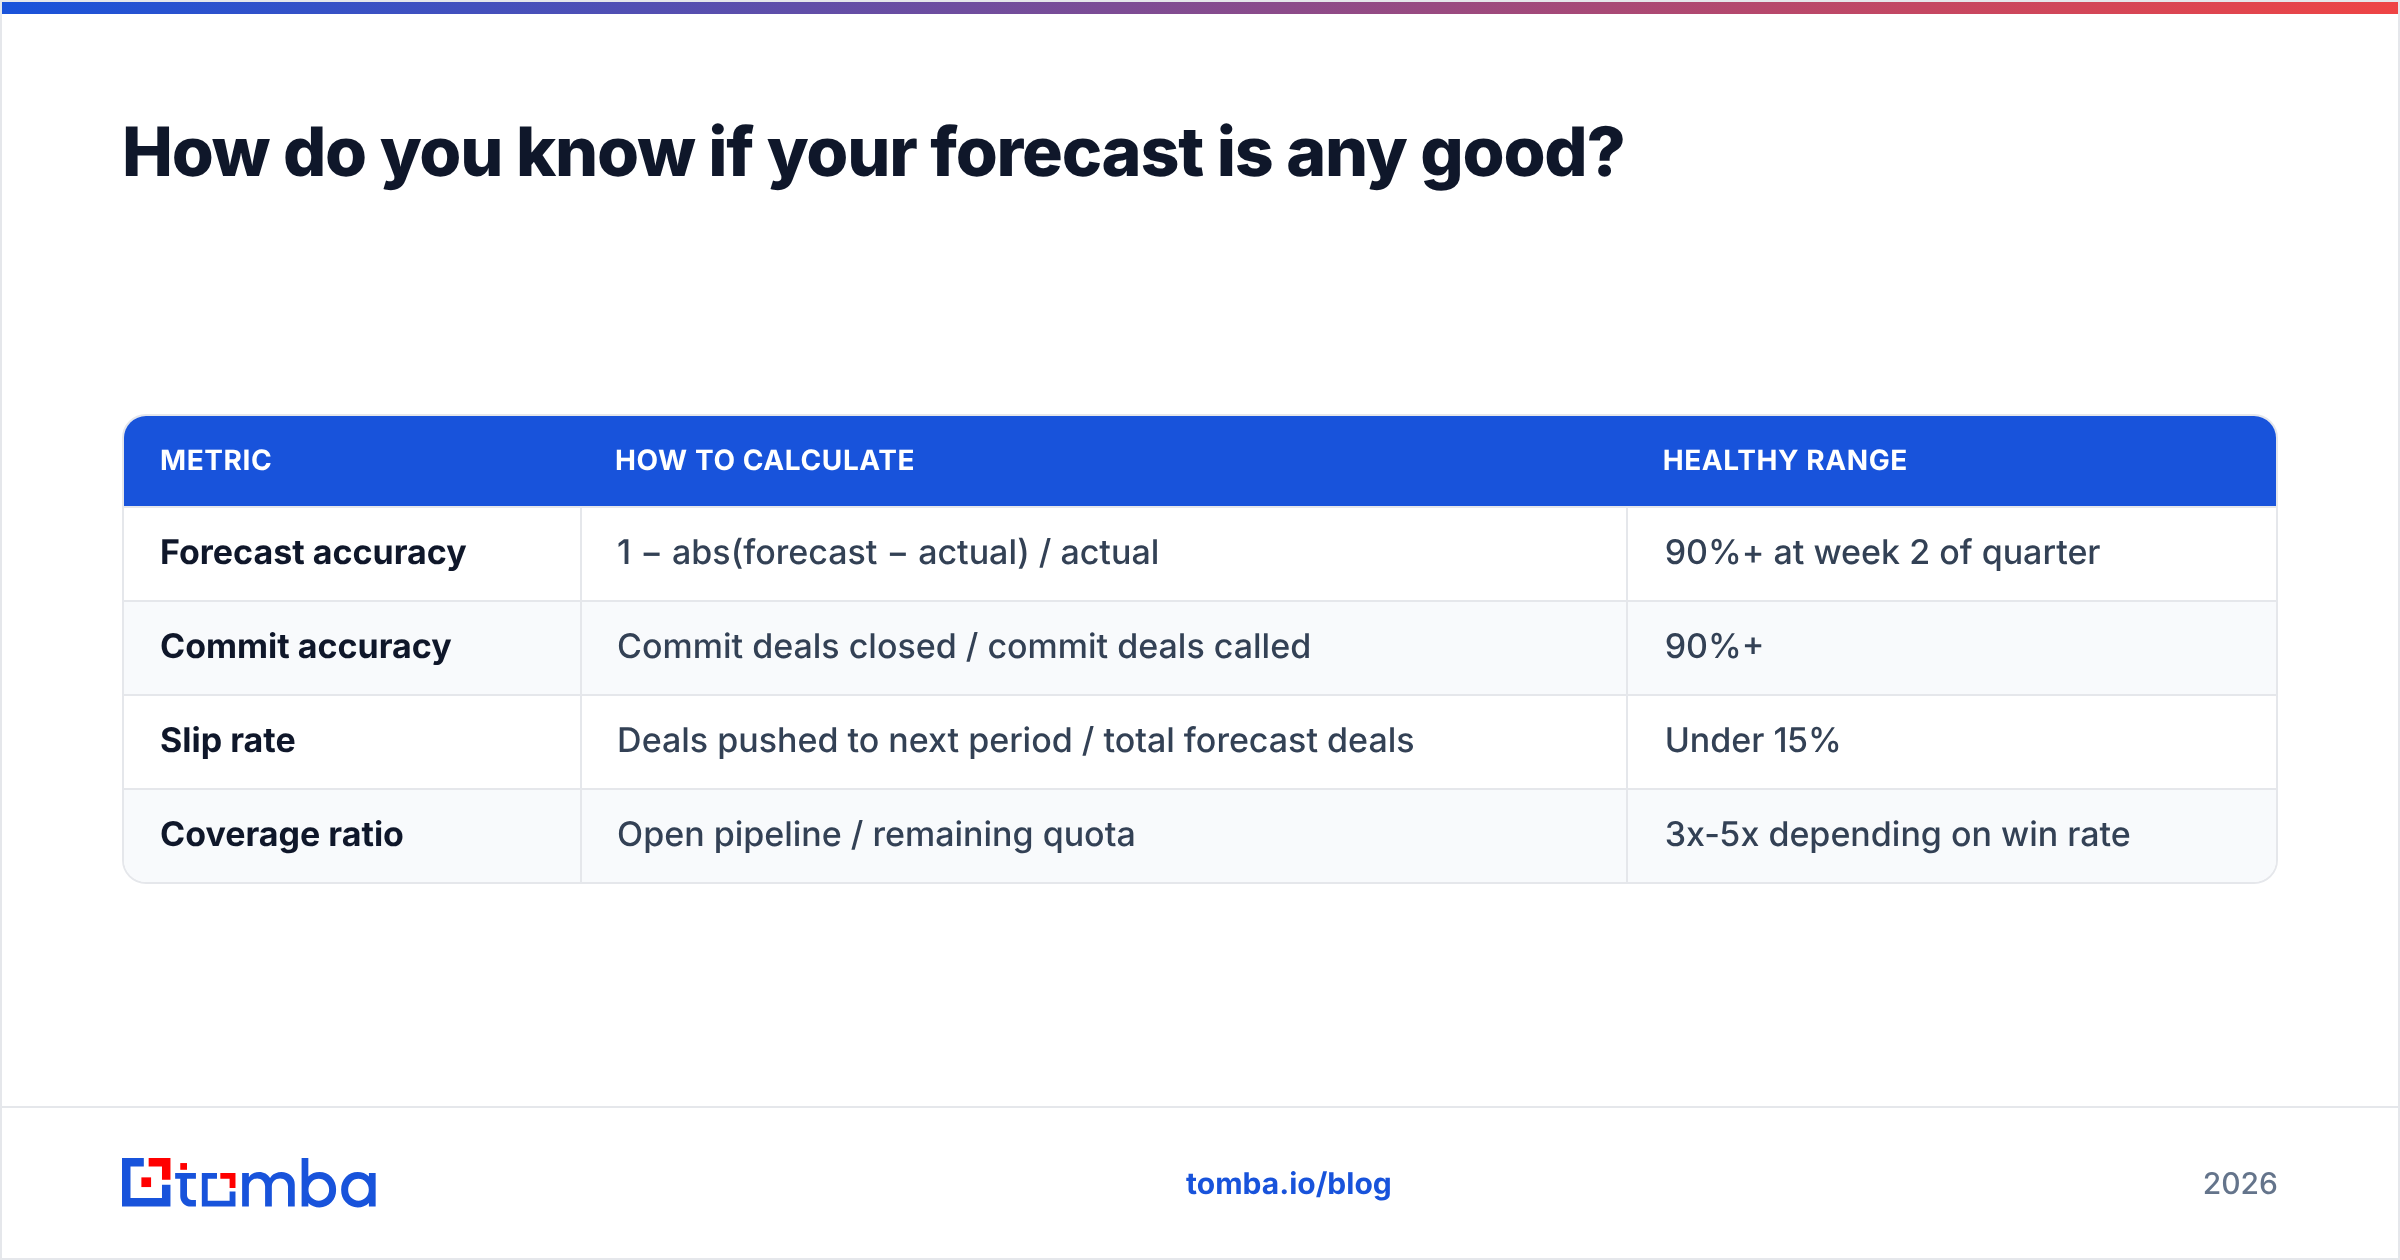
Measure it. Track these metrics every quarter:
| Metric | How to calculate | Healthy range |
|---|---|---|
| Forecast accuracy | 1 − abs(forecast − actual) / actual | 90%+ at week 2 of quarter |
| Commit accuracy | Commit deals closed / commit deals called | 90%+ |
| Slip rate | Deals pushed to next period / total forecast deals | Under 15% |
| Coverage ratio | Open pipeline / remaining quota | 3x-5x depending on win rate |
Suppose forecast accuracy is above 90% but commit accuracy is below 85%. Your reps are wrong and the model is absorbing their error. That is tolerable, but fragile. If both are low, stop tuning the model and audit the data.
Watch the shape of the miss too. Always under actual means sandbagging, which is a culture problem. Always over means happy ears, which is a qualification problem. Random error in both directions means noisy inputs. That is usually data hygiene, and usually fixable in a quarter.
Track your win rate by segment and cohort, not in aggregate. A stable blended win rate can hide enterprise collapsing while SMB booms. Sooner or later that produces a miss nobody saw coming.
What should you do this quarter?#
If you remember one thing about how to predict sales, make it this: pick one method above your current level and adopt it properly, rather than adopting three badly.
Forecasting on rep judgment alone? Move to pipeline coverage this month. It needs one number you already have and one you can work out in an afternoon.
On coverage math? Move to weighted stages. Recalculate the weights from your own history first. The defaults shipped in your CRM did not come from your business.
On weighted stages and still missing? The problem is input quality, not model choice. Audit stage hygiene, add age decay, and clean the contact data at the top of the funnel.
Forecast accuracy compounds. Each quarter you measure your own error and recalibrate, the model gets tighter and the board conversations get shorter.
Start where the error starts. If your pipeline ratios rest on contacts that bounce, no forecasting model will save the number. Use the Tomba Email Finder to source verified professional emails by domain, name, or company. Then the leads entering your CRM are real before they ever hit a forecast weight. The free tier includes 25 searches per month, and paid plans start at $49/mo. Full Tomba pricing is available if you need bulk volume or API access for automated enrichment.
Related guides#
// get started
Find, verify and enrich your first contacts today
Start on the free plan with 25 searches a month, then scale when your team is ready.
Free plan · No credit card required · GDPR & CCPA
Get the Tomba newsletter
Product and data updates
// about the author