How to Set Sales Targets in 2026: A Practical Quota Guide
Most sales targets are invented in a spreadsheet and defended for twelve months. Here is a bottom-up method that survives contact with your pipeline data, plus the math to check whether your quota is even reachable.
TL;DR
- Set sales targets bottom-up first (capacity × conversion × cycle time), then reconcile against the board's top-down number. The gap between the two is your real hiring, pipeline, or pricing problem.
- A target is only valid if every rep can physically reach it. Run the capacity math: working days × meetings per day × win rate × average deal size.
- Quota attainment across healthy B2B teams sits around 50-70% of reps hitting number. If 95% of your team hits, the target is too low. If 20% hit, you have a modeling failure, not a motivation failure.
- Pipeline coverage of 3x-4x quota is the standard rule of thumb, but the correct multiple is
1 / win rate. Measure it, don't inherit it. - Targets fail most often at the top of the funnel — not enough contactable prospects. Fixing data quality is usually cheaper than raising quota.
What Is a Sales Target, and How Is It Different From a Quota?#
A sales target is the revenue or unit outcome you commit to for a defined period. A quota is that target broken down and assigned to an individual rep or team. People use the words interchangeably, and that sloppiness is where most planning goes wrong: the company target is a forecast of the business, while a quota is a compensation instrument attached to a human being with a mortgage.
Think of it like a restaurant. The target is "we will serve 400 covers on Saturday." The quota is "each of the four servers handles 100 covers." If your kitchen can only plate 300, the quota is fiction and you will lose staff, not gain revenue.
Three variables make a target usable:
- Time horizon — annual for the board, quarterly for planning, monthly for coaching. Anything shorter than a sales cycle is noise.
- Unit of measure — new ARR, total bookings, gross margin, logos, or expansion. Mixing them in one number hides which motion is broken.
- Assignment level — company, region, segment, rep. Each level needs its own coverage math, not a flat division of the top number.
How Do You Set Sales Targets Bottom-Up?#
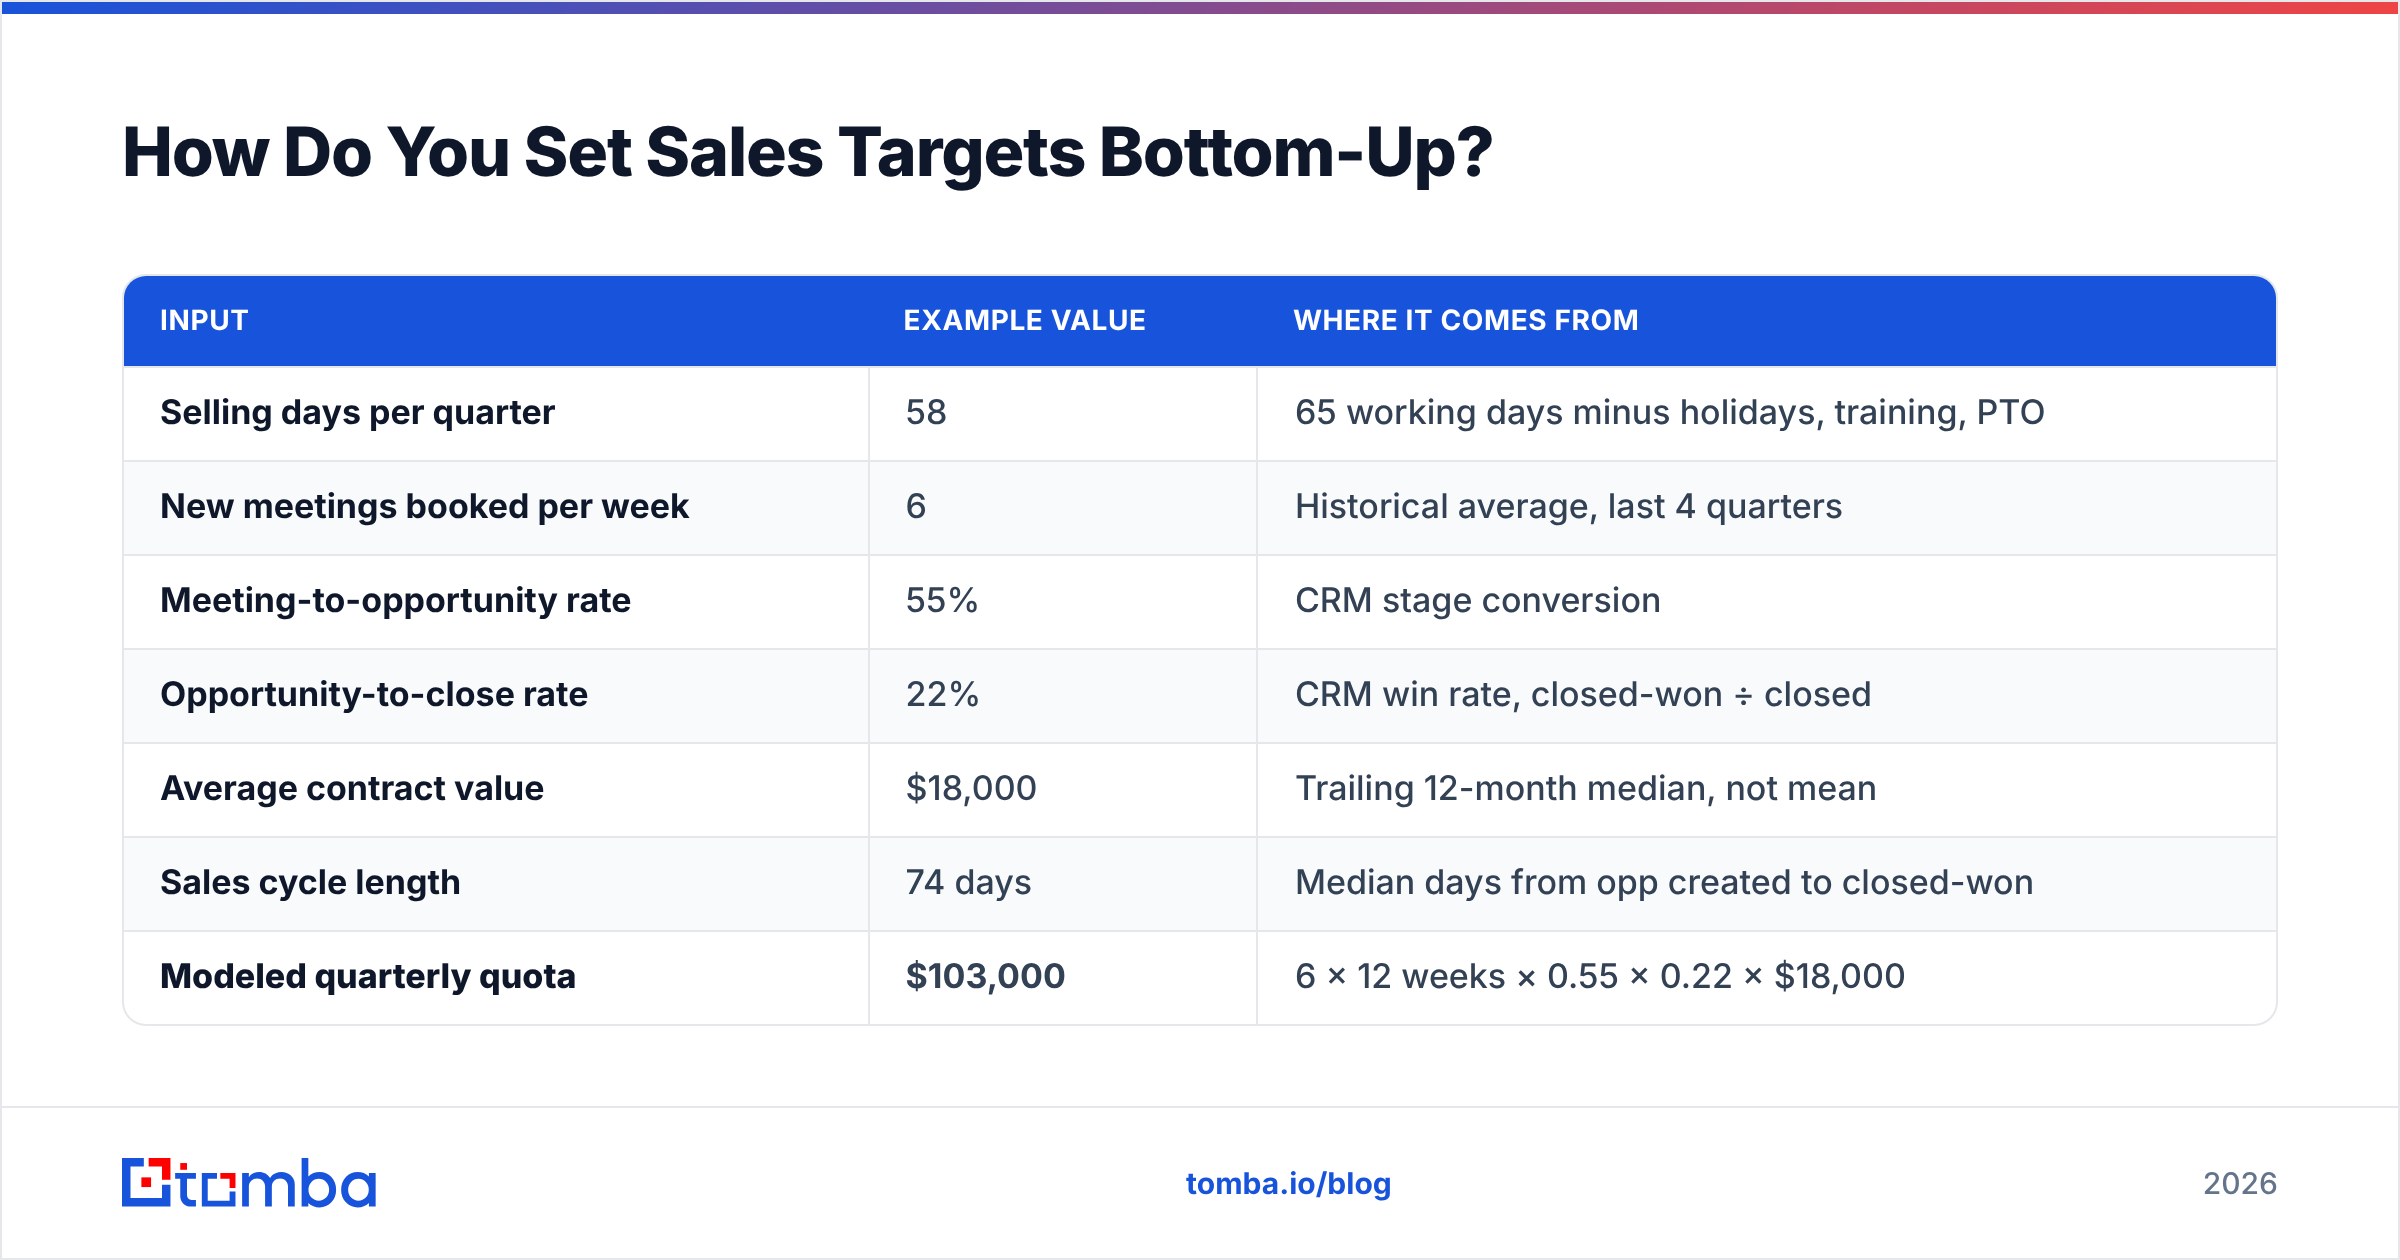
Start with what your team can physically do, then multiply. This is the only method that produces a target you can defend line by line in a board meeting.
Here is the calculation chain for a single rep on a mid-market SaaS motion:
| Input | Example value | Where it comes from |
|---|---|---|
| Selling days per quarter | 58 | 65 working days minus holidays, training, PTO |
| New meetings booked per week | 6 | Historical average, last 4 quarters |
| Meeting-to-opportunity rate | 55% | CRM stage conversion |
| Opportunity-to-close rate | 22% | CRM win rate, closed-won ÷ closed |
| Average contract value | $18,000 | Trailing 12-month median, not mean |
| Sales cycle length | 74 days | Median days from opp created to closed-won |
| Modeled quarterly quota | $103,000 | 6 × 12 weeks × 0.55 × 0.22 × $18,000 |
Note the median rather than the mean on ACV. One $400k whale will inflate the mean and hand every rep an impossible number for the next twelve months.
Now stress the model. Run it three ways: conservative (win rate down 20%), expected (trailing average), and aggressive (win rate up 15% with a stated reason, like a new pricing tier). Present all three. A single-point target signals false precision, and experienced CFOs discount it immediately.

The bottom-up number will almost always land below the top-down number the board wants. That gap is the honest part of planning. You close it with headcount, pipeline generation, price increases, or a longer horizon — not by editing the spreadsheet cell.
What Data Do You Need Before Setting a Target?#
Six inputs, and you need all six. Missing any one turns the exercise into a guess:
- Trailing 12-month win rate by segment — not blended. SMB and enterprise win rates often differ by 3x, and a blended figure sets both teams up to fail.
- Median deal size and its distribution — pull the p25, p50, p75. If p75 is 4x p50, your quota model is hostage to outliers.
- Sales cycle length by source — inbound closes faster than outbound almost everywhere. If your target assumes an inbound cycle on an outbound-heavy quarter, you will miss on timing alone.
- Ramp curve for new hires — a rep hired in month two of the quarter does not carry a full quota. Standard is 25% / 50% / 75% / 100% across four quarters.
- Total addressable contacts in territory — how many real, reachable buyers exist? This is the constraint nobody checks until Q3.
- Historical attainment distribution — what percentage of reps hit last year, and by how much did the top and bottom deciles diverge?
That fifth input deserves more attention than it usually gets. If a rep needs 6 meetings a week and books 1 in 12 contacted prospects, they need roughly 72 contactable people per week — about 3,700 a year. If your territory holds 2,000 accounts with valid contact data, the target is dead on arrival regardless of effort. Running a domain search across your named account list before planning season tells you whether the territory can actually support the number, and a quick pass through an email verifier tells you what share of those contacts are still live.
Top-Down vs Bottom-Up: Which Method Should You Use?#
Both, in that order of skepticism. Here is how the two approaches compare in practice:
| Dimension | Top-down | Bottom-up | Hybrid (recommended) |
|---|---|---|---|
| Starting point | Board revenue commitment | Rep capacity and conversion data | Bottom-up model, reconciled to board number |
| Time to produce | Hours | 1-2 weeks | 2 weeks |
| Rep buy-in | Low — feels arbitrary | High — built from their own numbers | High, with a documented gap |
| Accuracy in year 1 | Poor without history | Poor without clean CRM data | Best available |
| Failure mode | Quota inflation, attrition | Sandbagging, under-ambition | Slower planning cycle |
| Best for | Fundraising narratives, mature markets | Teams with 4+ quarters of clean data | Most B2B teams above 5 reps |
| Handles new segments | Badly | Badly — no historical baseline | Use analog segment data as proxy |
The hybrid method is not a compromise. It is a forcing function: you produce the bottom-up number, you receive the top-down number, and then you write down exactly what has to change for them to meet. That written gap — "we need 4 more AEs starting in February and a 12% lift in meeting rate" — becomes your operating plan. Without it, you have a number and a hope.
How Do You Split the Target Across Reps and Territories?#
Equal division is the default and it is usually wrong. Territories differ in account density, buying power, competitive saturation, and existing customer base. A flat split rewards whoever inherited the good patch.
Weight assignments on:
- Account count and quality in territory — 200 well-fit accounts beats 800 marginal ones.
- Existing pipeline carried in — a rep starting with $600k in stage-3 opportunities is not starting where a rep with $80k is.
- Renewal and expansion base — if expansion counts toward quota, a large book is a head start that must be priced into the number.
- Tenure and ramp status — apply the ramp curve mechanically, not case by case.
- Segment win rate — enterprise reps carry fewer, larger deals with longer cycles and more variance.
A practical guardrail: no rep's quota should exceed 1.3x the team median without a documented reason like a named-account book or a senior title. Beyond that spread, you are effectively running two different jobs under one title.
How Do You Know If Your Sales Target Is Realistic?#
Run four checks before you publish the number. Each one takes under an hour.
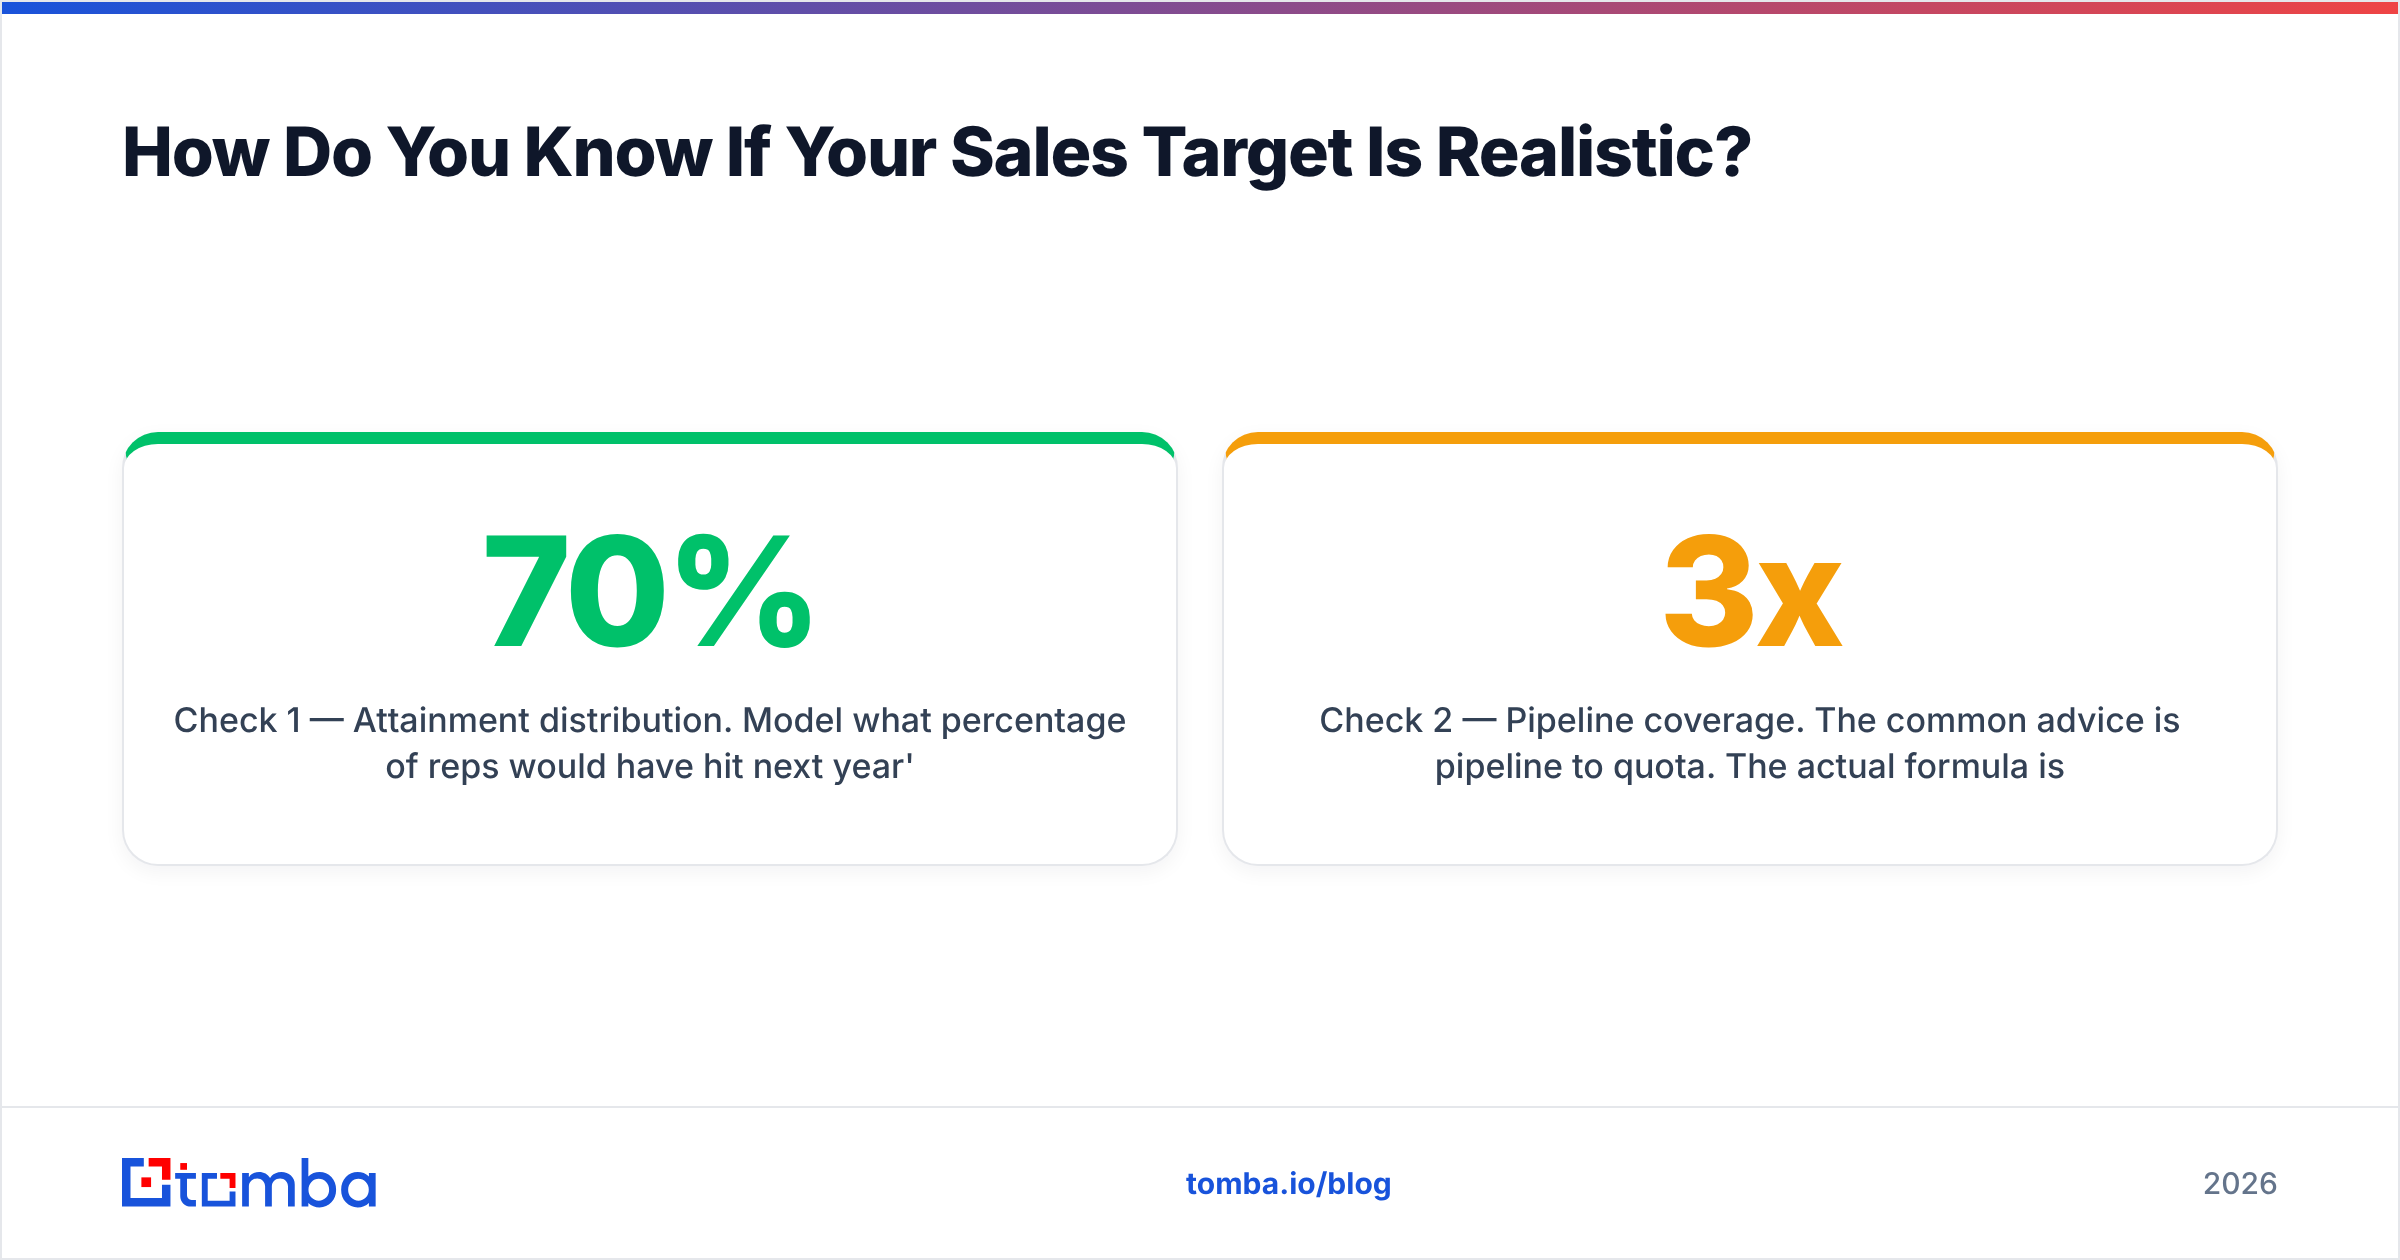
Check 1 — Attainment distribution. Model what percentage of reps would have hit next year's quota using last year's actual performance. Research summarized across sales-performance benchmarks consistently puts healthy attainment near the 50-70% band. Anything above 90% means you left money on the table; below 40% means the plan will drive attrition before it drives revenue.
Check 2 — Pipeline coverage. The common advice is 3x pipeline to quota. The actual formula is 1 ÷ win rate. A 20% win rate needs 5x coverage. A 40% win rate needs 2.5x. Using a borrowed 3x when you win 15% of deals guarantees a miss, and you will not notice until the quarter is half gone.
Check 3 — Activity feasibility. Divide the required meeting count by selling days. If a rep needs 4.2 first meetings a day on top of running existing deals, the number fails on physics. Nobody out-hustles arithmetic.
Check 4 — Data supply. Count the contactable prospects required to feed the model, then count what you actually have. This is where most plans quietly break. Building the list with a reliable email finder and checking bounce risk before the quarter starts is far cheaper than discovering in week six that half the territory has no working contact data.

For a broader view of how attainment and quota-setting norms are tracked across the industry, Gartner's sales research and HubSpot's sales benchmark reporting are both reasonable public reference points to sanity-check your assumptions against.
What Are the Most Common Sales Target Mistakes?#
Setting the target from the revenue you need, not the revenue you can produce. Financial need is a constraint, not a forecast. If the model says $8M and the plan says $12M, the answer is a bridge — new headcount, new channel, price change — not a bigger number in the same cell.
Changing quotas mid-year. Mid-year quota increases after a strong Q1 are the fastest way to teach a team that overperformance is punished. Reps sandbag the following year, and your forecast quality degrades permanently.
Ignoring ramp. A team of 12 with 5 hires landing in Q2 does not have 12 quota-carrying reps. Model each hire on the ramp curve or your Q2 target will be off by 20% or more.
One target for mixed motions. Self-serve, inbound-assisted, and outbound enterprise are different businesses. A single blended quota hides which one is actually working.
Treating the target as the only metric. Track leading indicators weekly — meetings booked, opportunities created, stage-2 conversion. By the time revenue tells you something is wrong, you have lost a full sales cycle. Keeping an eye on response rate at the top of funnel gives you 60 days of warning that a bookings number never will.
Never revisiting the model. Re-run the bottom-up math each quarter with fresh conversion data. The target stays fixed for compensation purposes; the model that produced it should keep learning.
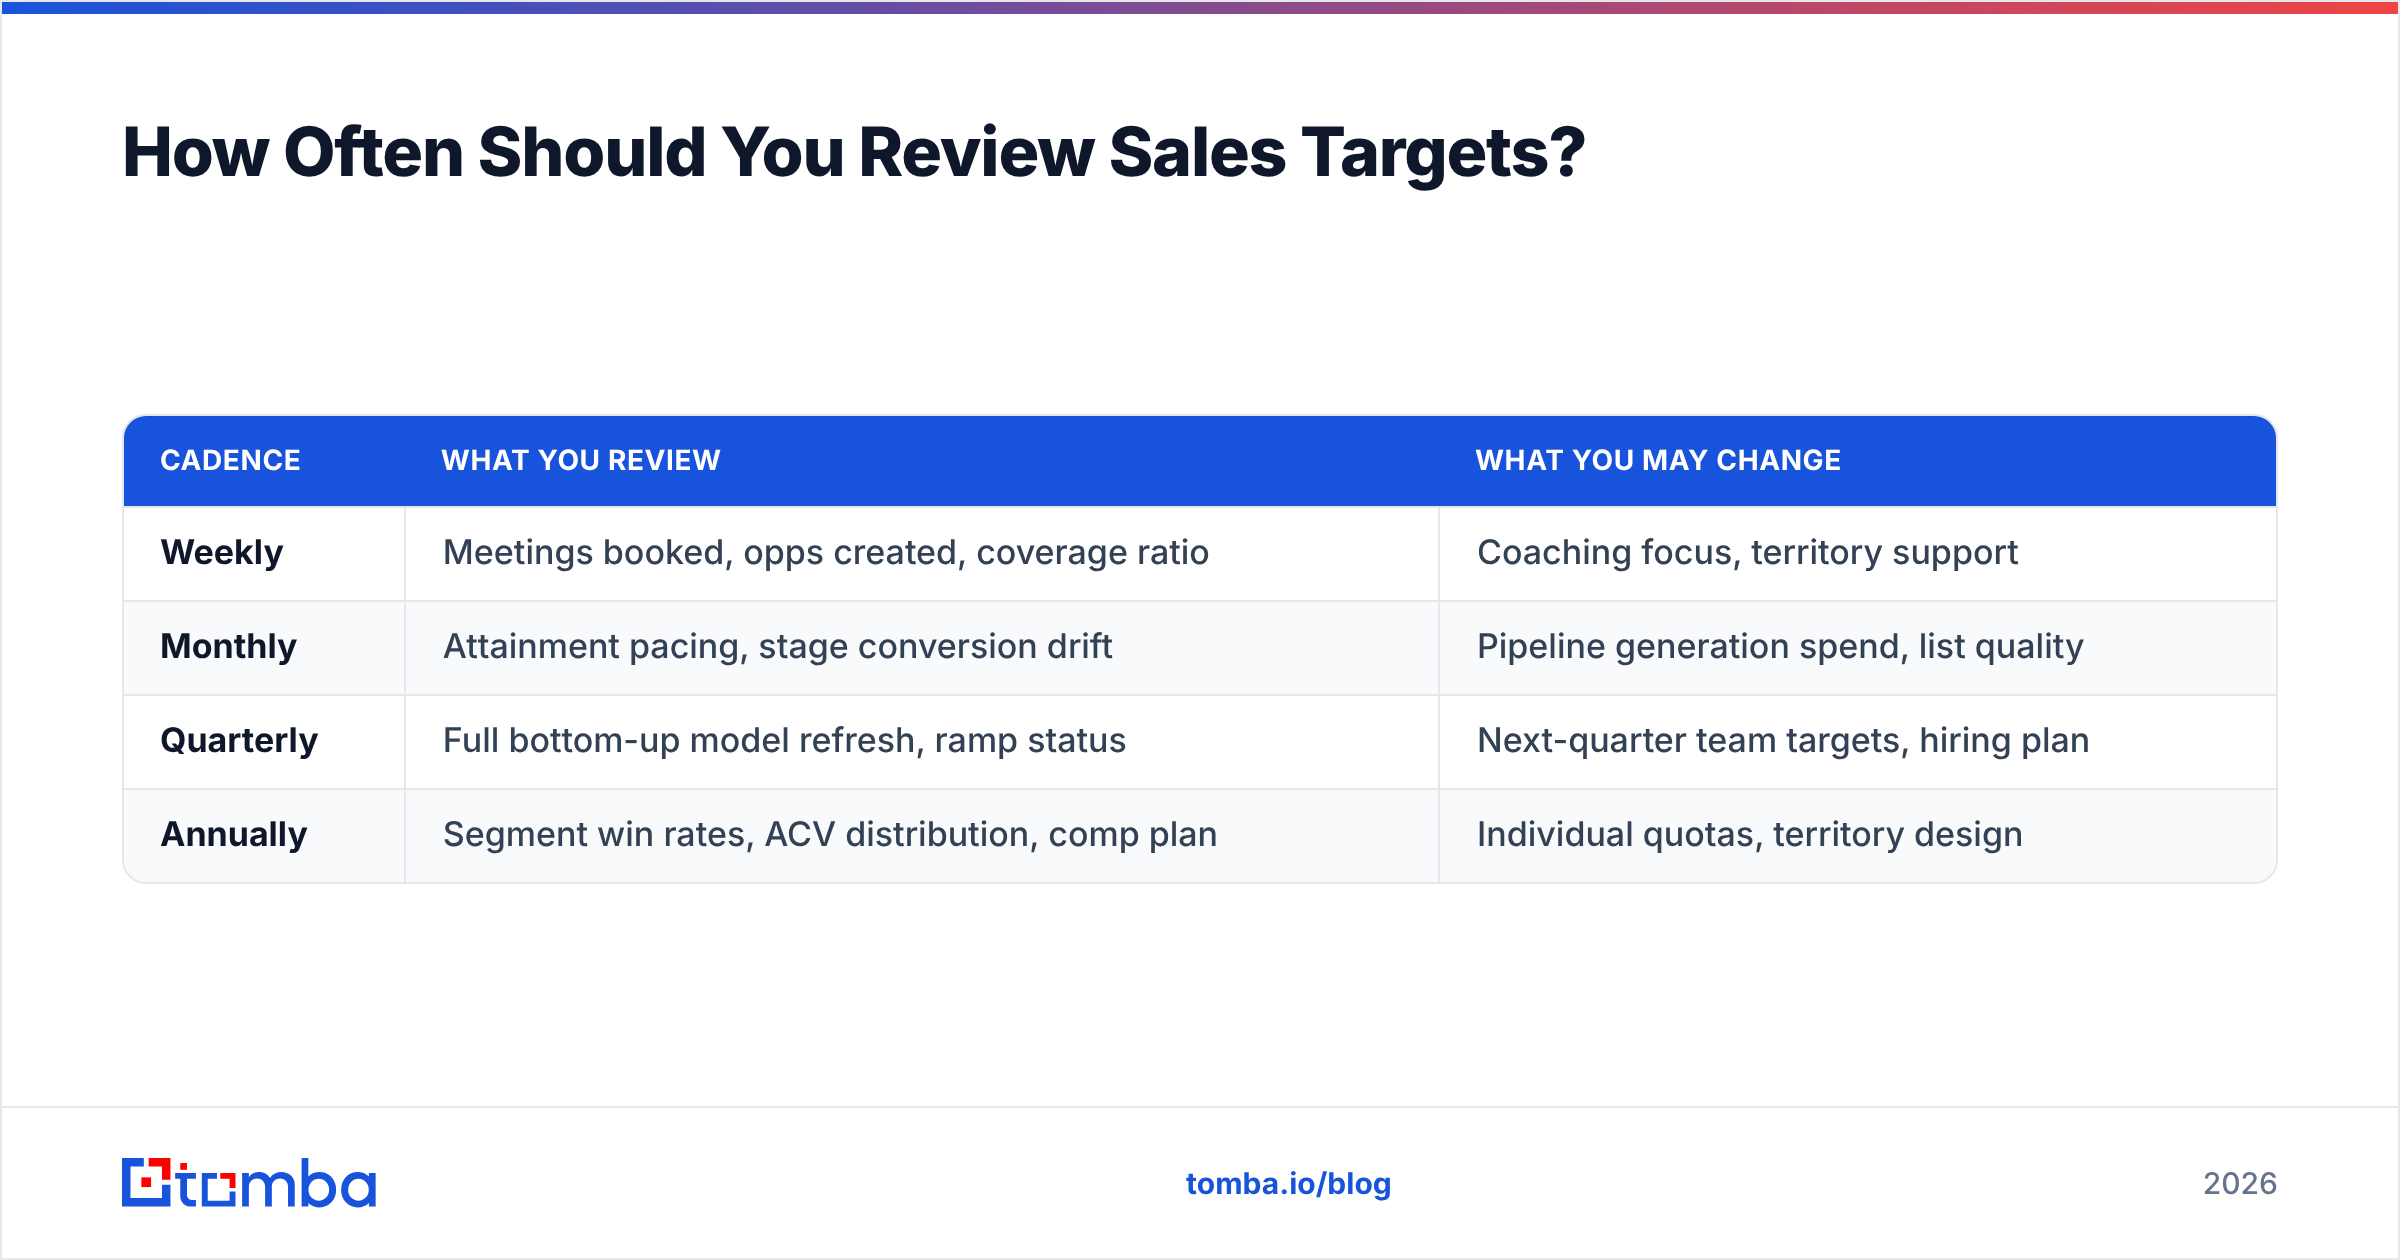
How Often Should You Review Sales Targets?#
| Cadence | What you review | What you may change |
|---|---|---|
| Weekly | Meetings booked, opps created, coverage ratio | Coaching focus, territory support |
| Monthly | Attainment pacing, stage conversion drift | Pipeline generation spend, list quality |
| Quarterly | Full bottom-up model refresh, ramp status | Next-quarter team targets, hiring plan |
| Annually | Segment win rates, ACV distribution, comp plan | Individual quotas, territory design |
The rule that keeps teams honest: review the model constantly, change the committed quota rarely. Quota stability is what makes the compensation plan credible, and credibility is what makes reps run through walls in month eleven.
Putting the Plan Into Practice#
A sales target is a supply chain problem wearing a finance costume. Revenue at the end depends on contactable buyers at the start, and the number of contactable buyers is the input most teams never measure before committing to a number.
Before your next planning cycle, count what your territory can actually feed. Pull your named account list, run it through Tomba's Email Finder to see how many real, reachable decision-makers sit behind those logos, and verify them so your meeting-rate assumption survives contact with reality. The free tier covers 25 searches a month if you just want to spot-check a territory; the Starter plan at $49/mo handles a full quarter of list building, with Growth at $99/mo for teams running multiple territories. Full Tomba pricing is public, and everything is available through the Tomba API if you want contact coverage feeding your planning model automatically.
Set the target on data you can point at. Then defend it.
Related guides#
// get started
Find, verify and enrich your first contacts today
Start on the free plan with 25 searches a month, then scale when your team is ready.
Free plan · No credit card required · GDPR & CCPA
Get the Tomba newsletter
Product and data updates
// about the author