ICP Sales Strategy: How to Build One and Actually Sell to It
Most ICP documents get built once, presented in a QBR, and never touch a rep's day again. Here's how to turn an ideal customer profile into scoring, tiering, routing, and list-building your team actually uses.
TL;DR
- An ICP sales strategy is not a slide. It's a scoring model, a tiering rule, a routing rule, and a list-building recipe that changes what reps do on Monday morning.
- Build the profile from closed-won and churned accounts, not from who you wish you sold to. Your best five customers and your worst five churns carry more signal than any market report.
- Firmographics get you 60% of the way. Technographics and behavioral triggers are what separate a Tier 1 account from a Tier 3 one that will stall in procurement for nine months.
- Tier the ICP into three buckets with different motions and different economics. One-size outbound against a flat list is why reply rates collapse.
- Measure the ICP on win rate, cycle length, ACV, and 12-month net revenue retention, not on how many meetings you booked.
What Is an ICP Sales Strategy, and How Is It Different From a Persona?#
An ideal customer profile describes the company you should sell to. A buyer persona describes the human inside it. Your ICP sales strategy is the operating system that connects the two to daily rep behavior.
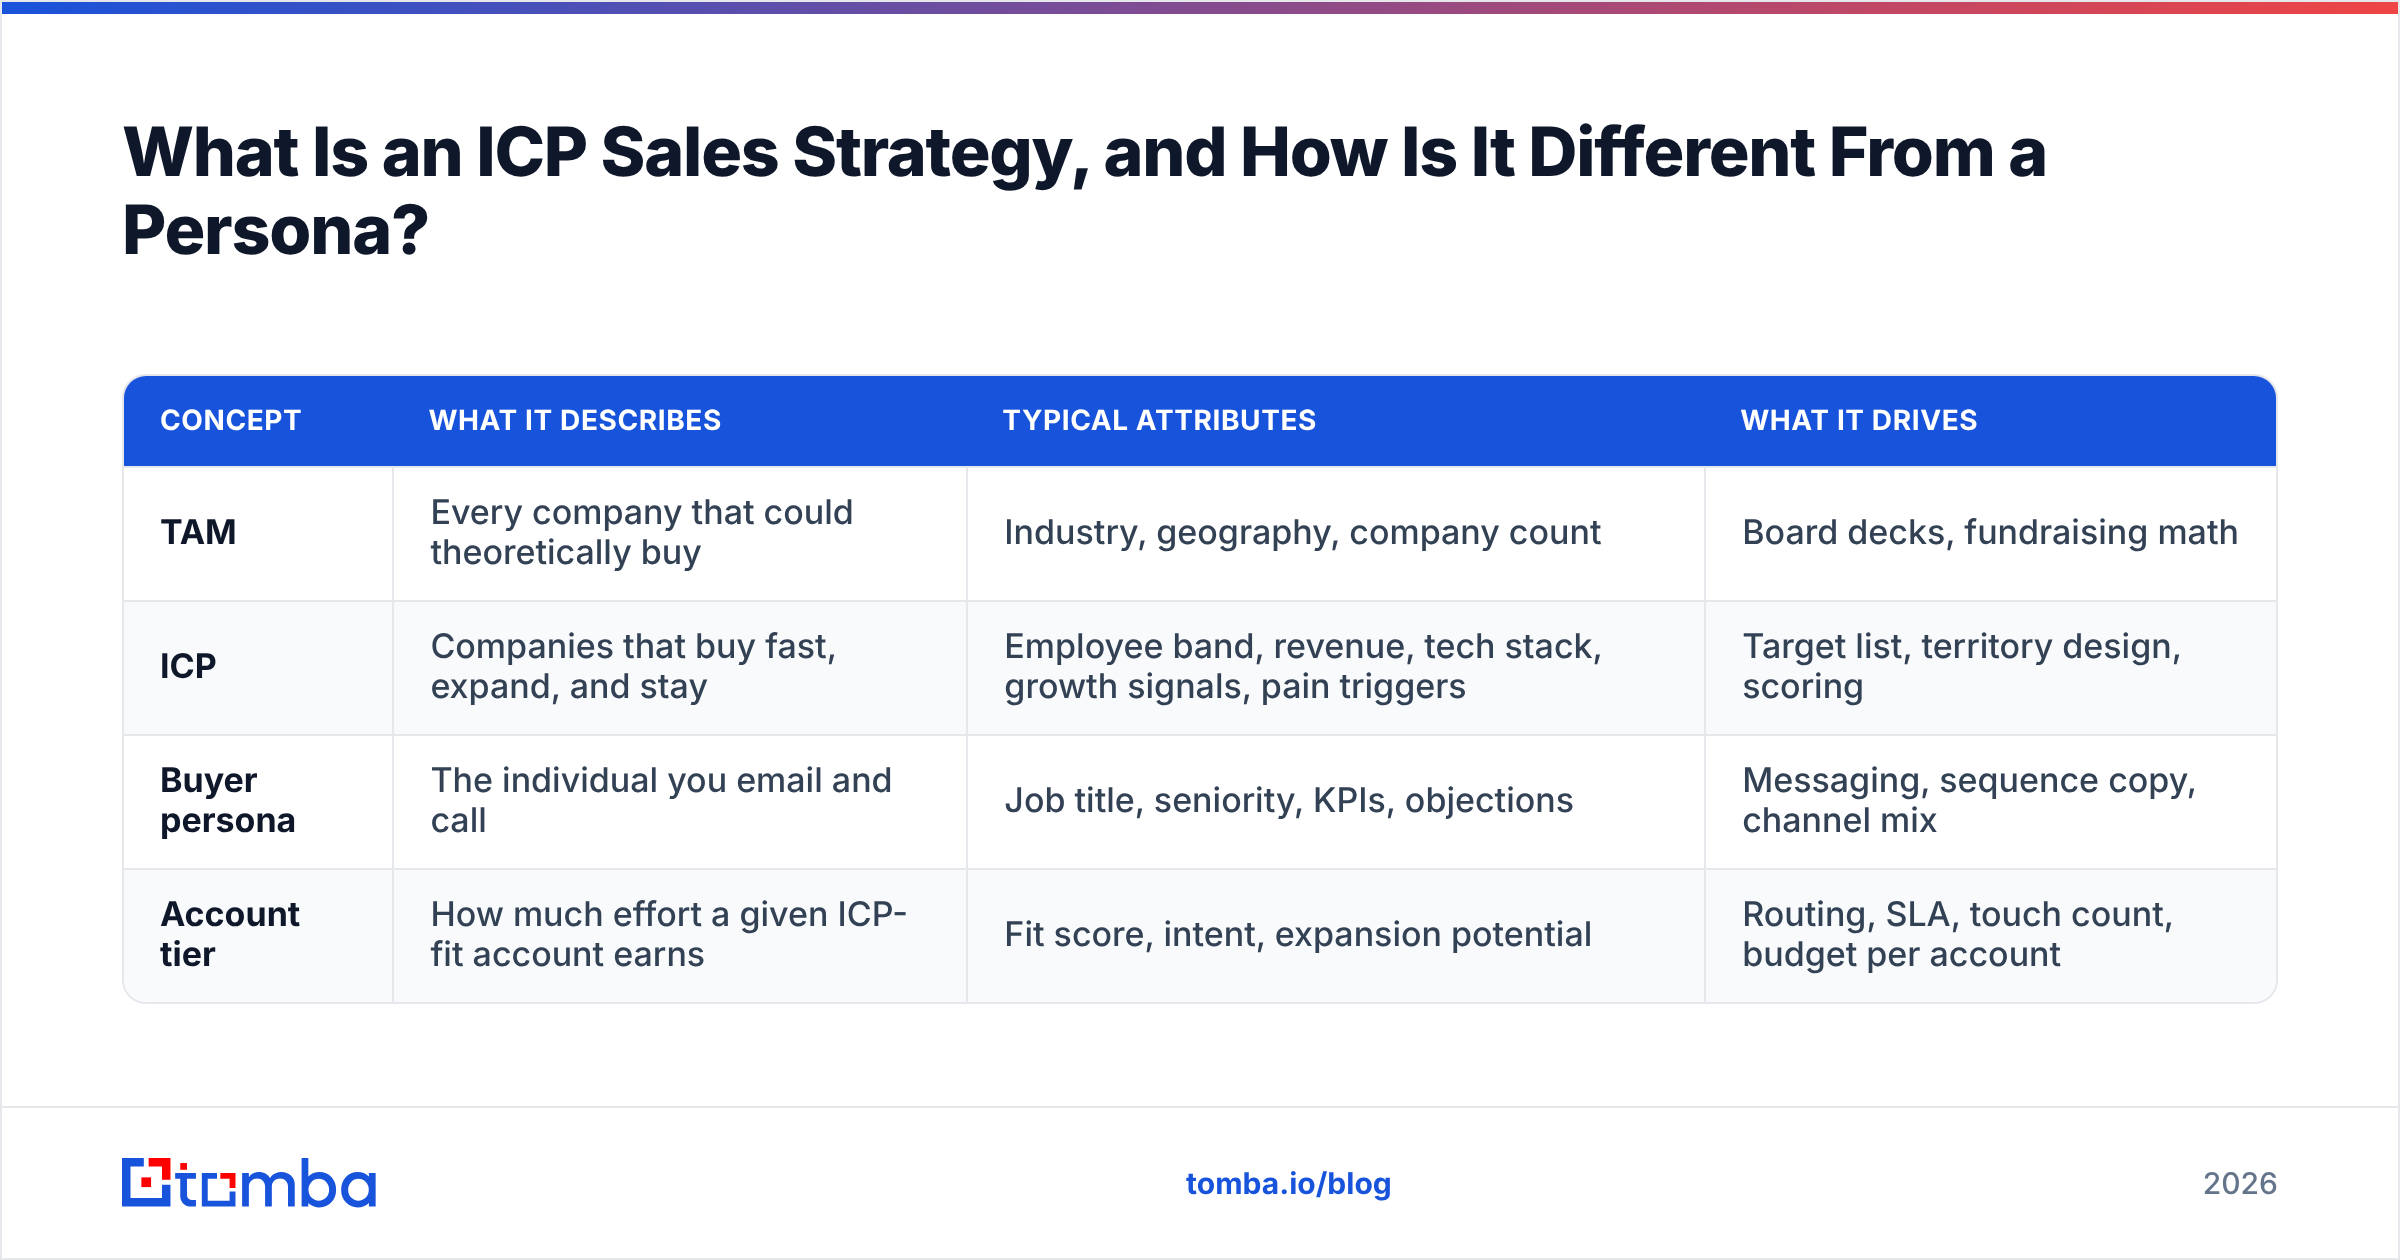
Most teams conflate three separate things, and the confusion is expensive. Here's the clean split:
| Concept | What it describes | Typical attributes | What it drives |
|---|---|---|---|
| TAM | Every company that could theoretically buy | Industry, geography, company count | Board decks, fundraising math |
| ICP | Companies that buy fast, expand, and stay | Employee band, revenue, tech stack, growth signals, pain triggers | Target list, territory design, scoring |
| Buyer persona | The individual you email and call | Job title, seniority, KPIs, objections | Messaging, sequence copy, channel mix |
| Account tier | How much effort a given ICP-fit account earns | Fit score, intent, expansion potential | Routing, SLA, touch count, budget per account |
The failure mode is building the ICP at the TAM level ("mid-market SaaS in North America") and then wondering why a 40,000-company list converts at 0.4%. That definition contains your best customer and your worst churn side by side, and no rep can tell them apart.
A working ICP sales strategy has to survive one test: can a new SDR, given the definition alone, build a 300-account list this afternoon that a VP would approve? If it can't, it's marketing copy, not a strategy.

Why Do Most ICP Documents Never Change a Single Sales Call?#
Three reasons, and all of them are structural rather than analytical.
1. The ICP was built from aspiration, not evidence. Someone picked the logos they wanted on the website. Nobody ran the cohort analysis on which accounts actually renewed at 110% net revenue retention.
2. It lives in a document nobody opens. If the ICP exists as a Notion page and not as a field on the account object in your CRM, it cannot influence routing, forecasting, or list-building. Anything not encoded in the system is a suggestion.
3. It has no exclusion criteria. Good ICPs are as specific about who you don't sell to as who you do. "Under 25 employees," "no dedicated RevOps owner," "runs on a legacy on-prem stack" — these are the rules that save your team 200 wasted hours a quarter. Gartner's sales research has consistently found that buying groups have grown and cycles have lengthened; the only defense is being ruthless about which cycles you enter at all.
The fix for all three is the same: your ICP must produce a score, that score must live on the account record, and that score must change what happens next.
How Do You Build an ICP From Data You Already Have?#
You don't need an analyst team. You need 20 to 50 closed deals and an afternoon.
- Pull three cohorts. Closed-won and still healthy after 12 months. Closed-won and churned. Closed-lost after reaching proposal stage. Ignore everything that died before discovery — that's a prospecting problem, not an ICP problem.
- Attribute every account. Employee count at time of purchase, revenue band, industry (be granular — "logistics software" beats "SaaS"), funding stage, tech stack, whether a specific role existed on the team, and how the deal originated.
- Find the separators. You're looking for attributes where the healthy cohort and the churn cohort diverge sharply. If 80% of your healthy accounts had a dedicated ops hire and 70% of churns didn't, you just found your single most important qualifier.
- Write the exclusion list. Every attribute that shows up disproportionately in the churn cohort becomes a disqualifier, not a "maybe."
- Sanity-check with the field. Read the definition to your two best AEs. If they say "that's basically every deal I've hated," rewrite it.
- Encode it. Turn the separators into a weighted score from 0 to 100 and write it back to the account object.
The step teams skip is number 4. Exclusion criteria feel like leaving money on the table until you calculate what one bad-fit enterprise deal cost in implementation hours, support tickets, and a churned logo in the case-study deck.
What Signals Actually Predict Revenue?#
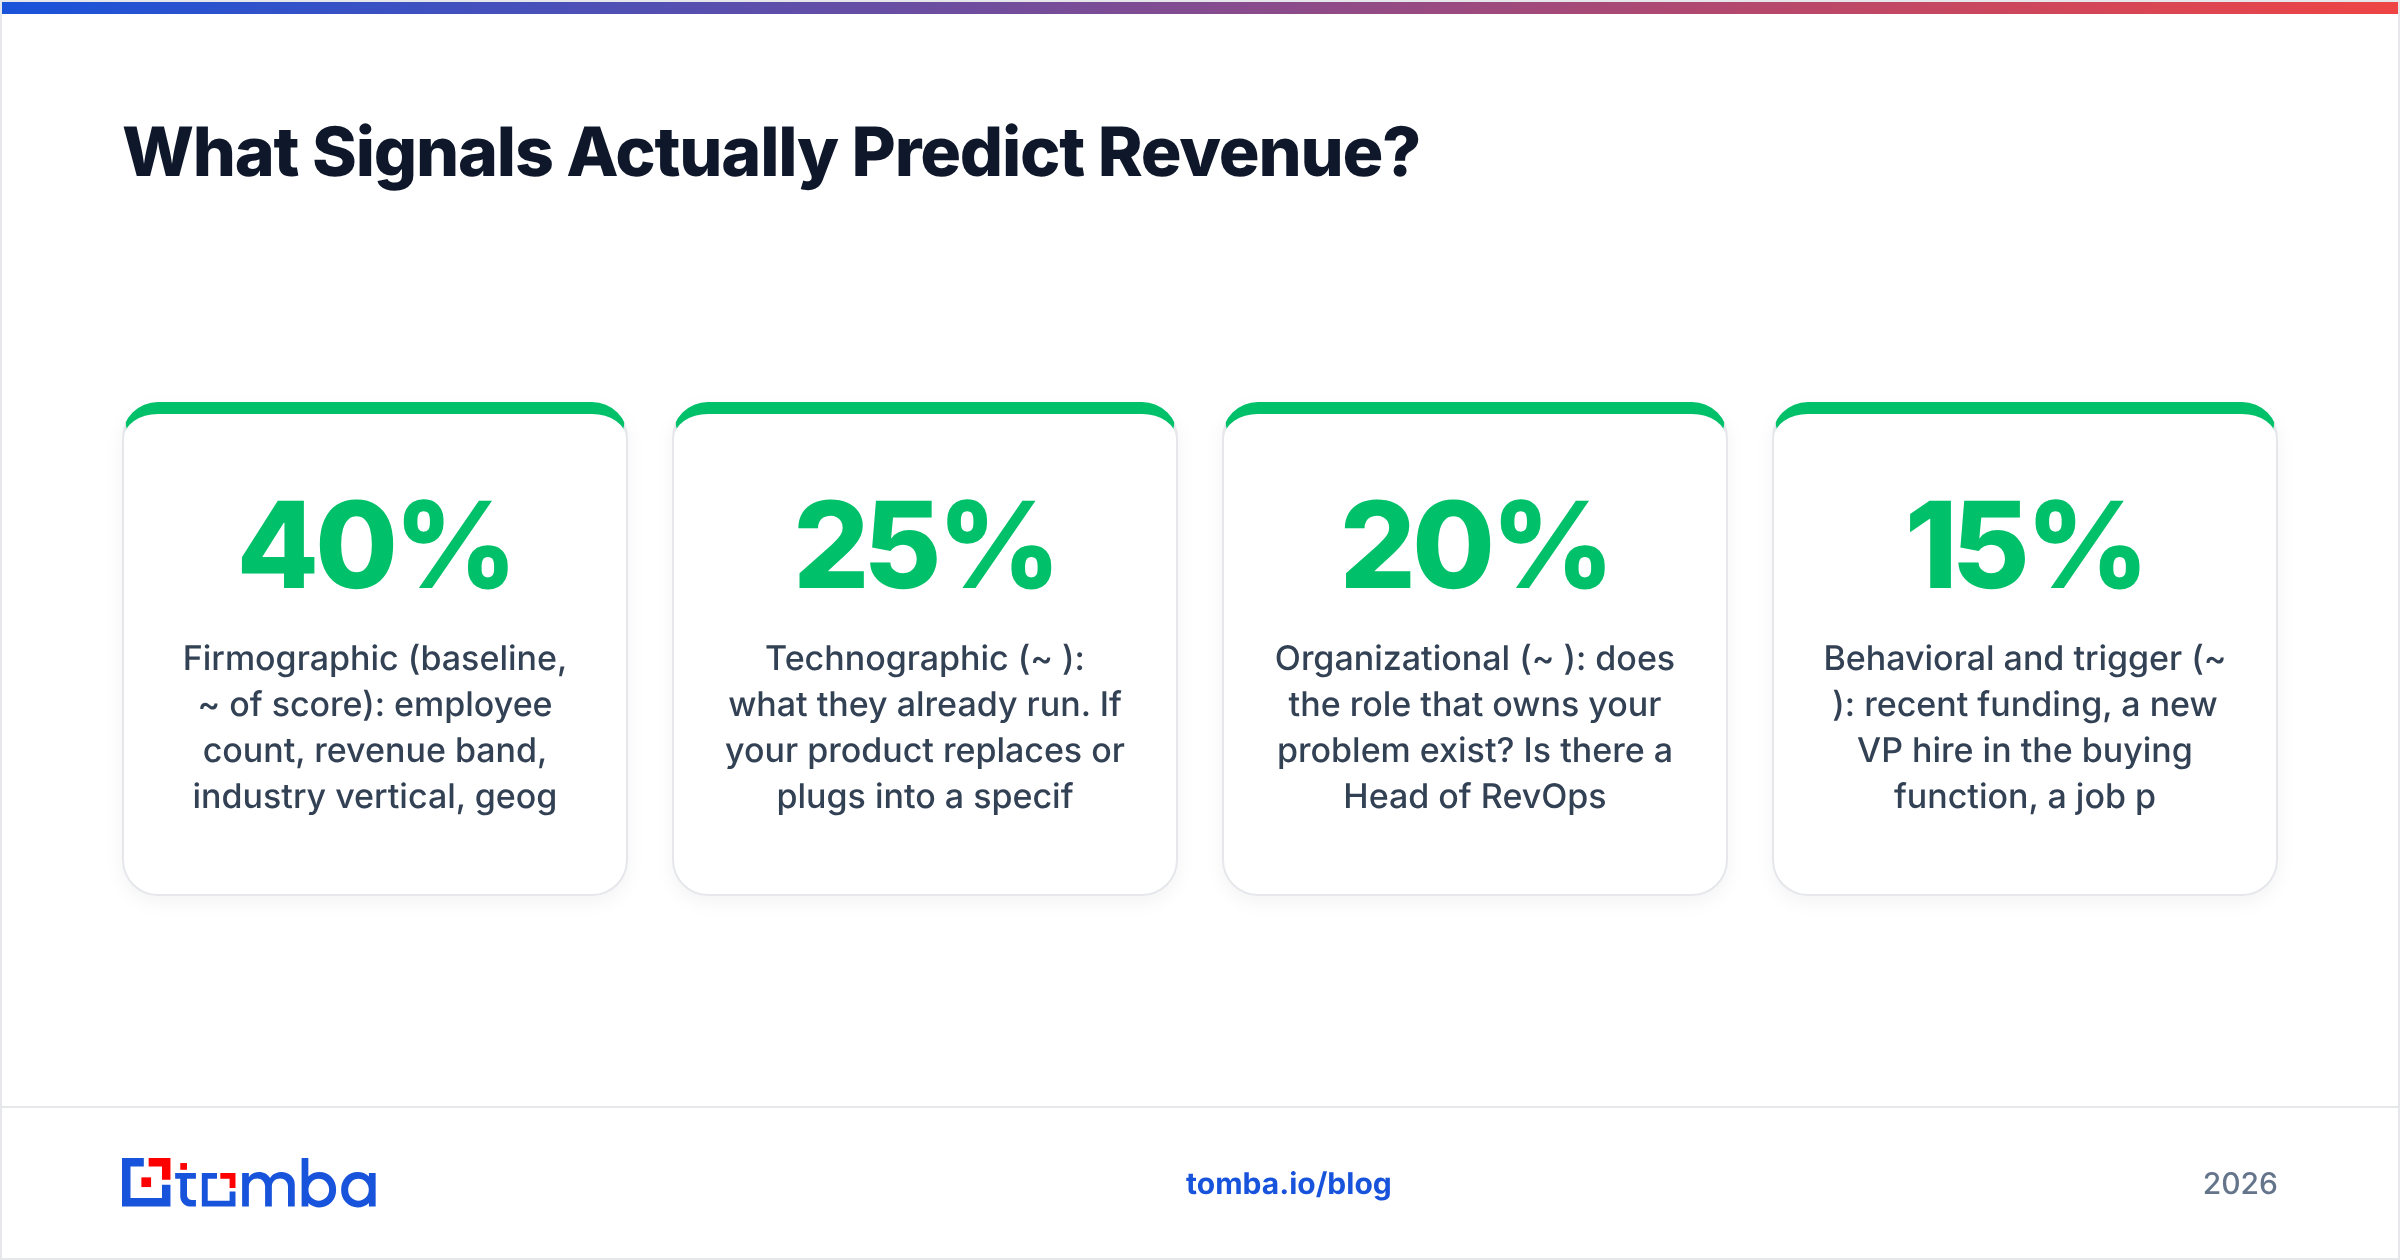
Not all attributes are equal. In practice, signals sort into three layers, and the weight you give each one should reflect how directly it maps to the pain you solve.
- Firmographic (baseline, ~40% of score): employee count, revenue band, industry vertical, geography, entity structure. Cheap to collect, weakly predictive on its own. Good for excluding, mediocre for ranking.
- Technographic (~25%): what they already run. If your product replaces or plugs into a specific tool, presence of that tool is the strongest single fit signal you have. A company running a modern data warehouse and a sales engagement platform is a different buyer from one running spreadsheets, even at identical headcount.
- Organizational (~20%): does the role that owns your problem exist? Is there a Head of RevOps, a Demand Gen lead, a Sales Enablement manager? A budget without an owner is not a budget.
- Behavioral and trigger (~15%): recent funding, a new VP hire in the buying function, a job posting for the role that owns your category, a G2 category visit, expansion into a new region. Triggers don't make a bad-fit account good — they make a good-fit account now.
The mistake is inverting the weights. Intent data vendors will happily sell you a list of companies "surging" on your category. If those companies fail your firmographic and organizational tests, the surge is noise. Fit gates timing; timing doesn't rescue fit.
How Should You Tier and Route Accounts?#
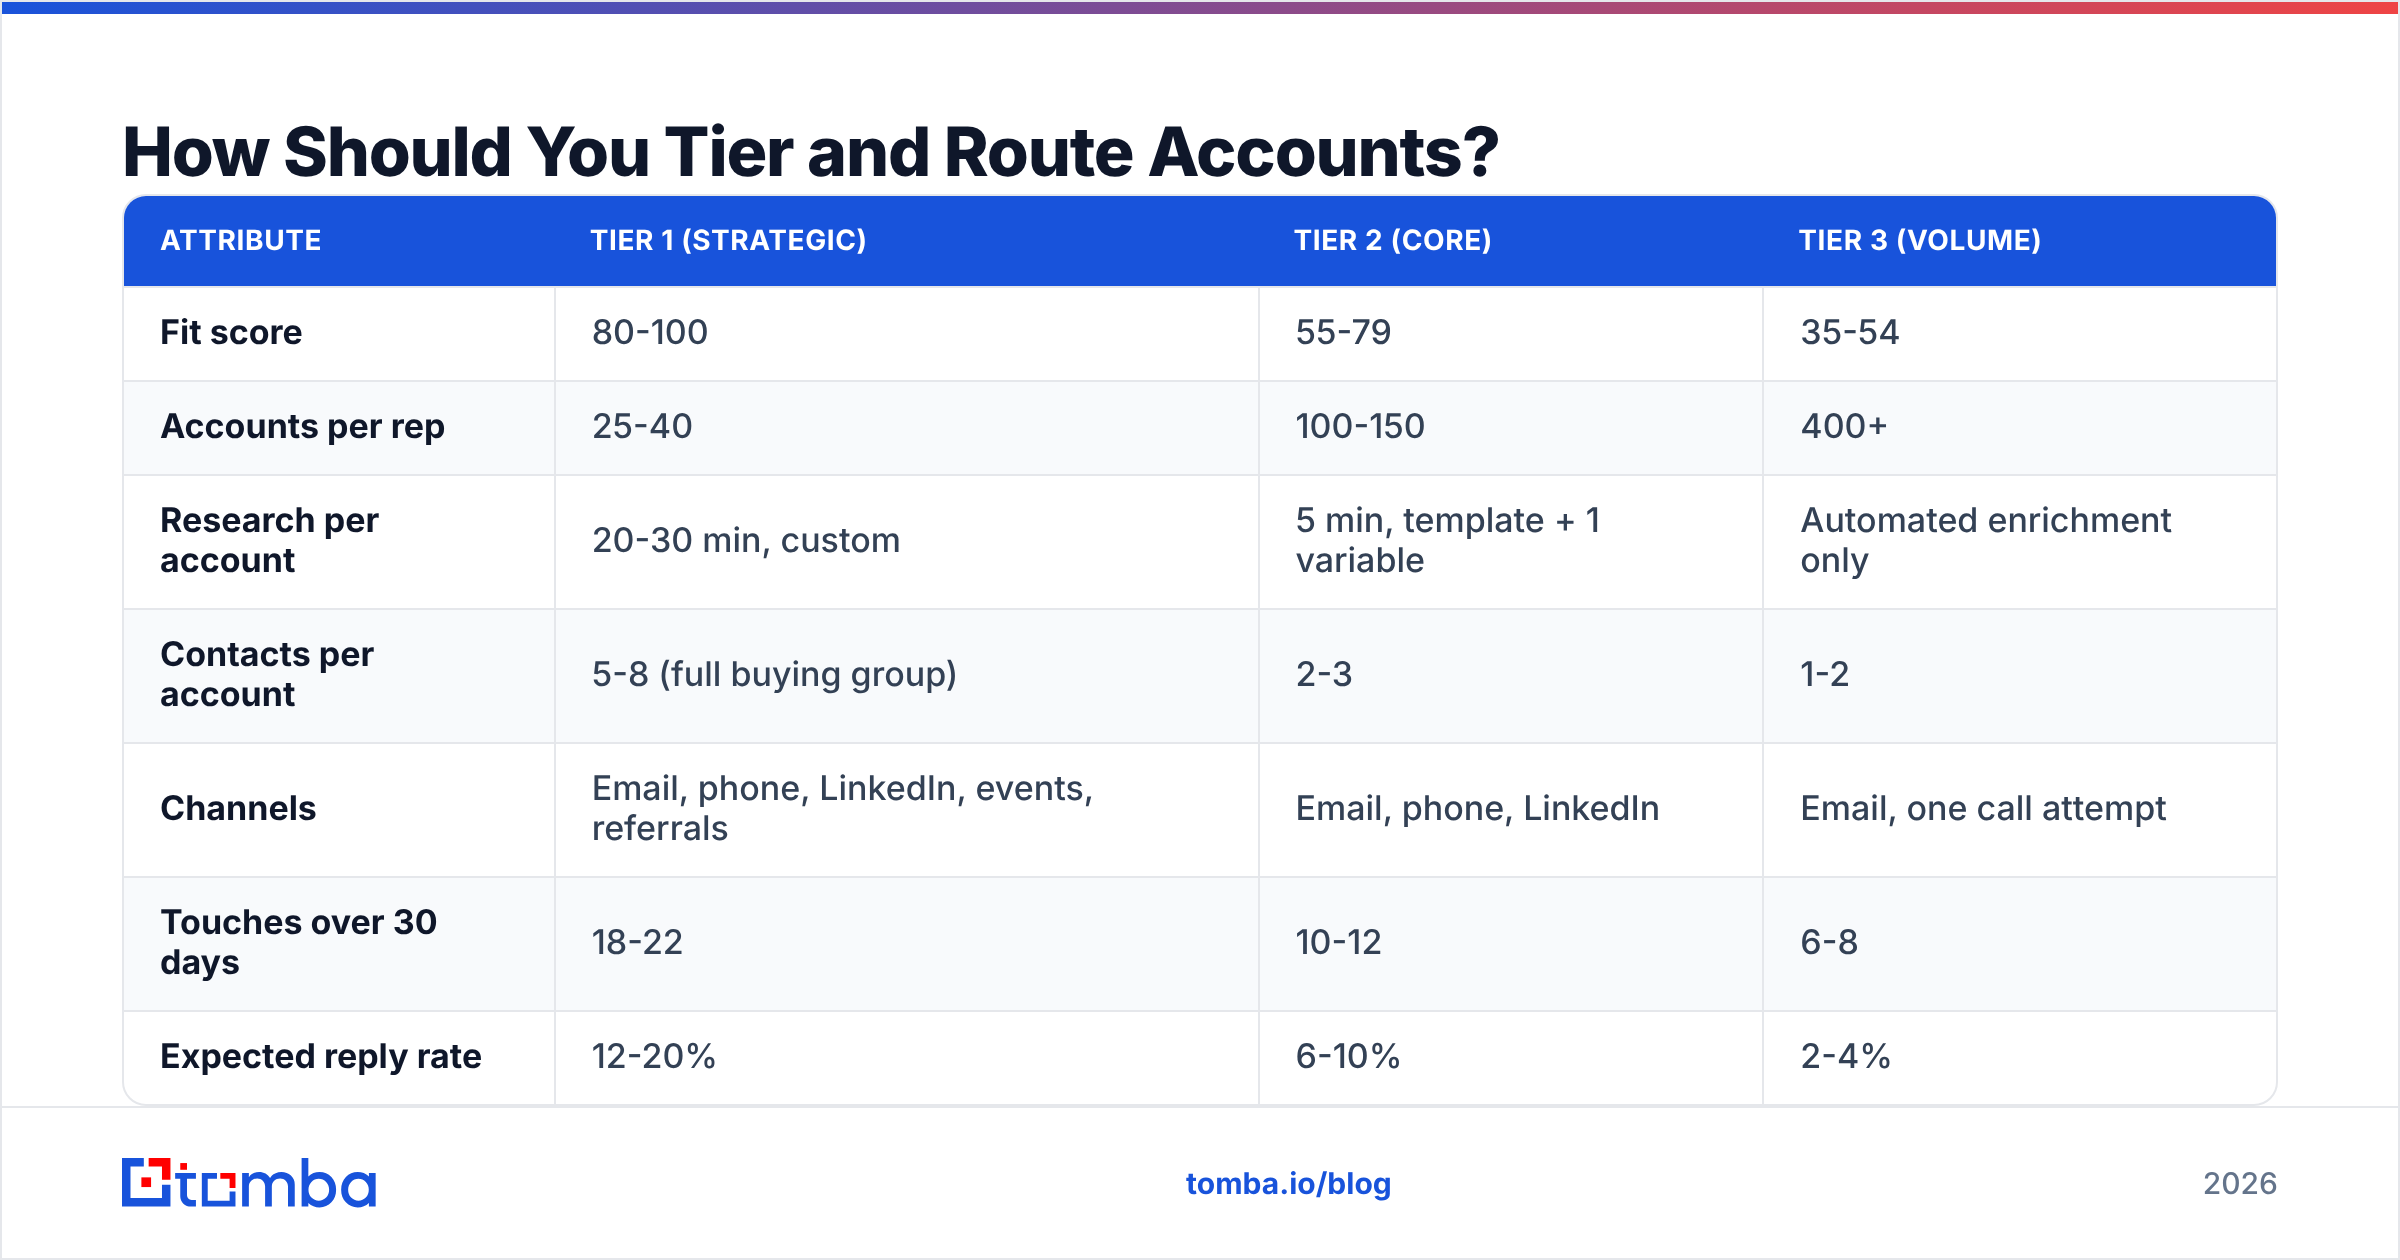
Once every account carries a fit score, you stop treating your list as flat. Three tiers is enough — more than that and nobody remembers the rules.
| Attribute | Tier 1 (Strategic) | Tier 2 (Core) | Tier 3 (Volume) |
|---|---|---|---|
| Fit score | 80-100 | 55-79 | 35-54 |
| Accounts per rep | 25-40 | 100-150 | 400+ |
| Research per account | 20-30 min, custom | 5 min, template + 1 variable | Automated enrichment only |
| Contacts per account | 5-8 (full buying group) | 2-3 | 1-2 |
| Channels | Email, phone, LinkedIn, events, referrals | Email, phone, LinkedIn | Email, one call attempt |
| Touches over 30 days | 18-22 | 10-12 | 6-8 |
| Expected reply rate | 12-20% | 6-10% | 2-4% |
| Owner | AE + SDR pair | SDR, AE on reply | Automated / shared queue |
Two rules make tiering work. First, tiers must be recalculated, not assigned once — a Series A company that raises a Series B and hires a VP of Sales should move from Tier 3 to Tier 1 automatically. Second, tier must gate effort before the rep starts researching, not after. The whole point is to stop your best AE from spending 25 minutes personalizing an email to a 42-score account.

How Do You Turn the ICP Into a Buildable Target List?#
This is where most ICP work dies. The definition is sound, and then nobody can produce the accounts.
The mechanics, in order:
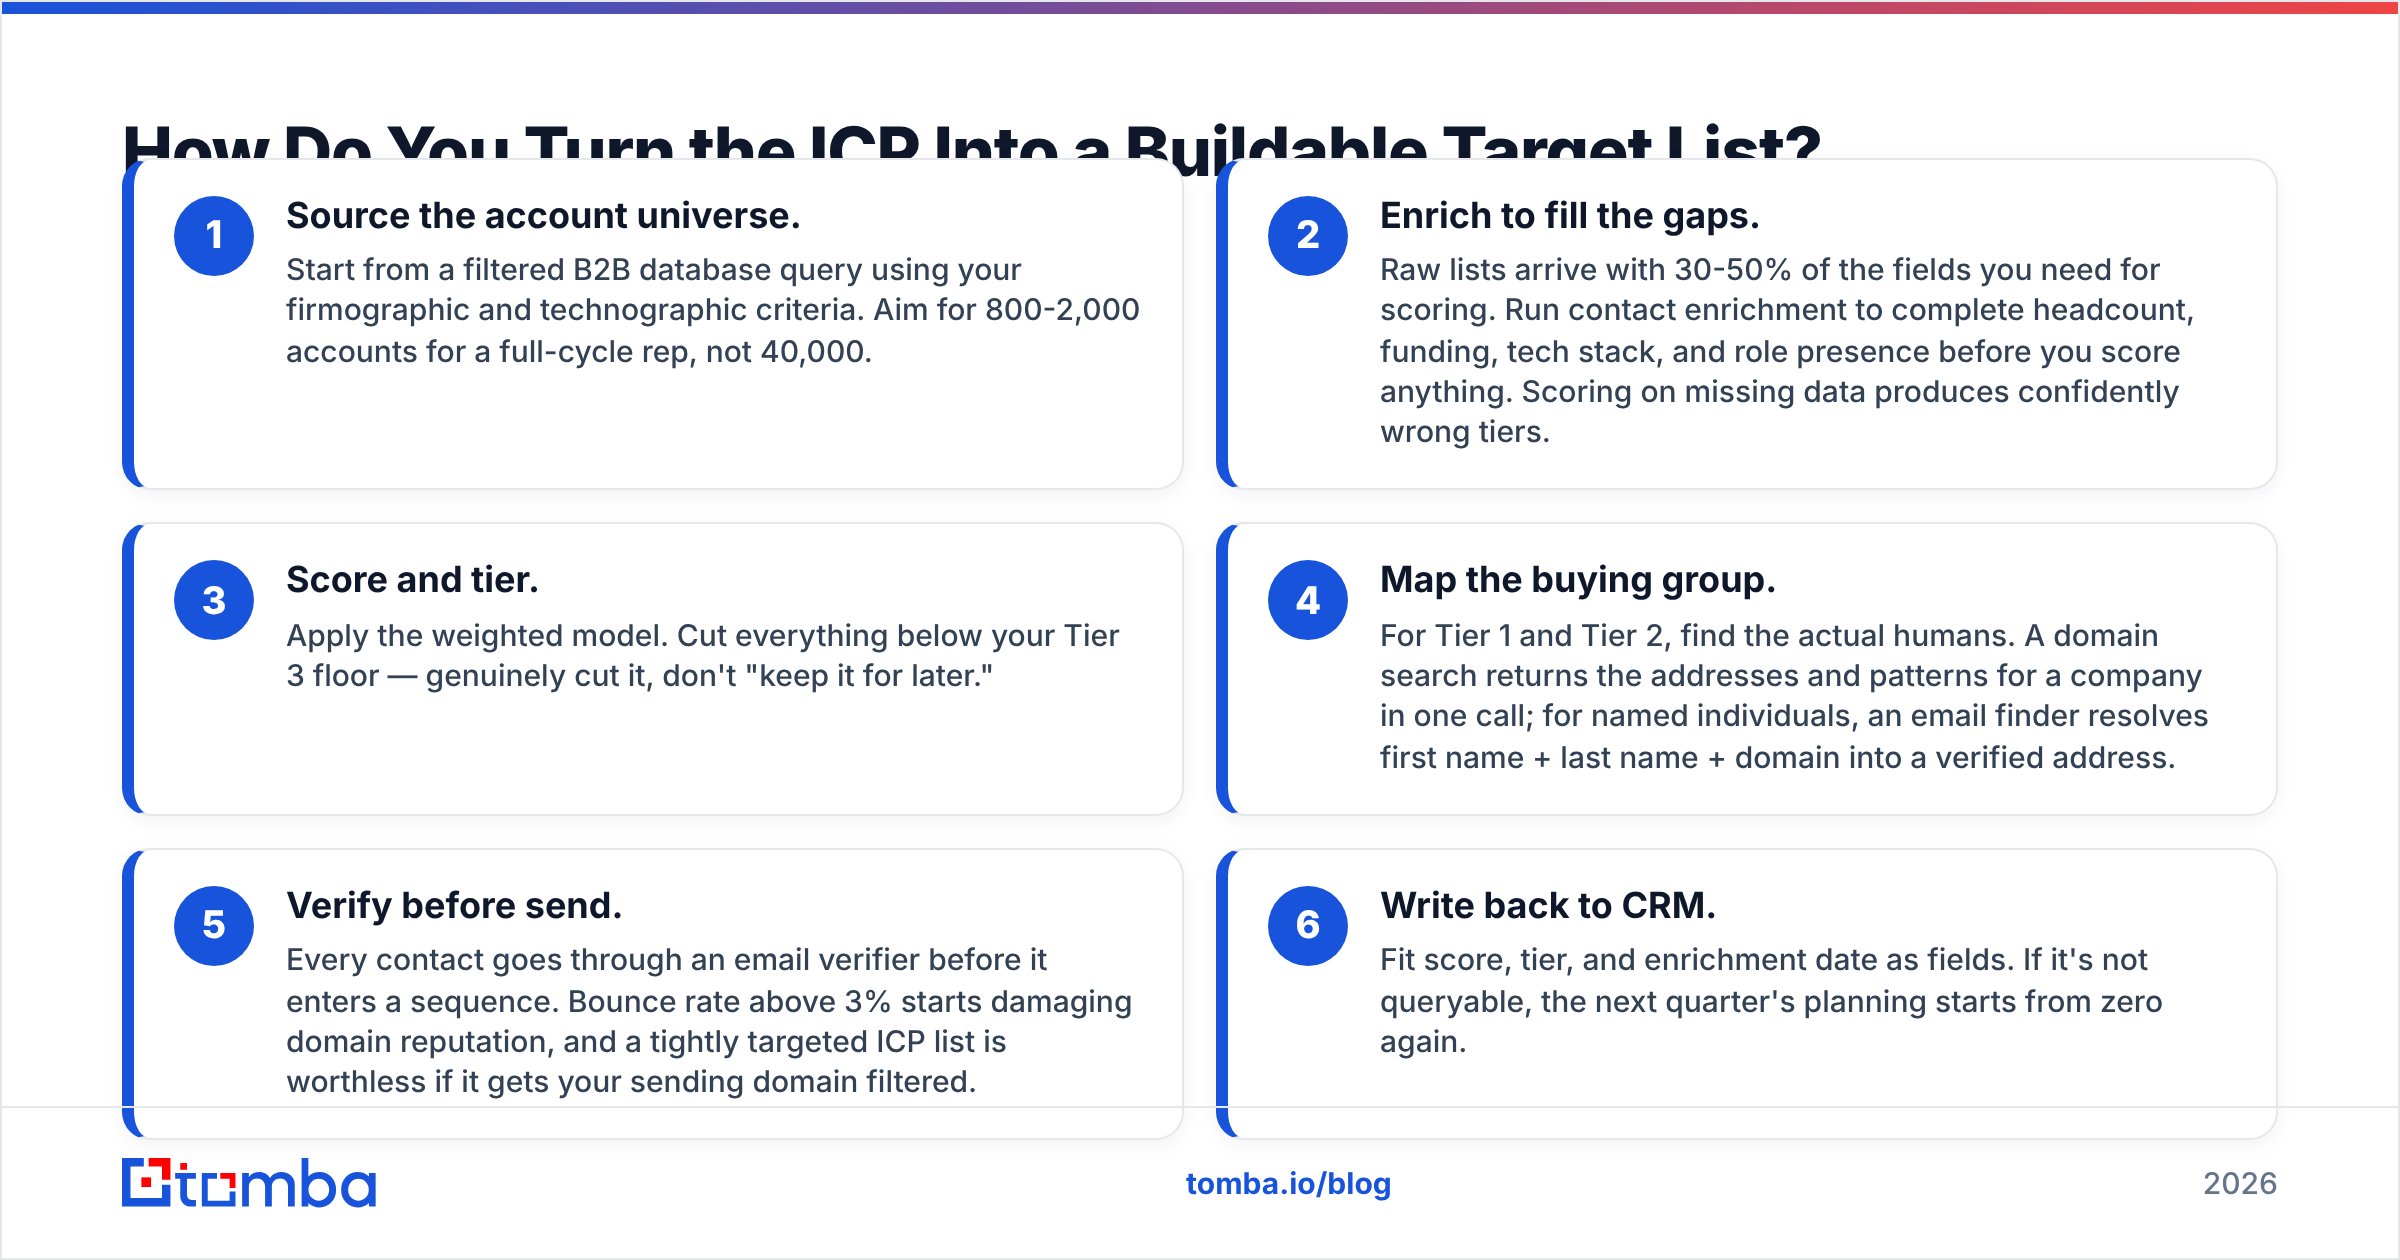
- Source the account universe. Start from a filtered B2B database query using your firmographic and technographic criteria. Aim for 800-2,000 accounts for a full-cycle rep, not 40,000.
- Enrich to fill the gaps. Raw lists arrive with 30-50% of the fields you need for scoring. Run contact enrichment to complete headcount, funding, tech stack, and role presence before you score anything. Scoring on missing data produces confidently wrong tiers.
- Score and tier. Apply the weighted model. Cut everything below your Tier 3 floor — genuinely cut it, don't "keep it for later."
- Map the buying group. For Tier 1 and Tier 2, find the actual humans. A domain search returns the addresses and patterns for a company in one call; for named individuals, an email finder resolves first name + last name + domain into a verified address.
- Verify before send. Every contact goes through an email verifier before it enters a sequence. Bounce rate above 3% starts damaging domain reputation, and a tightly targeted ICP list is worthless if it gets your sending domain filtered.
- Write back to CRM. Fit score, tier, and enrichment date as fields. If it's not queryable, the next quarter's planning starts from zero again.
Steps 4 and 5 are where the ICP either becomes real or stays theoretical. A perfect account list with no reachable contacts is a research project. For high-volume tiers, a bulk email finder handles the resolution in batches instead of one lookup at a time.
What Does an ICP-Driven Sequence Actually Look Like?#
The tier determines the sequence, not the other way around. A Tier 1 sequence opens with something only true of that account — a specific job posting, a named integration in their stack, a quote from their VP on a podcast. A Tier 3 sequence opens with a segment-level observation that's true of all 400 accounts in the bucket and doesn't pretend otherwise.
The honest trade-off: Tier 3 messaging will always underperform Tier 1 on reply rate. That's fine. Tier 3 exists to catch the accounts that self-identify with minimal cost. Problems start when teams run Tier 3 economics against Tier 1 accounts — burning a strategic logo with a generic template because it happened to be in the same upload.
One practical rule from teams that do this well: the number of variables in your template should equal the tier. Tier 1 gets three custom variables. Tier 2 gets two. Tier 3 gets one. It's arbitrary, and it works, because it forces the effort budget to be visible in the artifact.
How Do You Know If the ICP Is Working?#
Reply rate is a vanity metric for ICP evaluation. It measures your copy more than your targeting. Track these instead, segmented by tier, over a full sales cycle:
- Win rate by tier. Tier 1 should win at 2-3x Tier 3. If it doesn't, your scoring model isn't separating anything and you should rebuild it from the cohort analysis.
- Cycle length by fit score. High-fit accounts should close measurably faster. A high-fit account with a long cycle usually means you scored on company attributes but missed an organizational blocker.
- ACV by tier. If Tier 3 accounts produce equal ACV, your tiering is mis-weighted toward size rather than pain.
- 12-month net revenue retention by cohort. The real ICP test. An account that closes fast and churns at month 10 was never ICP; it was a good pitch.
- Percentage of pipeline from in-ICP accounts. Target 80%+. Below that, reps are working around the definition, which usually means the definition is wrong.
Review these quarterly. HubSpot's sales research library and peer-reviewed listings on G2's sales intelligence category are useful external reference points for benchmarking, but your own closed-won cohort is the only data that matters for your model.
When Should You Change Your ICP?#
Change it when the evidence forces you, not when the quarter is bad. Legitimate triggers:
- A new product or module opens a segment you previously excluded.
- Your NRR data shows a subsegment consistently outperforming the rest of Tier 1 — narrow toward it.
- Win rate in a defined segment drops for two consecutive quarters against stable messaging, which usually signals a new competitor owning that space.
- Pricing changes materially, moving your economic floor up or down.
Illegitimate triggers: one lost deal, a loud AE, a board member's portfolio company, or a quarter where you missed number and want more names in the funnel. Widening the ICP under pressure is the single most common way teams destroy an outbound motion that was working.
Re-scoring is different from redefining. Re-score monthly, automatically, as enrichment data refreshes. Redefine at most twice a year, with cohort data behind it.
What Are the Most Common ICP Mistakes?#
- Defining by industry alone. "Fintech" contains a 12-person startup and a 40,000-person bank. Industry is a filter, never a definition.
- No disqualification rules. Without them, every account is technically in ICP and the tiering collapses.
- Scoring on stale data. A profile built on 18-month-old headcount and funding fields will misroute a third of your list. Re-enrich on a schedule.
- Skipping verification. Great targeting plus a 12% bounce rate equals a burned domain and zero pipeline.
- Keeping the ICP out of the CRM. If it isn't a field, it isn't a strategy.
- Measuring on meetings booked. Meetings booked rewards volume. Win rate and retention reward fit.
Where Should You Start This Week?#
Pick your 20 healthiest customers and your 10 worst churns. Attribute both sets. Find the three attributes that separate them, write two exclusion rules, and score your existing pipeline against the model. You'll find accounts in late stage that shouldn't be there and dormant accounts that should be Tier 1. That single afternoon usually reprices a quarter's forecast more accurately than any pipeline review.
Then build the list — for real, with reachable contacts. Tomba's Email Finder resolves names and domains into verified professional addresses so your ICP definition becomes a working target list instead of a slide, with domain search, verification, and enrichment in the same workflow. The free tier covers 25 searches a month if you want to test the motion on a single Tier 1 segment first; paid Tomba plans start at $49/mo when you're ready to build the full list.
Related guides#
// get started
Find, verify and enrich your first contacts today
Start on the free plan with 25 searches a month, then scale when your team is ready.
Free plan · No credit card required · GDPR & CCPA
Get the Tomba newsletter
Product and data updates
// about the author