Ideal Account Profile: How to Build an IAP That Works in 2026
Most IAPs are a slide deck nobody uses. Here's how to build an ideal account profile from closed-won data, score it, and wire it into your prospecting stack so reps actually work the right accounts.
TL;DR
- An ideal account profile (IAP) describes the company worth selling to — firmographics, technographics, and trigger events — while an ICP is often used loosely for the same thing and a buyer persona describes the human inside it.
- Build it from closed-won and closed-lost data, not from a whiteboard session. Twenty accounts with 12 months of retention data beats a hundred opinions.
- Score accounts on 4-6 weighted attributes maximum. Every attribute you add past six dilutes the signal and slows list-building.
- An IAP is worthless until it's operational: a saved filter in your CRM, a list-build spec for SDRs, and a suppression rule for everything below the bar.
- Refresh quarterly. Segments drift, your product changes, and last year's best-fit account is this year's churn risk.
What is an ideal account profile?#
An ideal account profile is a written, data-backed definition of the companies most likely to buy your product, get value from it, and stay. It's a filter, not a wish list.
Think of it like a fishing chart. You can cast anywhere in the ocean, or you can mark the three reefs where the fish actually school at that depth and temperature. The IAP is the chart. Your sequences and calls are the cast.
A usable IAP has three layers:
- Firmographics — employee count, revenue band, industry (NAICS/SIC), geography, funding stage, growth rate. The cheapest data to get and the coarsest signal.
- Technographics — what's in their stack. If you integrate with Salesforce and sell to RevOps, "runs Salesforce" is a harder qualifier than "500-2,000 employees."
- Behavioral and trigger signals — hiring for a role your product supports, new exec in a relevant function, recent funding round, a security incident, migration announcements. These decide timing, which is usually more valuable than fit.
- Negative criteria — the disqualifiers. Heavily regulated verticals you can't service, regions you have no data coverage for, sub-$5M revenue accounts that churn at 60%. Writing these down saves more money than the positive criteria do.
Skip layer four and you get an IAP that describes half the market. Most teams do exactly that.

Is an ideal account profile different from an ICP?#
In practice, most teams use "ICP" and "IAP" interchangeably, and that's fine internally. But the distinction matters when you're building lists, because they operate at different levels of the funnel.
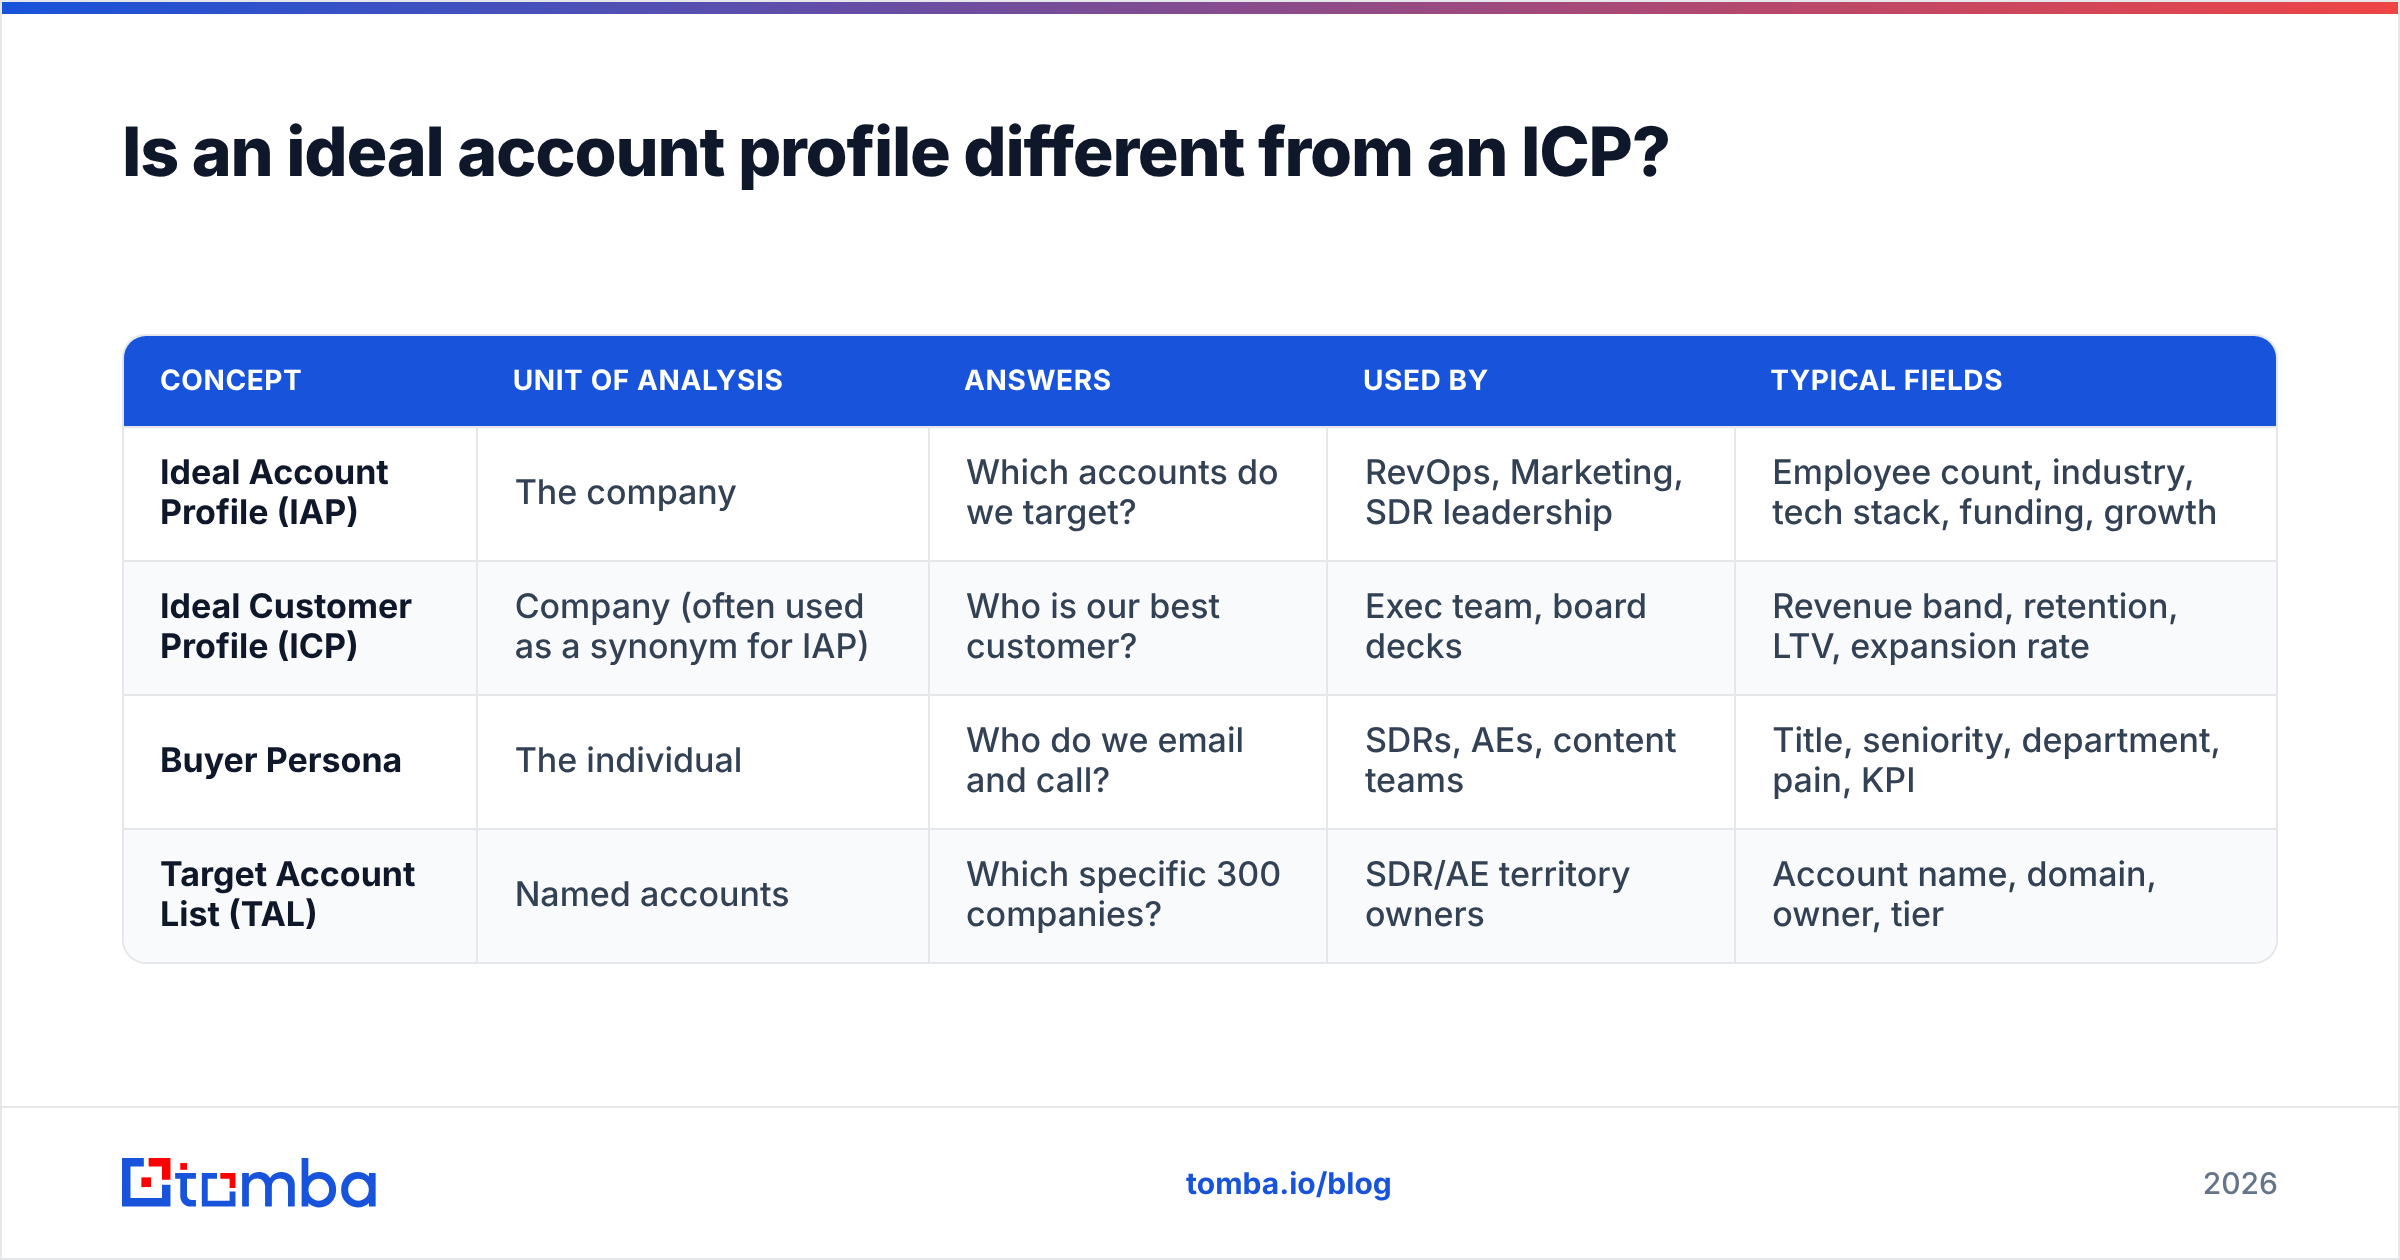
| Concept | Unit of analysis | Answers | Used by | Typical fields |
|---|---|---|---|---|
| Ideal Account Profile (IAP) | The company | Which accounts do we target? | RevOps, Marketing, SDR leadership | Employee count, industry, tech stack, funding, growth |
| Ideal Customer Profile (ICP) | Company (often used as a synonym for IAP) | Who is our best customer? | Exec team, board decks | Revenue band, retention, LTV, expansion rate |
| Buyer Persona | The individual | Who do we email and call? | SDRs, AEs, content teams | Title, seniority, department, pain, KPI |
| Target Account List (TAL) | Named accounts | Which specific 300 companies? | SDR/AE territory owners | Account name, domain, owner, tier |
The workflow runs top to bottom: IAP defines the shape, the TAL names the accounts, personas name the humans, and only then does your email finder get involved. Reversing that order — scraping contacts first and reverse-engineering fit later — is how teams end up with 40,000 verified emails and a 0.4% reply rate.
How do you build an ideal account profile from real data?#
Start with what already closed. Here's the sequence that works.
Step 1 — Pull your closed-won cohort. Export every account that closed in the last 18-24 months. Include ARR, sales cycle length, discount given, retention status at 12 months, and expansion revenue. If you have fewer than 20 closed-won accounts, use closed-won plus your most engaged trial or pilot accounts and mark the analysis as provisional.
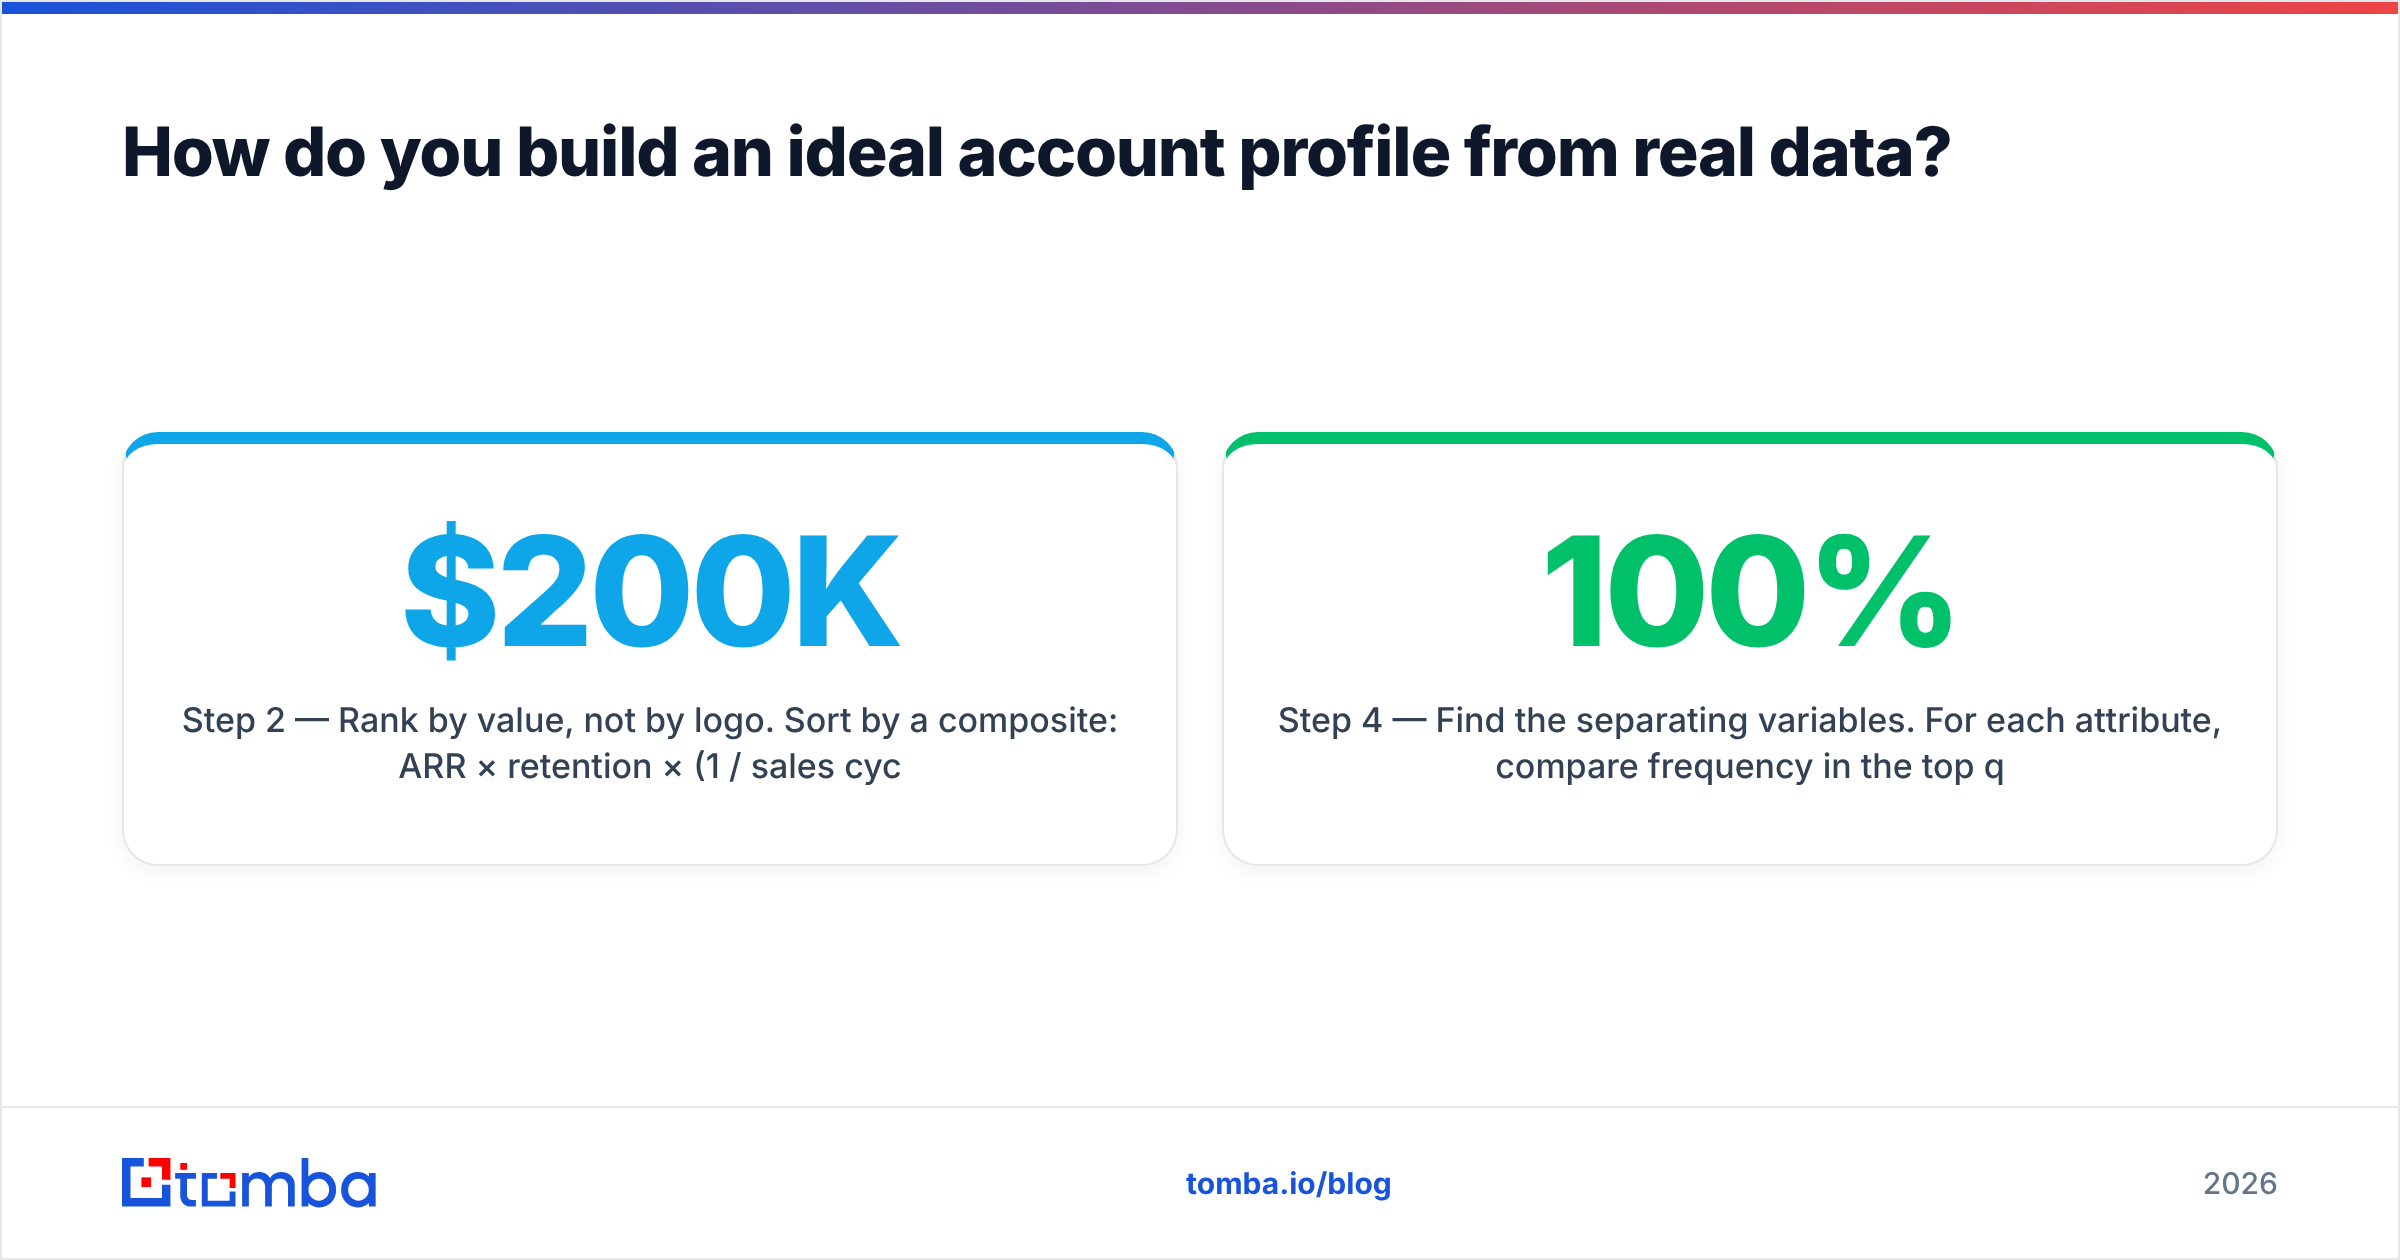
Step 2 — Rank by value, not by logo. Sort by a composite: ARR × retention × (1 / sales cycle days). A $200K account that took 14 months and churned in month 13 is not an ideal account. A $40K account that closed in 30 days and expanded twice is.
Step 3 — Enrich the top and bottom quartiles. Append firmographic and technographic fields to both groups. You want to know what separates them, and that means you need the losers enriched too. Run this through a data enrichment pass so every row has consistent employee counts, industry codes, and domains — inconsistent data is the single most common reason IAP analysis produces nothing usable.
Step 4 — Find the separating variables. For each attribute, compare frequency in the top quartile vs the bottom. You're looking for lift, not prevalence. "Uses email" is present in 100% of both groups and tells you nothing. "Has a dedicated RevOps hire" appearing in 70% of top-quartile and 15% of bottom-quartile accounts is a real signal.
Step 5 — Write it as a filter, not a paragraph. The output should be something you can paste into a CRM query:
employees BETWEEN 50 AND 500 AND industry IN (SaaS, Fintech, MarTech) AND tech_stack CONTAINS (HubSpot OR Salesforce) AND funding_stage IN (Series A, Series B) AND country IN (US, UK, CA, DE) AND NOT industry IN (Gambling, Crypto)
If your IAP can't be expressed that way, it isn't done.
Step 6 — Validate against a holdout. Take 50 accounts your team worked last quarter that you didn't use in the analysis. Score them with the new IAP. If the high scorers didn't convert better than the low scorers, your attributes are wrong — go back to step four.
What attributes actually predict revenue?#
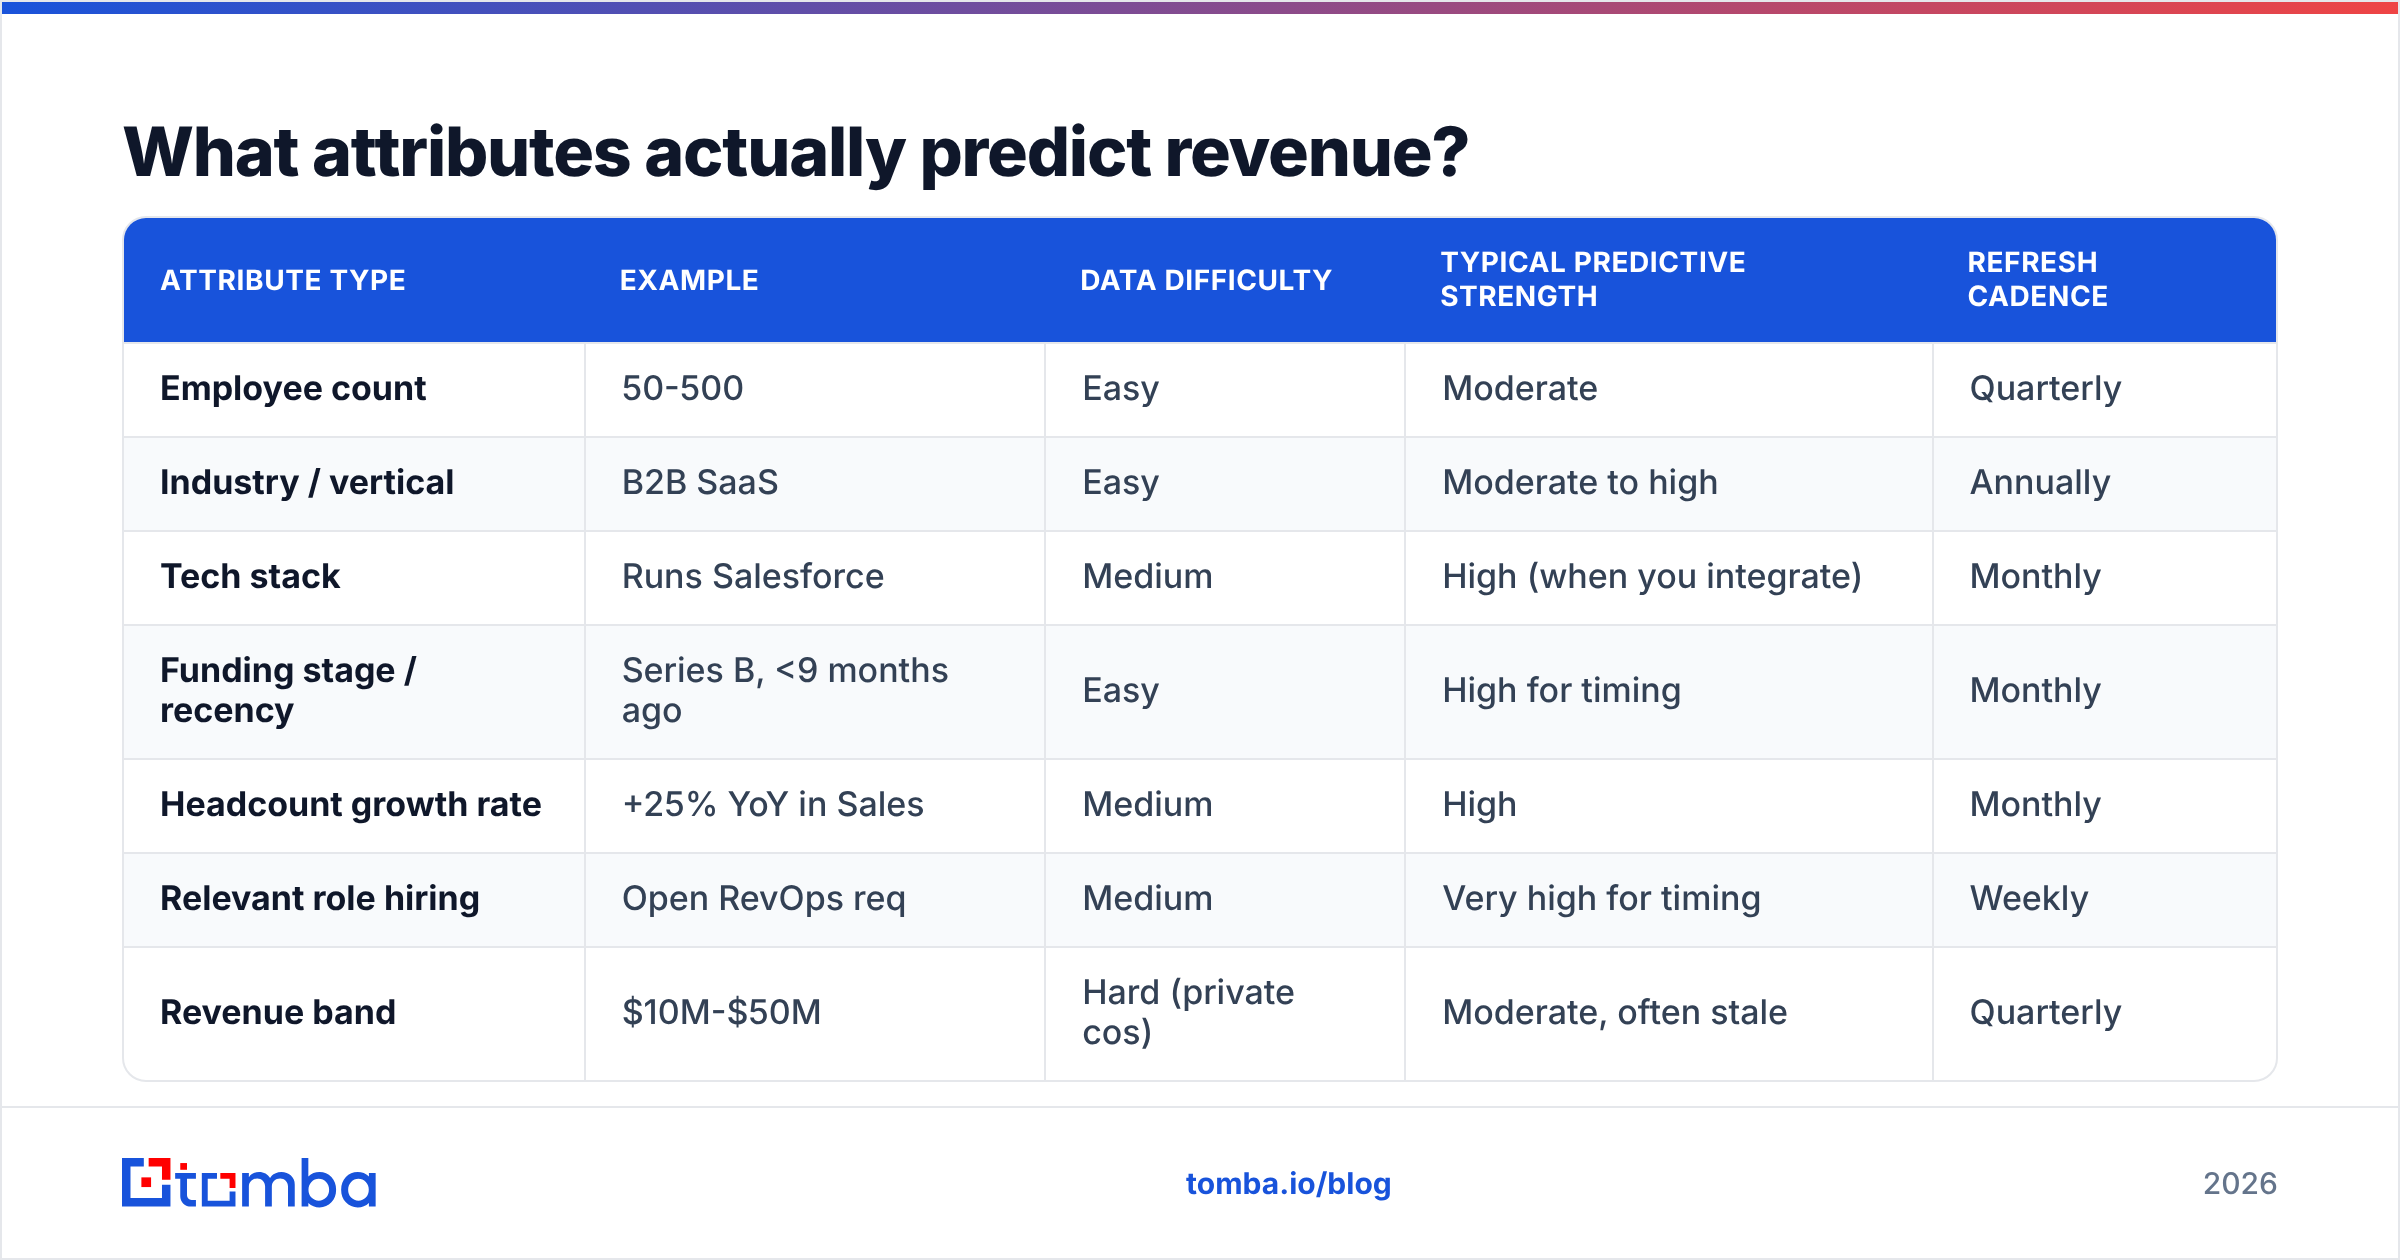
Not all fields are worth the credits. Based on how B2B teams typically weight their models, here's a working starting point you should recalibrate against your own data:
| Attribute type | Example | Data difficulty | Typical predictive strength | Refresh cadence |
|---|---|---|---|---|
| Employee count | 50-500 | Easy | Moderate | Quarterly |
| Industry / vertical | B2B SaaS | Easy | Moderate to high | Annually |
| Tech stack | Runs Salesforce | Medium | High (when you integrate) | Monthly |
| Funding stage / recency | Series B, <9 months ago | Easy | High for timing | Monthly |
| Headcount growth rate | +25% YoY in Sales | Medium | High | Monthly |
| Relevant role hiring | Open RevOps req | Medium | Very high for timing | Weekly |
| Revenue band | $10M-$50M | Hard (private cos) | Moderate, often stale | Quarterly |
| Geography | US, UK, DACH | Easy | High (as a disqualifier) | Annually |
Two practical notes. First, revenue data on private companies is largely modeled, not reported — treat it as a band, never as a threshold. Second, trigger signals decay fast. A funding round is a strong signal for about 90 days and near-worthless at 12 months. Build your refresh cadence around the fastest-decaying field you rely on, not the slowest.
Independent research from Gartner has consistently pointed to buying-group complexity as the dominant factor in B2B deal difficulty — which is why account-level fit and persona-level targeting have to be designed together rather than sequentially.
How do you score accounts against the IAP?#
Keep it simple enough that an SDR can explain it. A weighted additive model with 4-6 attributes is almost always the right answer for teams under $50M ARR. Machine-learned propensity models are better once you have thousands of opportunities; below that, they overfit and nobody trusts the output.
A workable scoring frame:
- Weight each attribute 1-5 based on the lift you measured in step four. Tech stack match might be a 5; geography might be a 2.
- Score each account 0-1 per attribute (binary match) or 0-3 (graded, e.g. employee count in the sweet spot = 3, adjacent band = 1, outside = 0).
- Sum and bucket into three tiers. Tier 1 gets multithreaded outbound plus AE involvement. Tier 2 gets standard sequences. Tier 3 gets nurture or nothing.
- Apply hard disqualifiers as vetoes, not deductions. If you can't legally sell into gambling, no amount of firmographic fit should let a casino into Tier 2.
- Cap Tier 1 at what your team can actually work. If two SDRs can run 120 meaningful multithreaded accounts a quarter, a Tier 1 list of 900 accounts is a fiction.
That last point kills more IAP programs than bad data does. A tier your team can't service is just a longer list.

How do you turn the IAP into a working target account list?#
This is where most IAP documents die — in a slide deck, admired and unused. The operational chain looks like this:
- Query your database against the filter. Pull the universe of accounts matching the IAP. A B2B database with domain-level firmographic filtering does this in one pass; otherwise you're stitching together exports.
- Deduplicate and suppress. Remove existing customers, open opportunities, and accounts another rep touched in the last 90 days. Ship this as an actual suppression file, not a verbal instruction.
- Map personas per tier. For Tier 1, that's usually 4-6 contacts across economic buyer, champion, and technical evaluator. For Tier 3, one contact is fine.
- Find contacts at scale. Use domain search to pull all discoverable addresses at a target company, then filter to the mapped titles rather than emailing whoever surfaces first.
- Verify before sending. Every appended email goes through an email verifier pass. Bounce rates above 3% put your sending domain at risk regardless of how well-targeted the list is.
- Write scores back to the CRM. The tier should be a field on the account object, refreshed on a schedule. If it lives in a spreadsheet, it's already stale.
Data providers differ sharply on which step they're strong at. Coverage-first platforms like Apollo and curated-list vendors like BookYourData — which sells pre-verified, filterable B2B lists and is a genuinely good fit when you want the account universe handed to you — solve step one well. Verification-first tools solve step five. Very few solve both cleanly, which is why most stacks end up with two or three vendors.
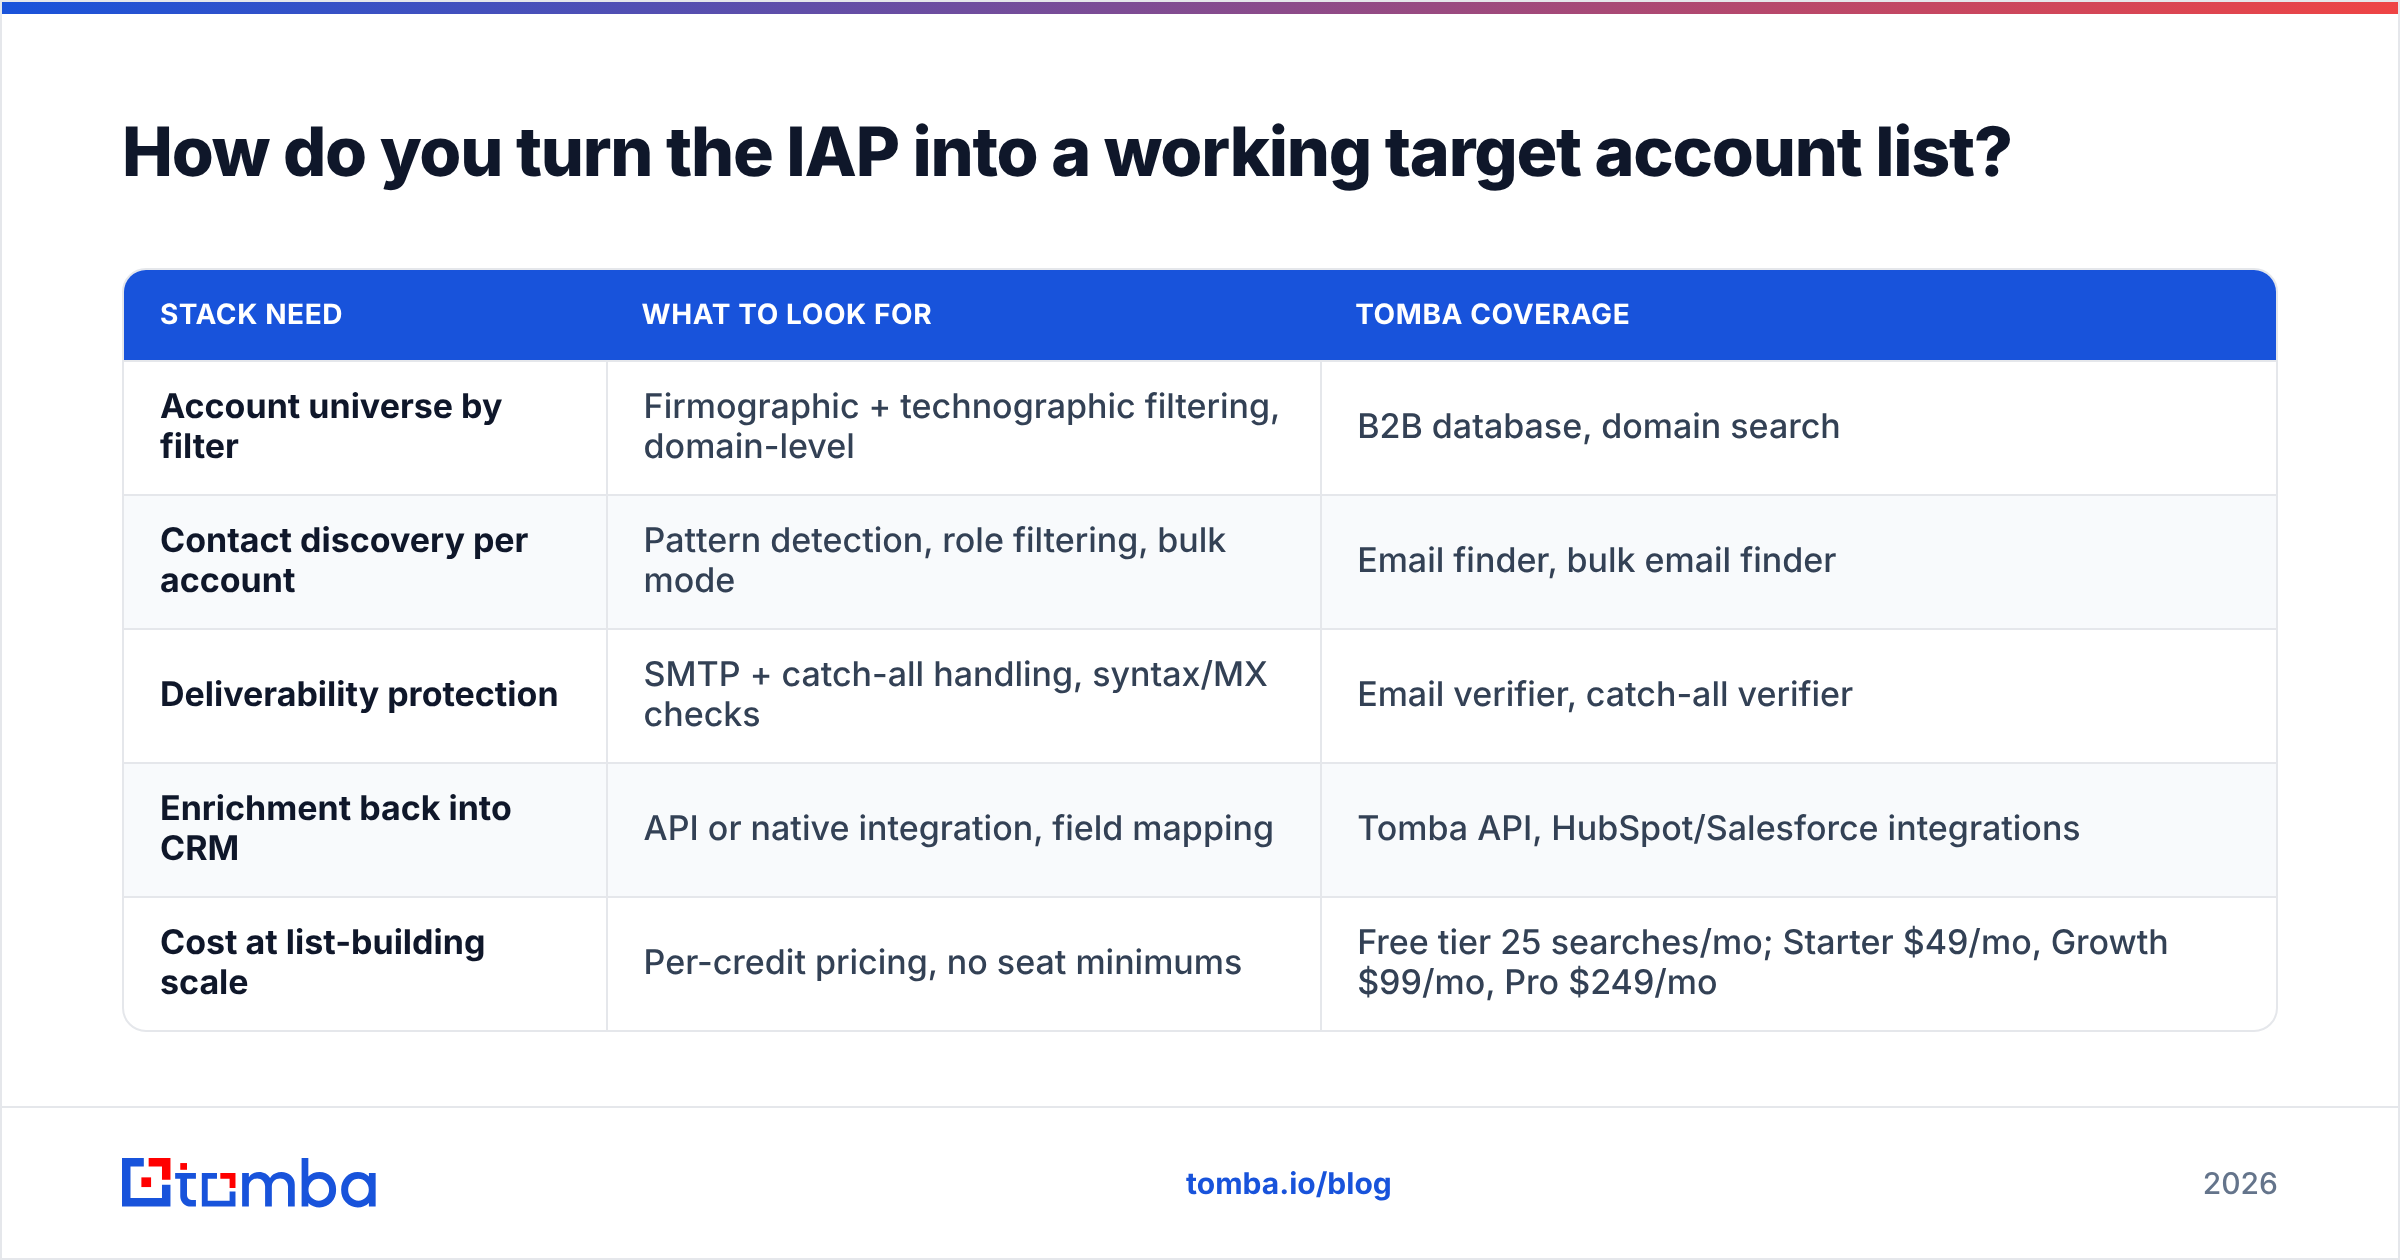
| Stack need | What to look for | Tomba coverage |
|---|---|---|
| Account universe by filter | Firmographic + technographic filtering, domain-level | B2B database, domain search |
| Contact discovery per account | Pattern detection, role filtering, bulk mode | Email finder, bulk email finder |
| Deliverability protection | SMTP + catch-all handling, syntax/MX checks | Email verifier, catch-all verifier |
| Enrichment back into CRM | API or native integration, field mapping | Tomba API, HubSpot/Salesforce integrations |
| Cost at list-building scale | Per-credit pricing, no seat minimums | Free tier 25 searches/mo; Starter $49/mo, Growth $99/mo, Pro $249/mo |
Full Tomba pricing is per-credit rather than per-seat, which matters when one RevOps person is building lists for a team of eight.
What are the most common IAP mistakes?#
Defining it from your biggest logo. One enterprise whale distorts the analysis. It closed because a former colleague ran the evaluation, not because enterprise retail is your market. Exclude outliers or weight by count, not by ARR alone.
Confusing fit with intent. An account can match your IAP perfectly and have zero reason to buy this quarter. Fit tells you who, triggers tell you when. Teams that only model fit get high-quality lists with terrible timing.
Making it too narrow. If your IAP returns 140 accounts globally, you don't have an IAP, you have a named-account strategy — which is fine, but requires an entirely different motion and headcount plan.
Making it too broad. "B2B companies, 10-10,000 employees, North America" is not a profile. If your filter returns more than roughly 30-40x your annual new-logo target, tighten it.
Never revisiting negative criteria. Churned accounts contain the best disqualifier data you'll ever get, and almost nobody analyzes them. Run a churn post-mortem every two quarters and add what you find to the veto list.
Letting the data rot. Employee counts, funding stages, and tech stacks change constantly. B2B contact data decays meaningfully every year through job changes alone, and account-level firmographics drift right alongside it. An IAP built on 2024 enrichment scoring 2026 accounts will quietly misroute your best opportunities.
How often should you refresh your ideal account profile?#
Quarterly for the scoring model, monthly for the underlying data, weekly for trigger signals.
The quarterly review should be short and mechanical: pull the last quarter's closed-won and closed-lost, re-run the top-vs-bottom quartile comparison, and check whether any attribute's lift has moved by more than about 15 points. If nothing moved, change nothing. Stability is a feature.
Watch for three things that force an off-cycle rebuild:
- A pricing or packaging change. New price points move the viable company-size band immediately.
- A new integration or major feature. This usually rewrites your technographic criteria overnight.
- A segment showing outsized churn. If a segment that scores Tier 1 is churning above your average, the model is actively hurting you until you fix it.
Resources from HubSpot's research library are a reasonable sanity check on segment-level benchmarks, but your own closed-won data will always beat industry averages for this specific decision.
Where should you start if you have no data yet?#
Borrow, then replace. Pick the three accounts you're proudest of, write down every attribute they share, and treat that as a hypothesis with an expiry date. Run 200 accounts against it, measure reply and meeting rates by attribute, and rebuild after the first quarter with real numbers.
Set up your instrumentation from day one so the rebuild is possible: capture employee count, industry, tech stack, and source on every account record at creation. The teams who can build a good IAP in quarter three are the ones who captured clean fields in quarter one.
Ready to build the list your IAP describes?#
An ideal account profile only earns its keep when it produces a contactable list. Once you've defined the filter, Tomba Email Finder turns your target accounts into verified, deliverable contacts — search by domain to map an entire org, filter to the personas your tier model calls for, and verify before a single send. Start on the free tier with 25 searches a month, or scale to Starter at $49/mo when your Tier 1 list outgrows manual work.
Build the profile from your own closed-won data. Then go find the accounts that match it.
Related guides#
// get started
Find, verify and enrich your first contacts today
Start on the free plan with 25 searches a month, then scale when your team is ready.
Free plan · No credit card required · GDPR & CCPA
// about the author