Ideal Customer Profile Template B2B: A 2026 Field Guide
Most B2B ideal customer profiles are a slide nobody uses. Here is a template built from closed-won data, the fields that actually predict revenue, and how to turn it into a prospecting list this week.
TL;DR — the ideal customer profile template B2B teams actually fill in, in seven fields:
- An ICP describes the company you sell to. A buyer persona describes the human inside it. Mixing the two is why most ICP docs go unused.
- The seven fields that matter: firmographics, technographics, trigger events, buying committee, disqualifiers, economic proof, and acquisition channel. The rest is decoration.
- Build it from your own closed-won and churn data first. Twenty real accounts beat any market report.
- Tier the output A/B/C instead of drawing one hard line. Tiering is what makes an ICP useful to SDRs.
- The ICP only pays off once it becomes a list. Domain filters plus verified contacts turn the doc into pipeline.
What is an ideal customer profile in B2B?#
An ideal customer profile is a short write-up of the account type that gets the most value from your product, fastest. Those accounts close quickest. They expand most. They churn least.
Think of it as a fishing chart, not a portrait of a fish. It does not tell you what a good customer looks like in the abstract. It tells you where to cast, in what weather, and which water to skip. In plain terms, it is a set of account-level traits — firmographic, technographic, behavioural — filtered by the revenue results in your own book of business.
A useful B2B ICP has six properties. If yours is missing more than two, it is a positioning slide, not an ICP:
- Account-level, not person-level. The unit is a company or a business unit. Never a job title.
- Built on outcomes, not opinions. Every line traces back to a closed-won deal, an expansion, or a churn event you can name.
- Visible from the outside. If you cannot check the trait before a conversation, it cannot filter a list. "Values innovation" fails that test. "Runs Shopify Plus" passes.
- Exclusionary. A good ICP tells reps who not to call. If it rules nothing out, it filters nothing.
- Tiered. Reality is a gradient. A/B/C tiers let you set different motions instead of arguing about edge cases.
- Versioned and dated. Markets move. An undated ICP is a fossil that still gets quoted in QBRs.
The idea behind it is plain market segmentation. An ICP is segmentation aimed at who you go after, not at what you say. The theory has not changed much. The resolution has. Account data that once needed a Gartner subscription is now one query per domain.
Ideal customer profile template B2B: the seven fields#
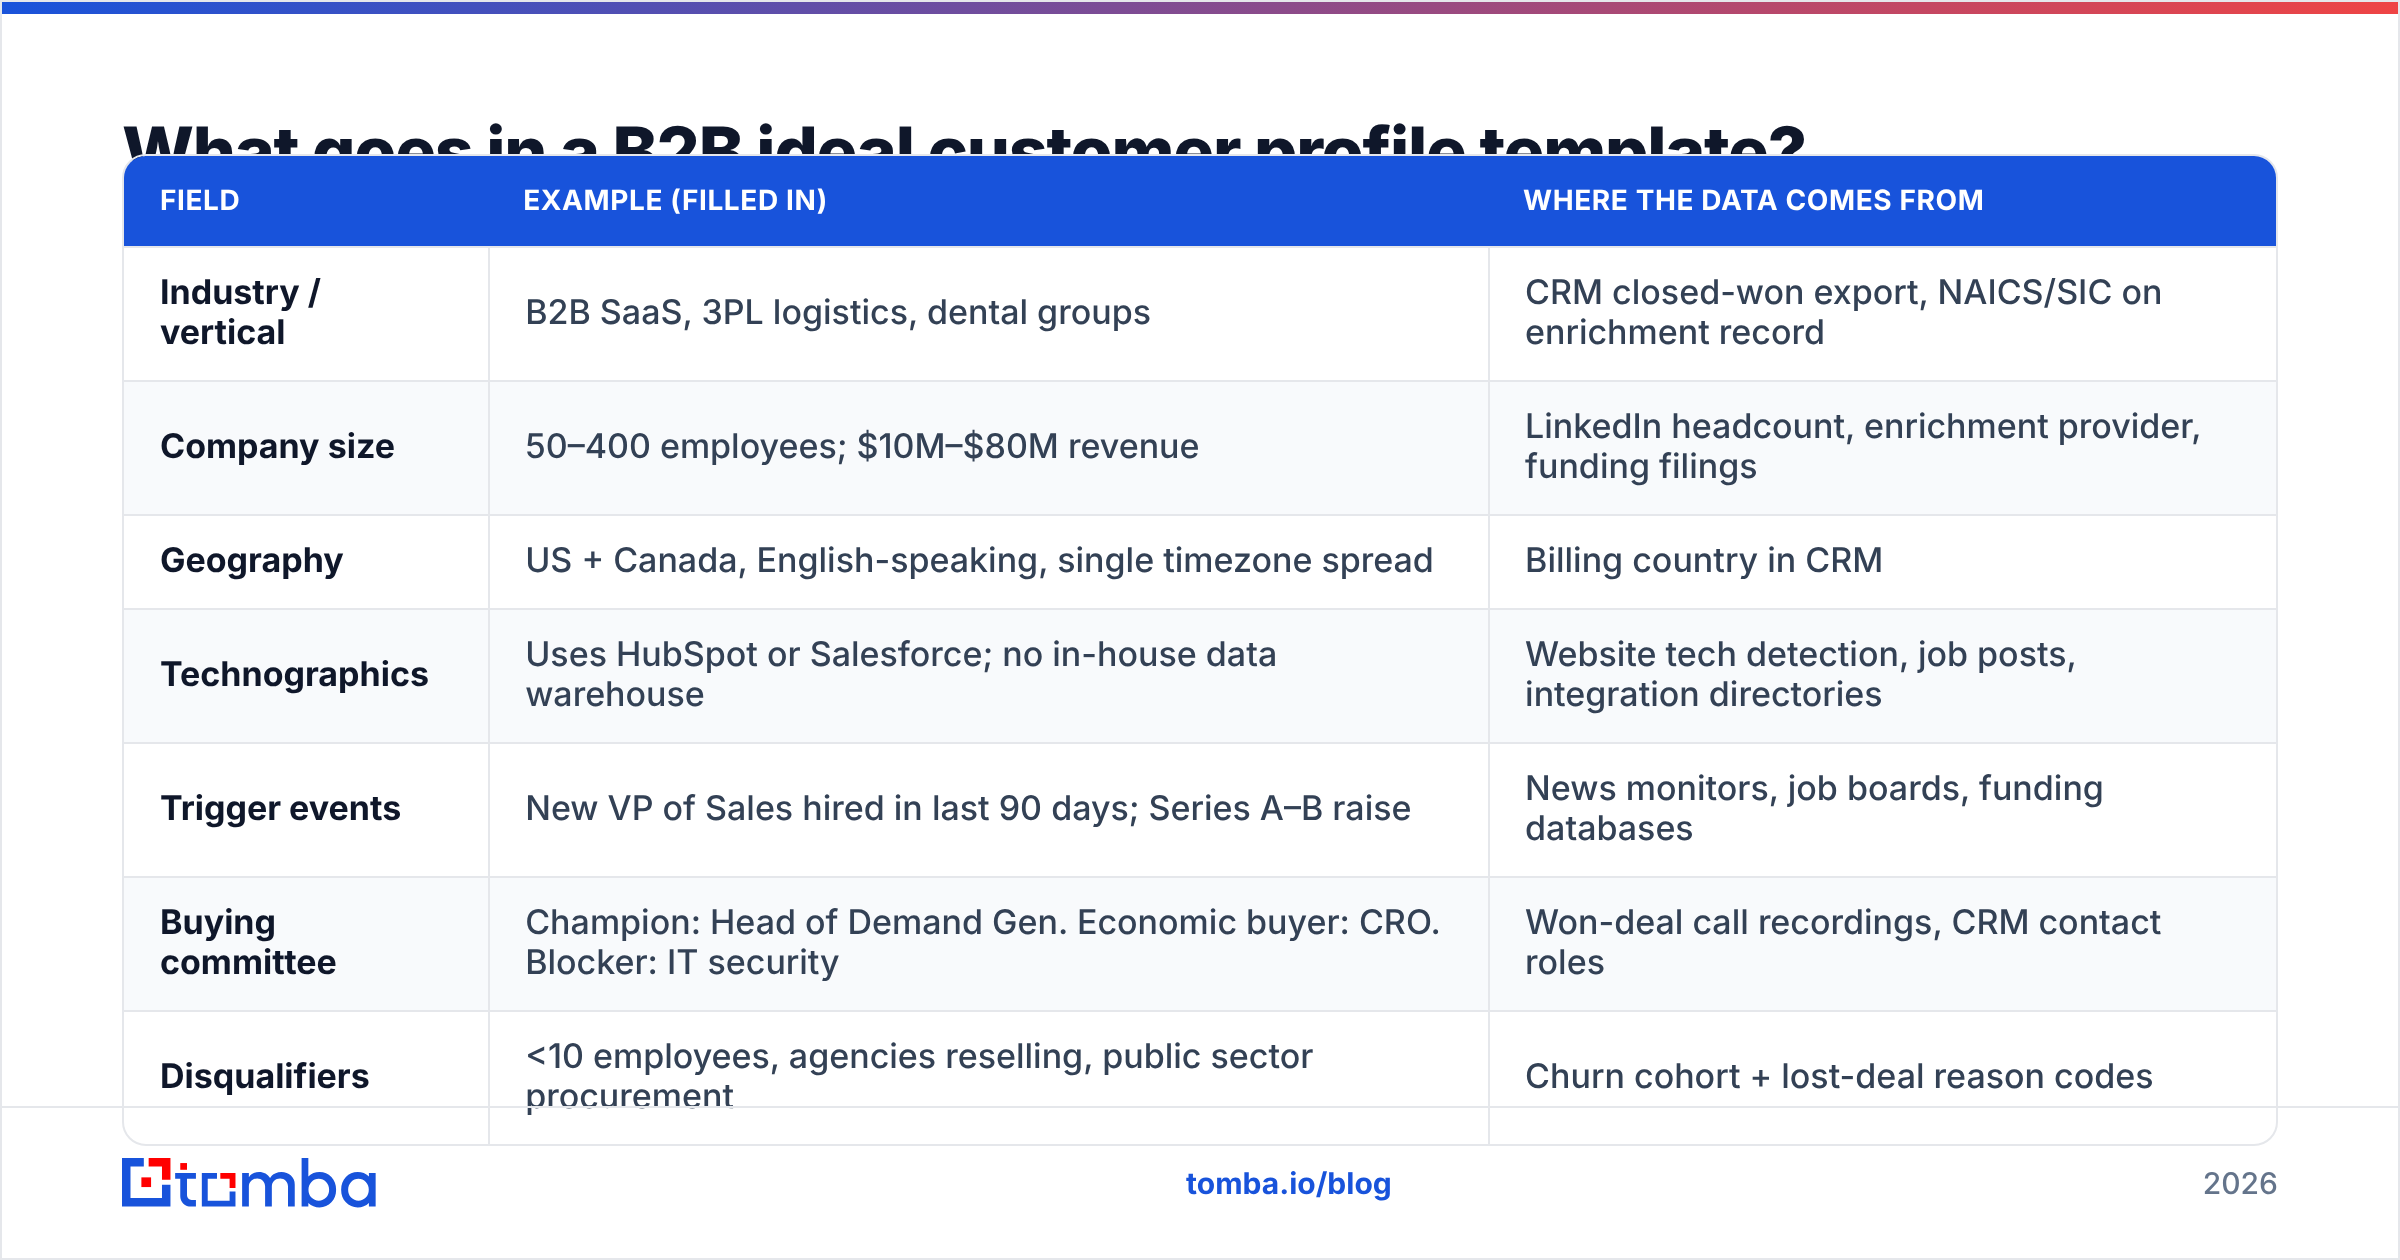
Here is the template. Fill the middle column with your own answers. The right column tells you where the data comes from. That last part is what most ICP posts skip.
| Field | Example (filled in) | Where the data comes from |
|---|---|---|
| Industry / vertical | B2B SaaS, 3PL logistics, dental groups | CRM closed-won export, NAICS/SIC on enrichment record |
| Company size | 50–400 employees; $10M–$80M revenue | LinkedIn headcount, enrichment provider, funding filings |
| Geography | US + Canada, English-speaking, single timezone spread | Billing country in CRM |
| Technographics | Uses HubSpot or Salesforce; no in-house data warehouse | Website tech detection, job posts, integration directories |
| Trigger events | New VP of Sales hired in last 90 days; Series A–B raise | News monitors, job boards, funding databases |
| Buying committee | Champion: Head of Demand Gen. Economic buyer: CRO. Blocker: IT security | Won-deal call recordings, CRM contact roles |
| Disqualifiers | <10 employees, agencies reselling, public sector procurement | Churn cohort + lost-deal reason codes |
| Economic proof | ACV $14k, 41-day cycle, 118% NRR, 6% logo churn | Finance/CRM reporting, not estimates |
| Acquisition channel | Outbound email + partner referral; paid search underperforms | Attribution report by segment |
Two notes on filling this in. First, write the disqualifiers before the positive criteria. They are easier to be honest about. Every team remembers the deals that ate a quarter. Second, the economic proof row turns the doc from a marketing artifact into a budget argument. Say tier-A accounts show $14k ACV and 41-day cycles, while everything else shows $6k and 96 days. Nobody needs convincing after that.

How is an ICP different from a buyer persona or TAM?#
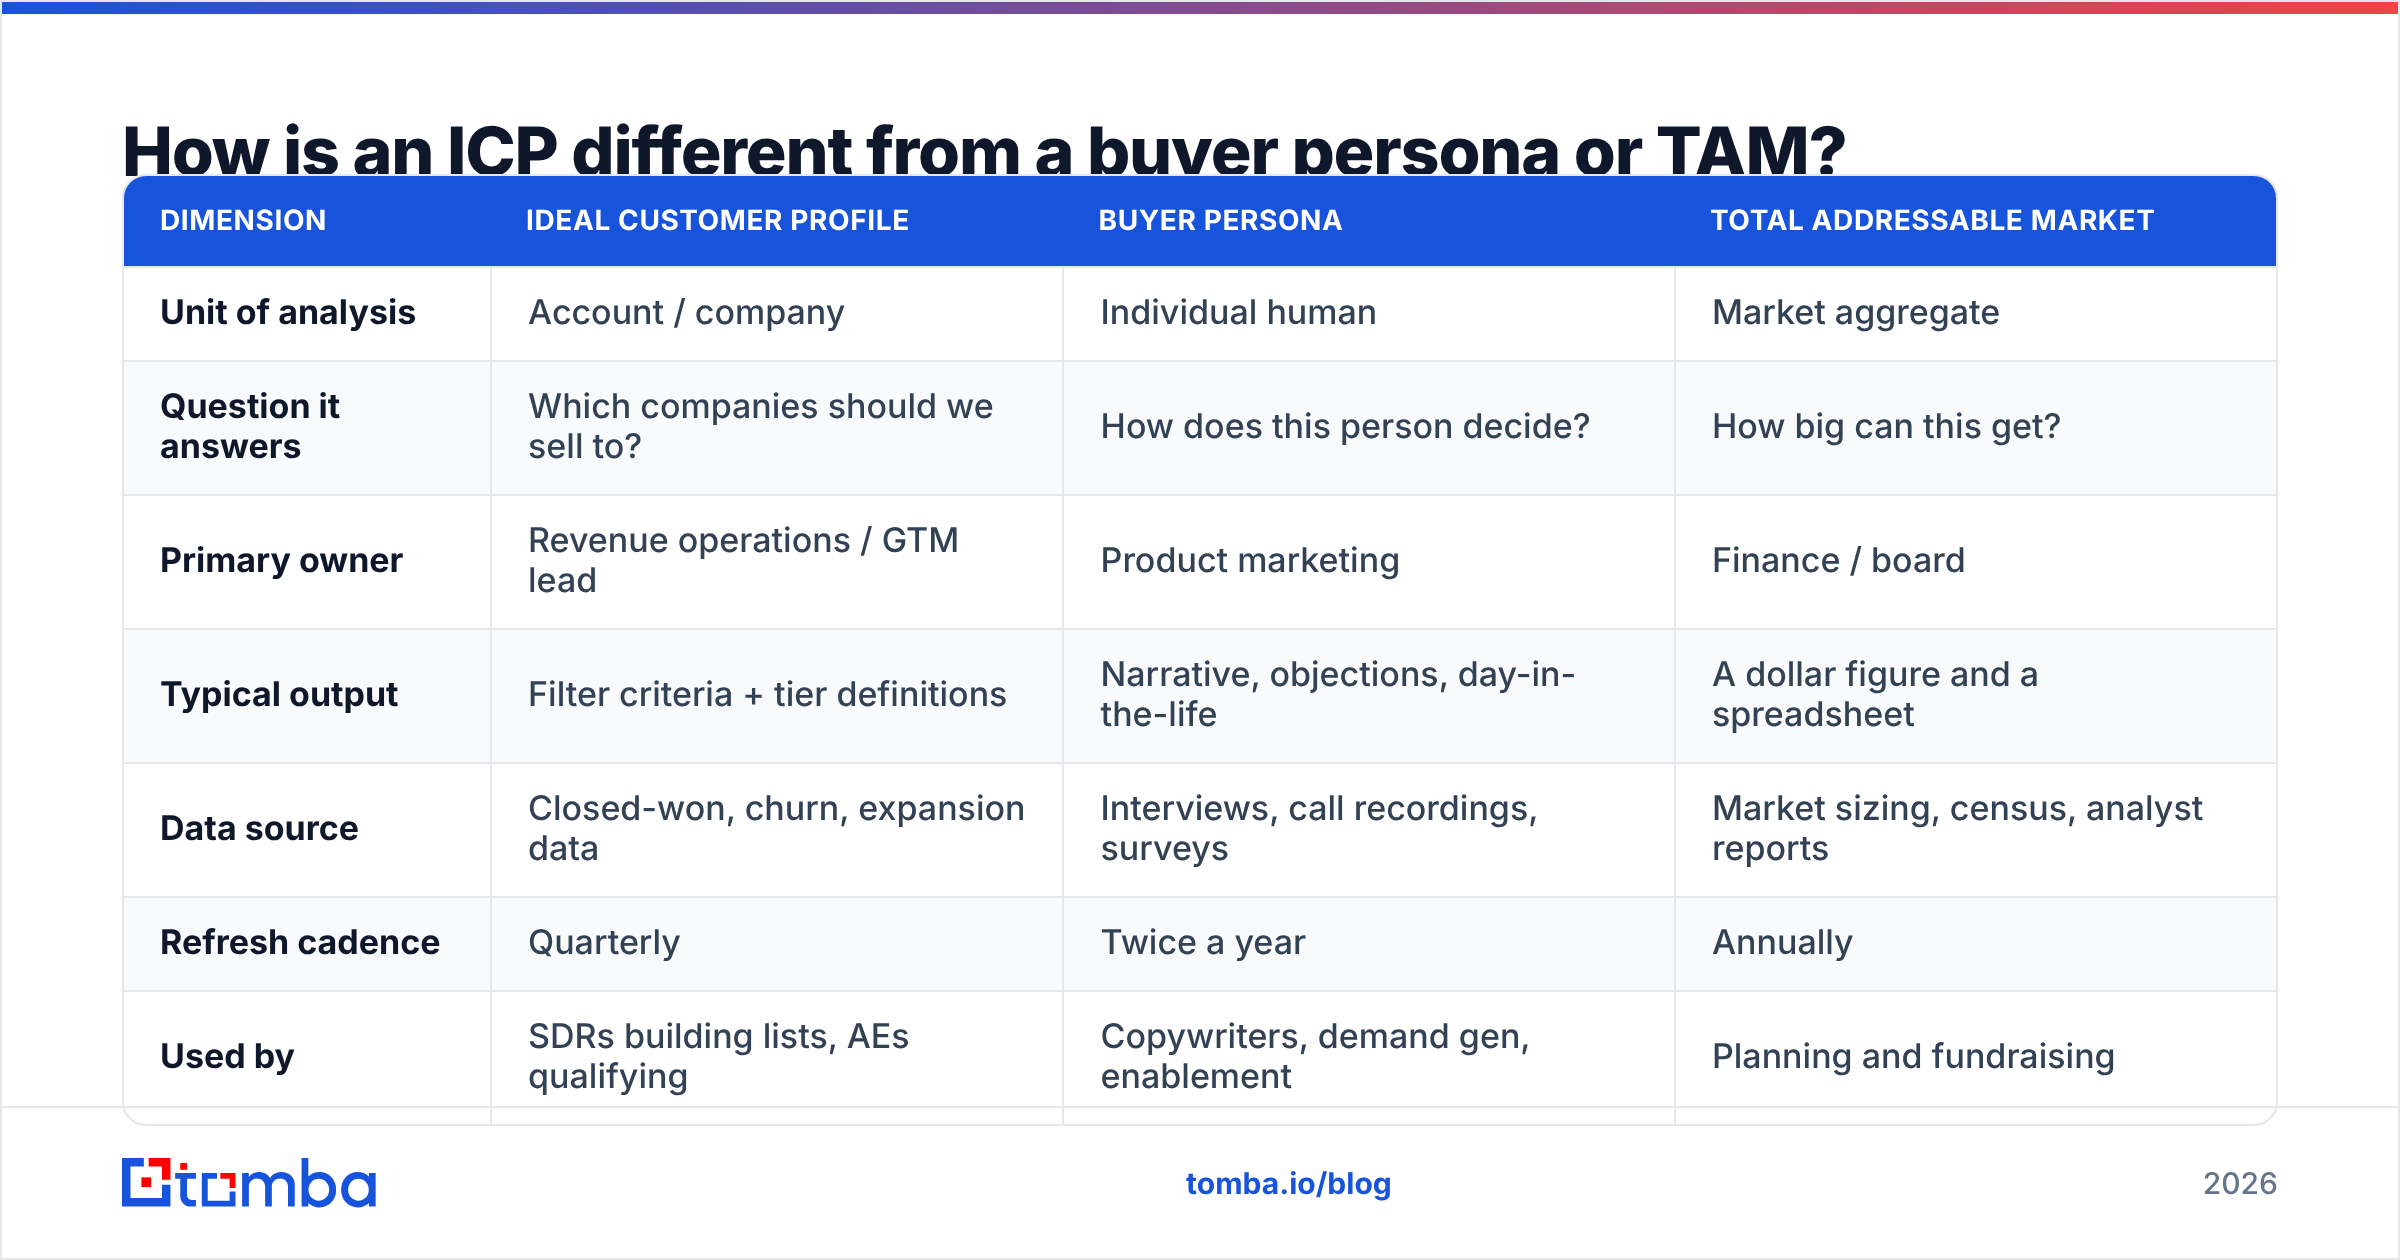
Teams use these three terms as if they mean the same thing. That is how you end up with target lists nobody trusts. They answer different questions, and different people own them.
| Dimension | Ideal customer profile | Buyer persona | Total addressable market |
|---|---|---|---|
| Unit of analysis | Account / company | Individual human | Market aggregate |
| Question it answers | Which companies should we sell to? | How does this person decide? | How big can this get? |
| Primary owner | Revenue operations / GTM lead | Product marketing | Finance / board |
| Typical output | Filter criteria + tier definitions | Narrative, objections, day-in-the-life | A dollar figure and a spreadsheet |
| Data source | Closed-won, churn, expansion data | Interviews, call recordings, surveys | Market sizing, census, analyst reports |
| Refresh cadence | Quarterly | Twice a year | Annually |
| Used by | SDRs building lists, AEs qualifying | Copywriters, demand gen, enablement | Planning and fundraising |
The practical result: an SDR cannot build a list from a persona. A copywriter cannot write a sequence from an ICP. You need both, and they need to be separate docs. When a team says the ICP "isn't working," the cause is usually simple. They wrote persona content — motives, pain points, hopes — into a field meant to be a filter.
TAM is the loosest of the three, and the most abused. Analyst frameworks from firms like Gartner work well for a board story. They are near-useless for list building. They stop at the level of industries, not domains.
How do you build your ICP from existing customer data?#
Five steps. Budget one working day if your CRM works. Budget three days if it is a graveyard.
Step 1 — Export your last 24 months of closed-won. Include ACV, cycle length, close date, source, and current status: active, churned, or expanded. Fewer than 20 closed-won accounts? Skip the analysis. Interview every customer instead. Small samples will lie to you.
Step 2 — Rank by value, not by logo. Sort by a blend of ACV, gross margin, and retention. That famous enterprise logo ate nine months of pre-sales and churned at renewal. It does not belong in the top quartile, however good it looks on the website.
Step 3 — Enrich the top and bottom quartiles. Pull firmographics and technographics for both groups. You are hunting for traits that show up in the winners and are missing in the losers. This is where data enrichment earns its cost. Researching 80 accounts by hand takes a week. A bulk pass takes an hour.
Step 4 — Find the separating variables. For each trait, compare the rate in the top quartile with the rate in the bottom. Less than a 2x spread is noise. Drop it. You are usually left with three to five real variables. That feels too few. It is exactly right.
Step 5 — Write the tiers and the disqualifiers. Turn the surviving variables into A/B/C definitions. Attach account counts, so everyone knows how big each tier is.
One caution about churn data: it flatters you. Many churned accounts left for reasons that had nothing to do with fit — bad onboarding, a champion who quit, a budget freeze. Read the churn reason codes before you write off a whole segment.
Which fit signals actually predict revenue?#
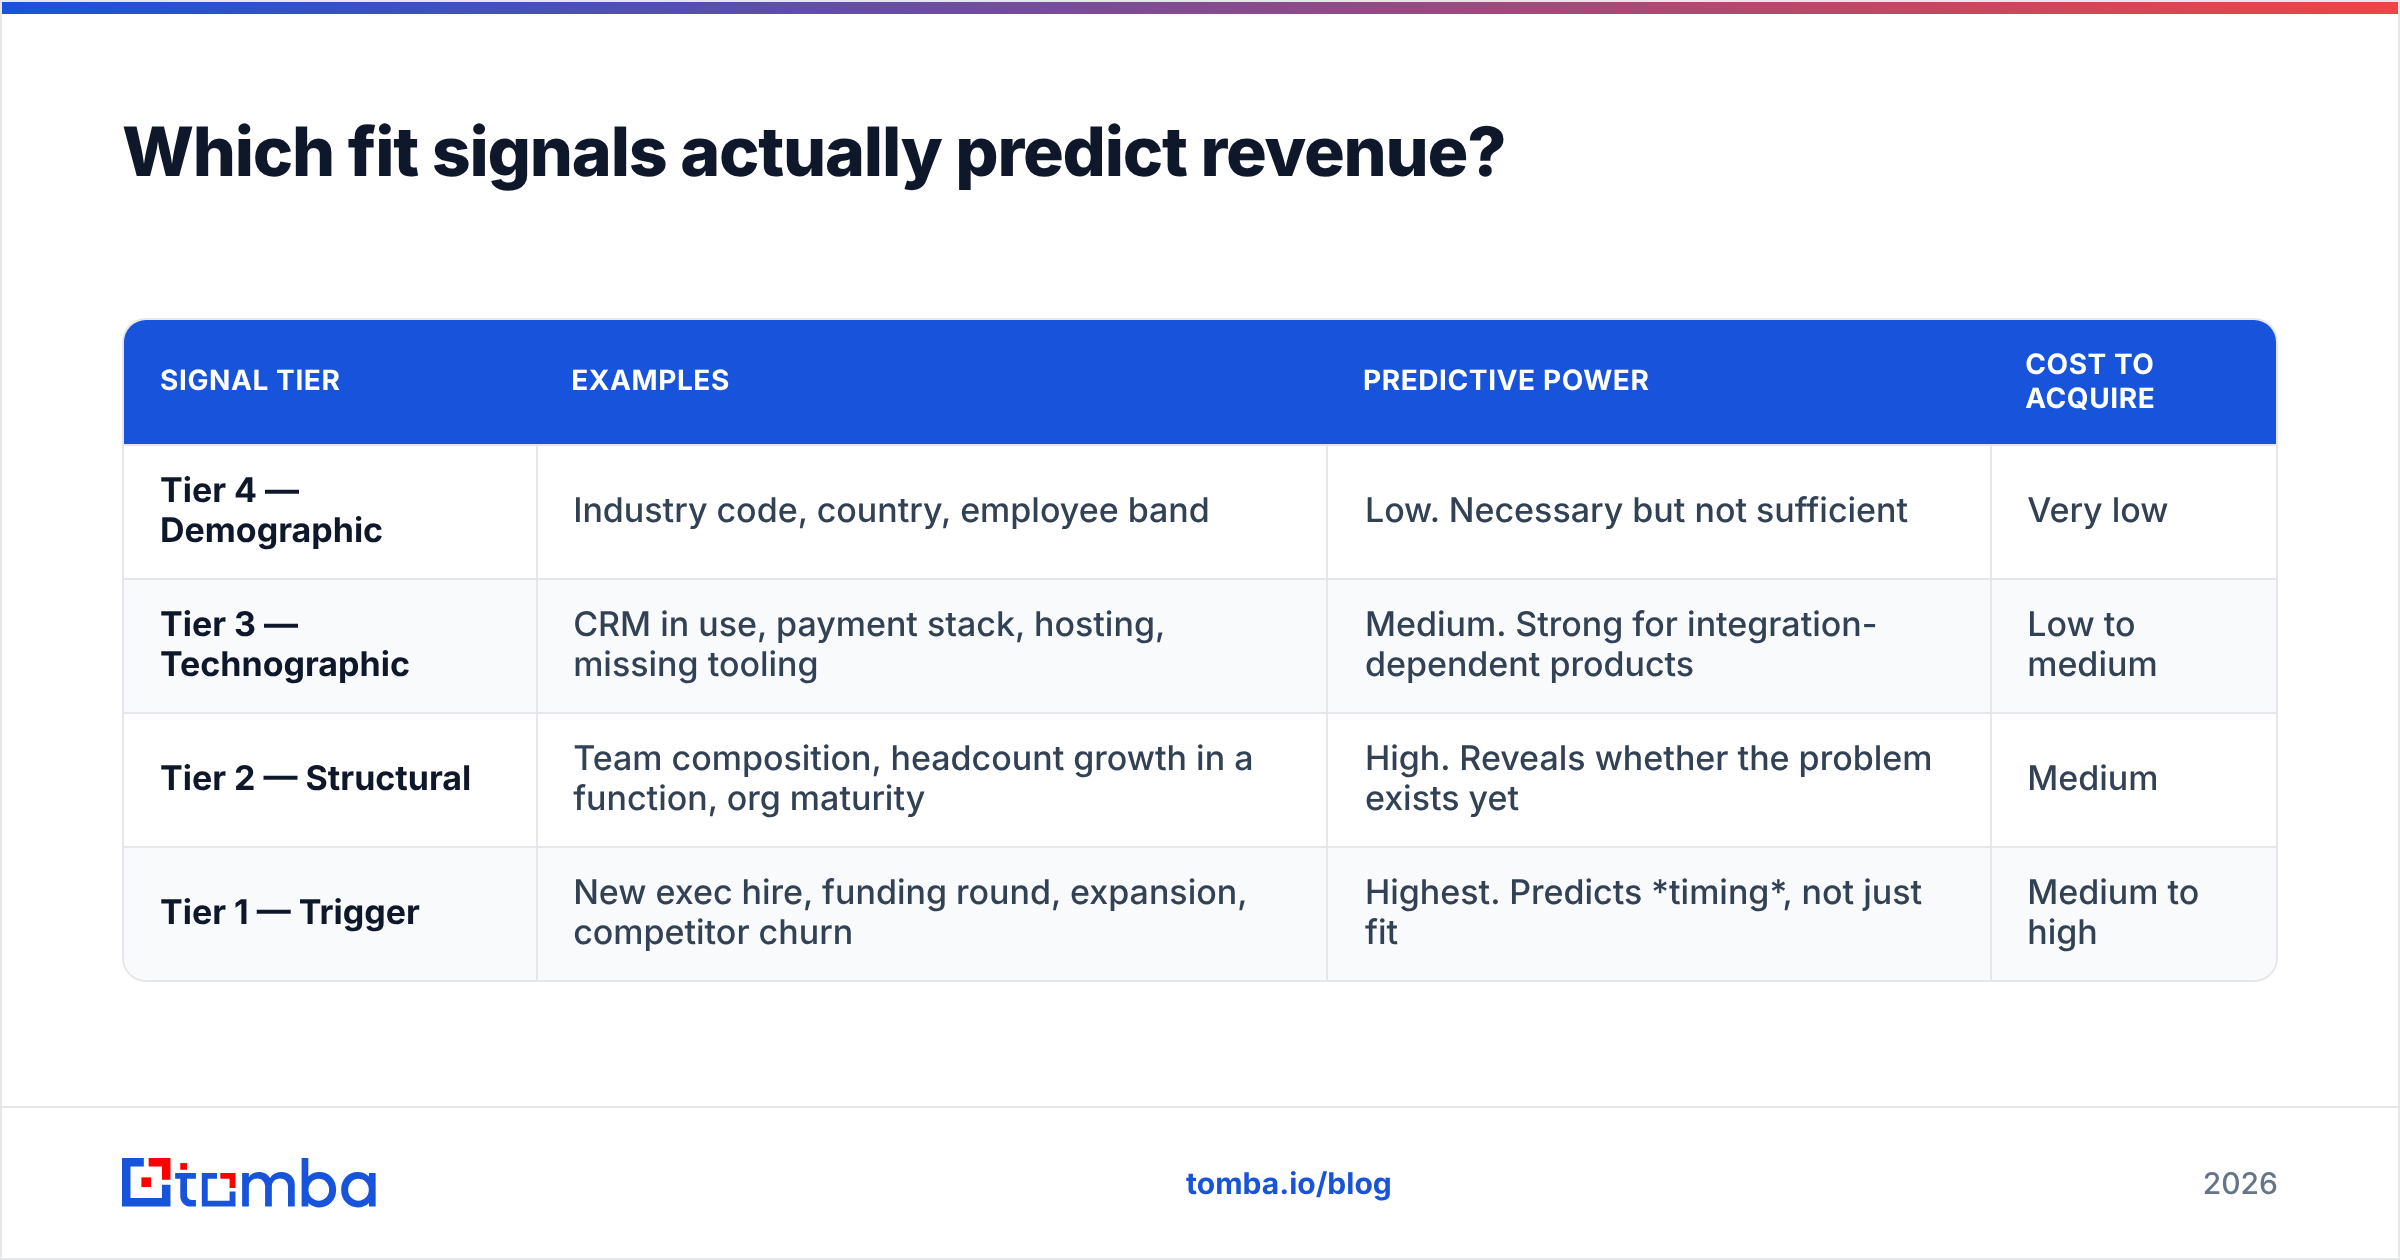
Not all signals are equal, and the cheap ones are the weakest. Here is the honest ranking, from lowest to highest predictive power:
| Signal tier | Examples | Predictive power | Cost to acquire |
|---|---|---|---|
| Tier 4 — Demographic | Industry code, country, employee band | Low. Necessary but not sufficient | Very low |
| Tier 3 — Technographic | CRM in use, payment stack, hosting, missing tooling | Medium. Strong for integration-dependent products | Low to medium |
| Tier 2 — Structural | Team composition, headcount growth in a function, org maturity | High. Reveals whether the problem exists yet | Medium |
| Tier 1 — Trigger | New exec hire, funding round, expansion, competitor churn | Highest. Predicts timing, not just fit | Medium to high |
Most teams over-invest in tier 4, because that is what list filters offer by default. Then they wonder why a perfect-on-paper list converts at 0.8%. Fit tells you whether. Triggers tell you when. A tier-B account with a fresh VP of Sales beats a tier-A account whose budget closed last month, every time.
Tier 2 is the most underrated. "Has at least two people in a demand gen function" predicts more than any revenue band for most GTM tools. It proves the buyer has the problem. It also proves someone's job depends on fixing it.
How do you turn the ICP into a prospecting list?#
The doc is worthless until it becomes rows in a sequence. The handoff has four moves:
- Turn criteria into filters you can query. Every ICP line must map to something a tool can search. "Mid-market" is not queryable. "50–400 employees, US, uses HubSpot" is.
- Build the account list first, contacts second. Account-first prevents the classic failure: a rep collects 4,000 marketing managers and has no idea which companies they sit in.
- Find the right people at each account. Once you have domains, domain search returns the contacts and email patterns at that company. Filter those down to the buying-committee roles in your template. It beats searching name by name.
- Verify before you send. ICP-perfect accounts still bounce. Run every address through an email verifier. Treat catch-all domains as their own segment instead of pretending they are valid.
For a full rebuild, a bulk email finder is the difference between a two-hour job and a two-week one. Would you rather buy the account layer than build it? List vendors such as BookYourData are a fair starting point for filtered account data. Apply your own disqualifiers and a verification pass on top. No vendor knows your churn cohort.
One rule: keep the ICP tier as a field on the account record in your CRM. If tier lives only in a spreadsheet, it dies within a quarter. On the record, it drives routing, SLAs, forecast weighting, and the quarterly review that tells you whether the ICP was right.
How do you know your ICP is wrong?#
Four signals, all measurable:
- Tier-A win rate is barely higher than tier-C. If A closes at 22% and C closes at 19%, your criteria separate nothing. Go back to step 4.
- Reps quietly work off-ICP accounts and still hit quota. Believe the pipeline, not the doc. Ask them what they found. It is a segment you missed.
- Churn is concentrated inside tier A. This is the painful one. It usually means you tuned for close rate, not for retained revenue.
- Your best new logos came from a channel your ICP calls weak. Attribution by segment, run quarterly, catches this.
Review quarterly. Rewrite once a year. Keep the old versions. The diff between last year's ICP and this year's is one of the most useful docs a GTM team makes. It shows where the market moved before anyone said so out loud. Outside input helps too. Category pages on G2 show which nearby tools your best-fit accounts already buy. That is a free technographic signal.
What does a finished B2B ICP look like?#
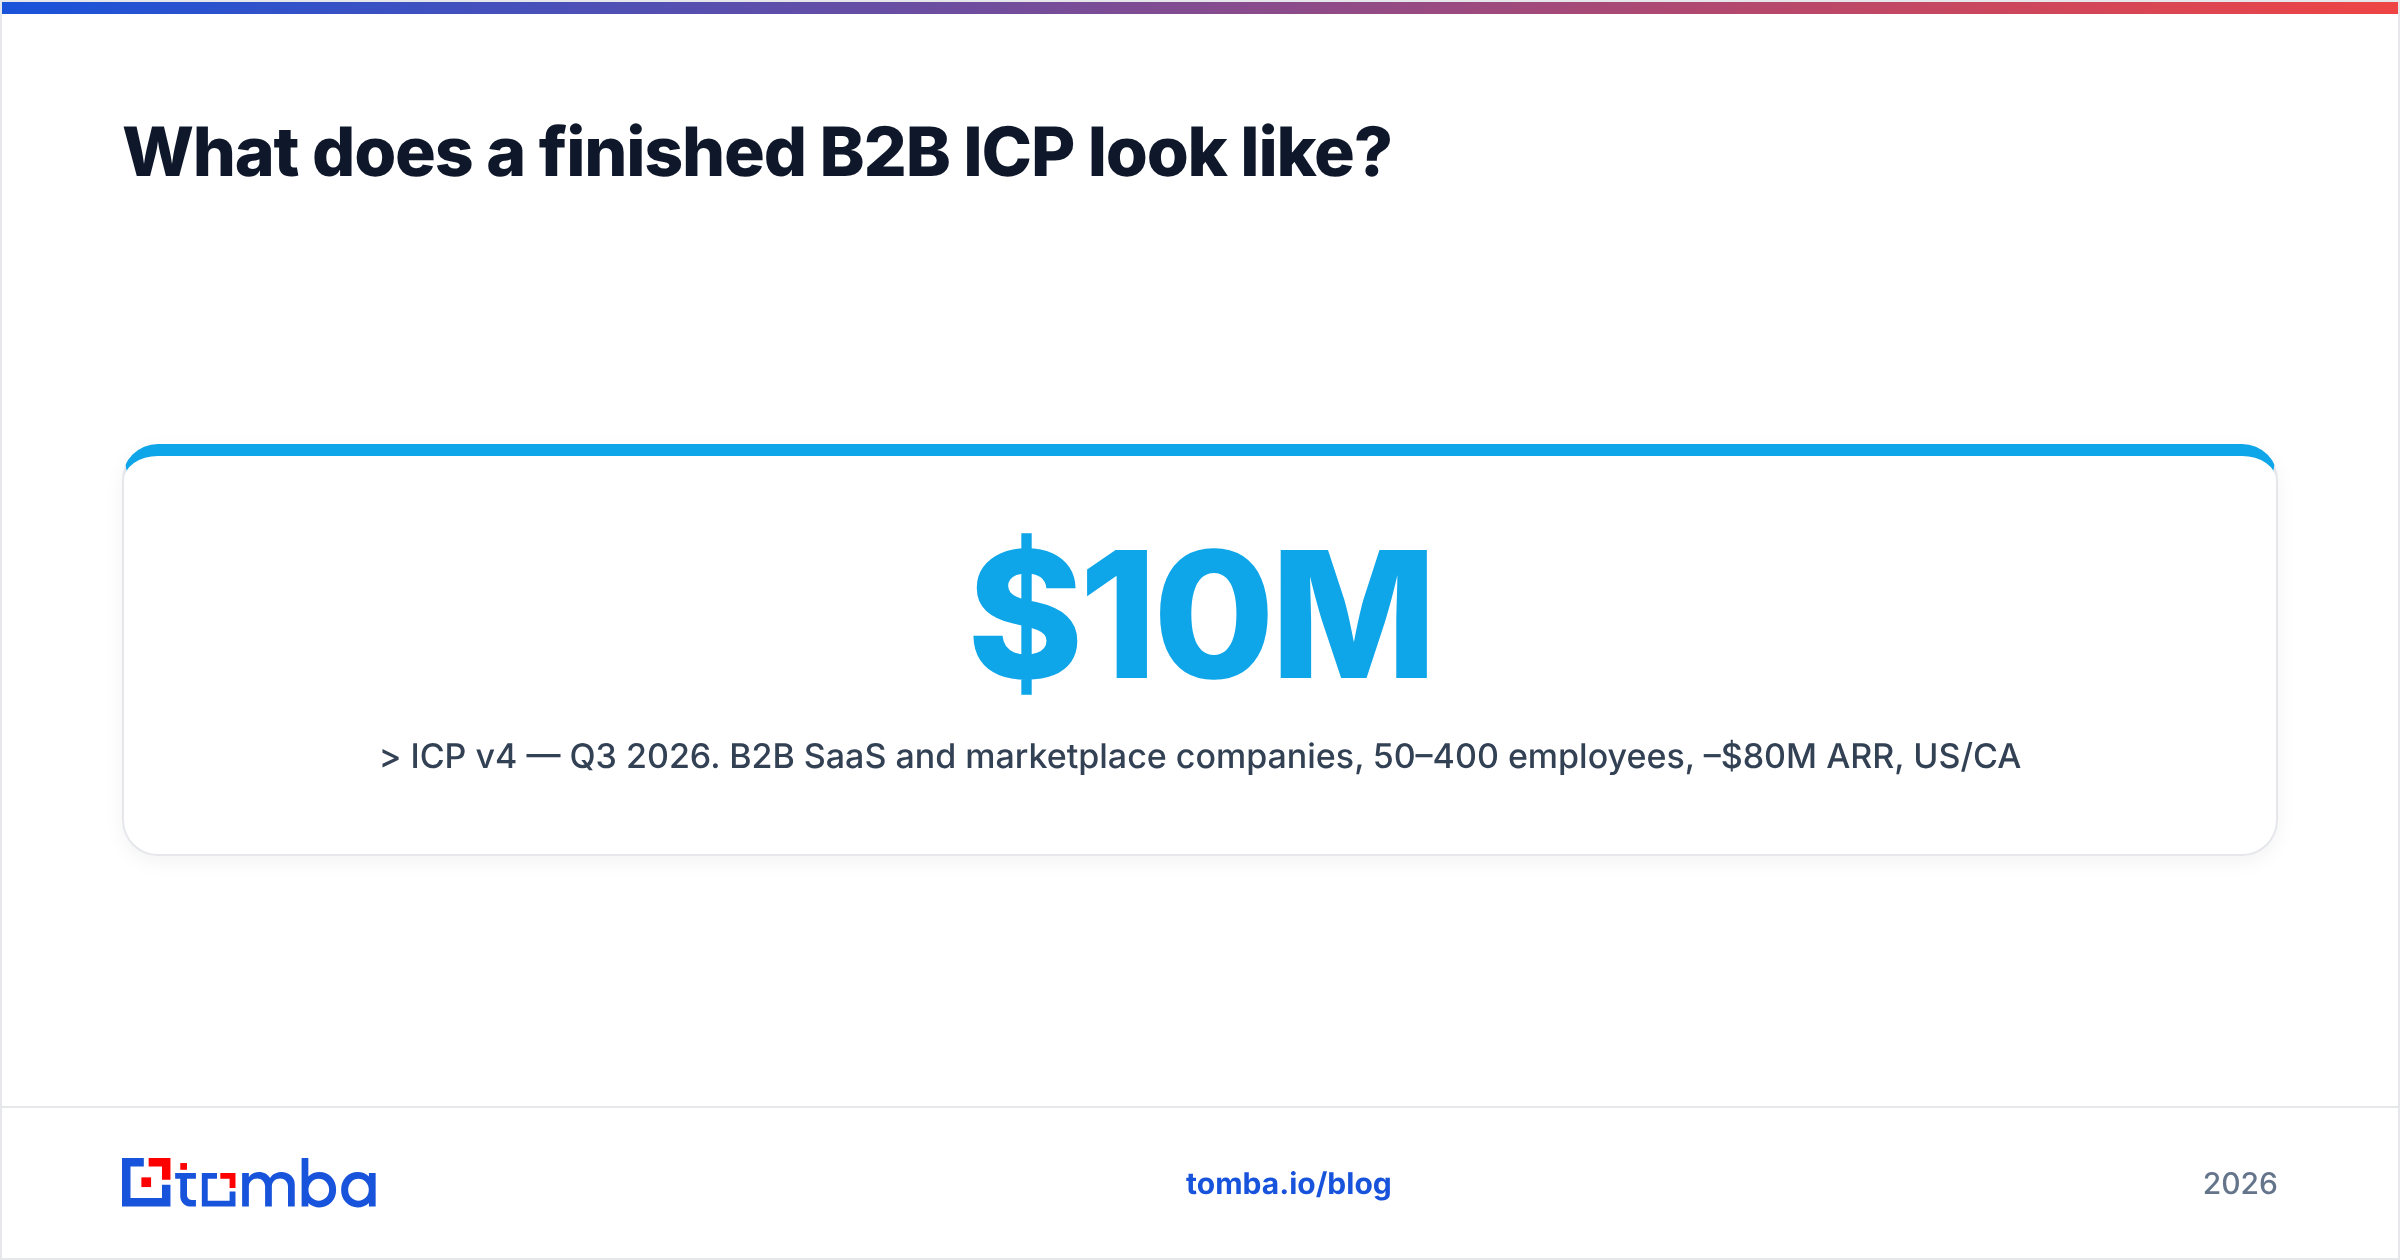
A finished ideal customer profile template B2B teams can act on fits on one page. Something like:
ICP v4 — Q3 2026. B2B SaaS and marketplace companies, 50–400 employees, $10M–$80M ARR, US/CA/UK, using HubSpot or Salesforce, with 2+ people in a demand-gen function and no in-house data engineering team. Trigger: new VP/Head of Marketing or Sales in the last 90 days, or a Series A/B raise in the last 6 months. Committee: champion = Head of Demand Gen, economic buyer = CRO, blocker = IT security. Disqualify: agencies, <10 employees, public sector, anyone already on a two-year enterprise data contract. Tier A = all criteria + trigger (est. 1,900 accounts). Tier B = all criteria, no trigger (est. 6,400). Tier C = 3 of 5 criteria (est. 19,000, marketing-nurture only). Proof: tier A shows $14.2k ACV, 41-day cycle, 118% NRR versus $6.1k / 96 days / 91% for everything else.
That fits in a Slack message. It routes leads. It kills bad-fit deals in discovery. And it survives contact with an SDR on a Monday morning. Anything longer gets skimmed and ignored.
Where should you start this week?#
Pick your twenty best accounts. Enrich them. Find the three traits they share that your twenty worst do not. Then build the list.
Once your criteria are written, Tomba Email Finder is the fastest way to go from ICP domains to verified, role-matched contacts. Domain search pulls every contact at a target account. Verification keeps bounce rates low. Enrichment backfills the firmographic fields your CRM is missing. The free tier gives you 25 searches a month to test your criteria against real data, and paid plans start at $49/mo on Tomba pricing. Start with one tier-A segment. Run 200 verified contacts. Then let the reply rate tell you whether your ideal customer profile was actually ideal.
Related guides#
// get started
Find, verify and enrich your first contacts today
Start on the free plan with 25 searches a month, then scale when your team is ready.
Free plan · No credit card required · GDPR & CCPA
// about the author