Inbound Sales Conversion Rate: Benchmarks and Fixes 2026
Most teams quote an inbound sales conversion rate that hides three broken stages. Here is the stage-by-stage math, honest 2026 benchmarks, and the fixes that actually move the number.
TL;DR
- Your inbound sales conversion rate is not one number. It is at least five multiplied together, and a single weak stage drags the whole chain down.
- Median inbound lead-to-customer conversion for B2B SaaS sits around 2-5%. Demo-request-to-close is a different animal: 20-35% is normal, and anything above 40% usually means you are under-counting leads.
- Speed-to-lead is still the single highest-leverage variable. Contacting an inbound lead within five minutes versus thirty minutes changes qualification odds by a multiple, not a few points.
- Bad contact data silently taxes every stage. If 18% of your form fills have unreachable emails, your "conversion problem" is partly a data problem.
- Fix measurement first, routing second, data third, copy fourth. Doing it in the reverse order is why most conversion projects fail.
What is an inbound sales conversion rate?#
Your inbound sales conversion rate is the percentage of self-initiated prospects — form fills, demo requests, trial signups, chat conversations — that become paying customers.
Think of it like a restaurant. Foot traffic walking past the window is your website traffic. People who open the door are your inbound leads. People who sit down are your qualified opportunities. People who order and pay are your customers. If you only measure "diners per passerby," you will never know whether the problem is the window display, the host at the door, or the menu.
That is the mistake almost every revenue team makes. They report one blended number — "we convert 3% of inbound" — and then argue about it in a QBR without knowing which door is jammed.
The honest definition has three parts:
- A defined numerator. Closed-won deals attributed to an inbound source, within a fixed attribution window.
- A defined denominator. Every inbound lead that entered the system in the same cohort — not just the ones your reps decided to work.
- A defined cohort period. Leads created in month N, measured after your full sales cycle has elapsed. Dividing this month's closes by this month's leads is arithmetic, not analysis.
Miss any of the three and your inbound sales conversion rate becomes a vanity metric that moves when your ops team changes a filter.
How do you calculate it at each stage?#
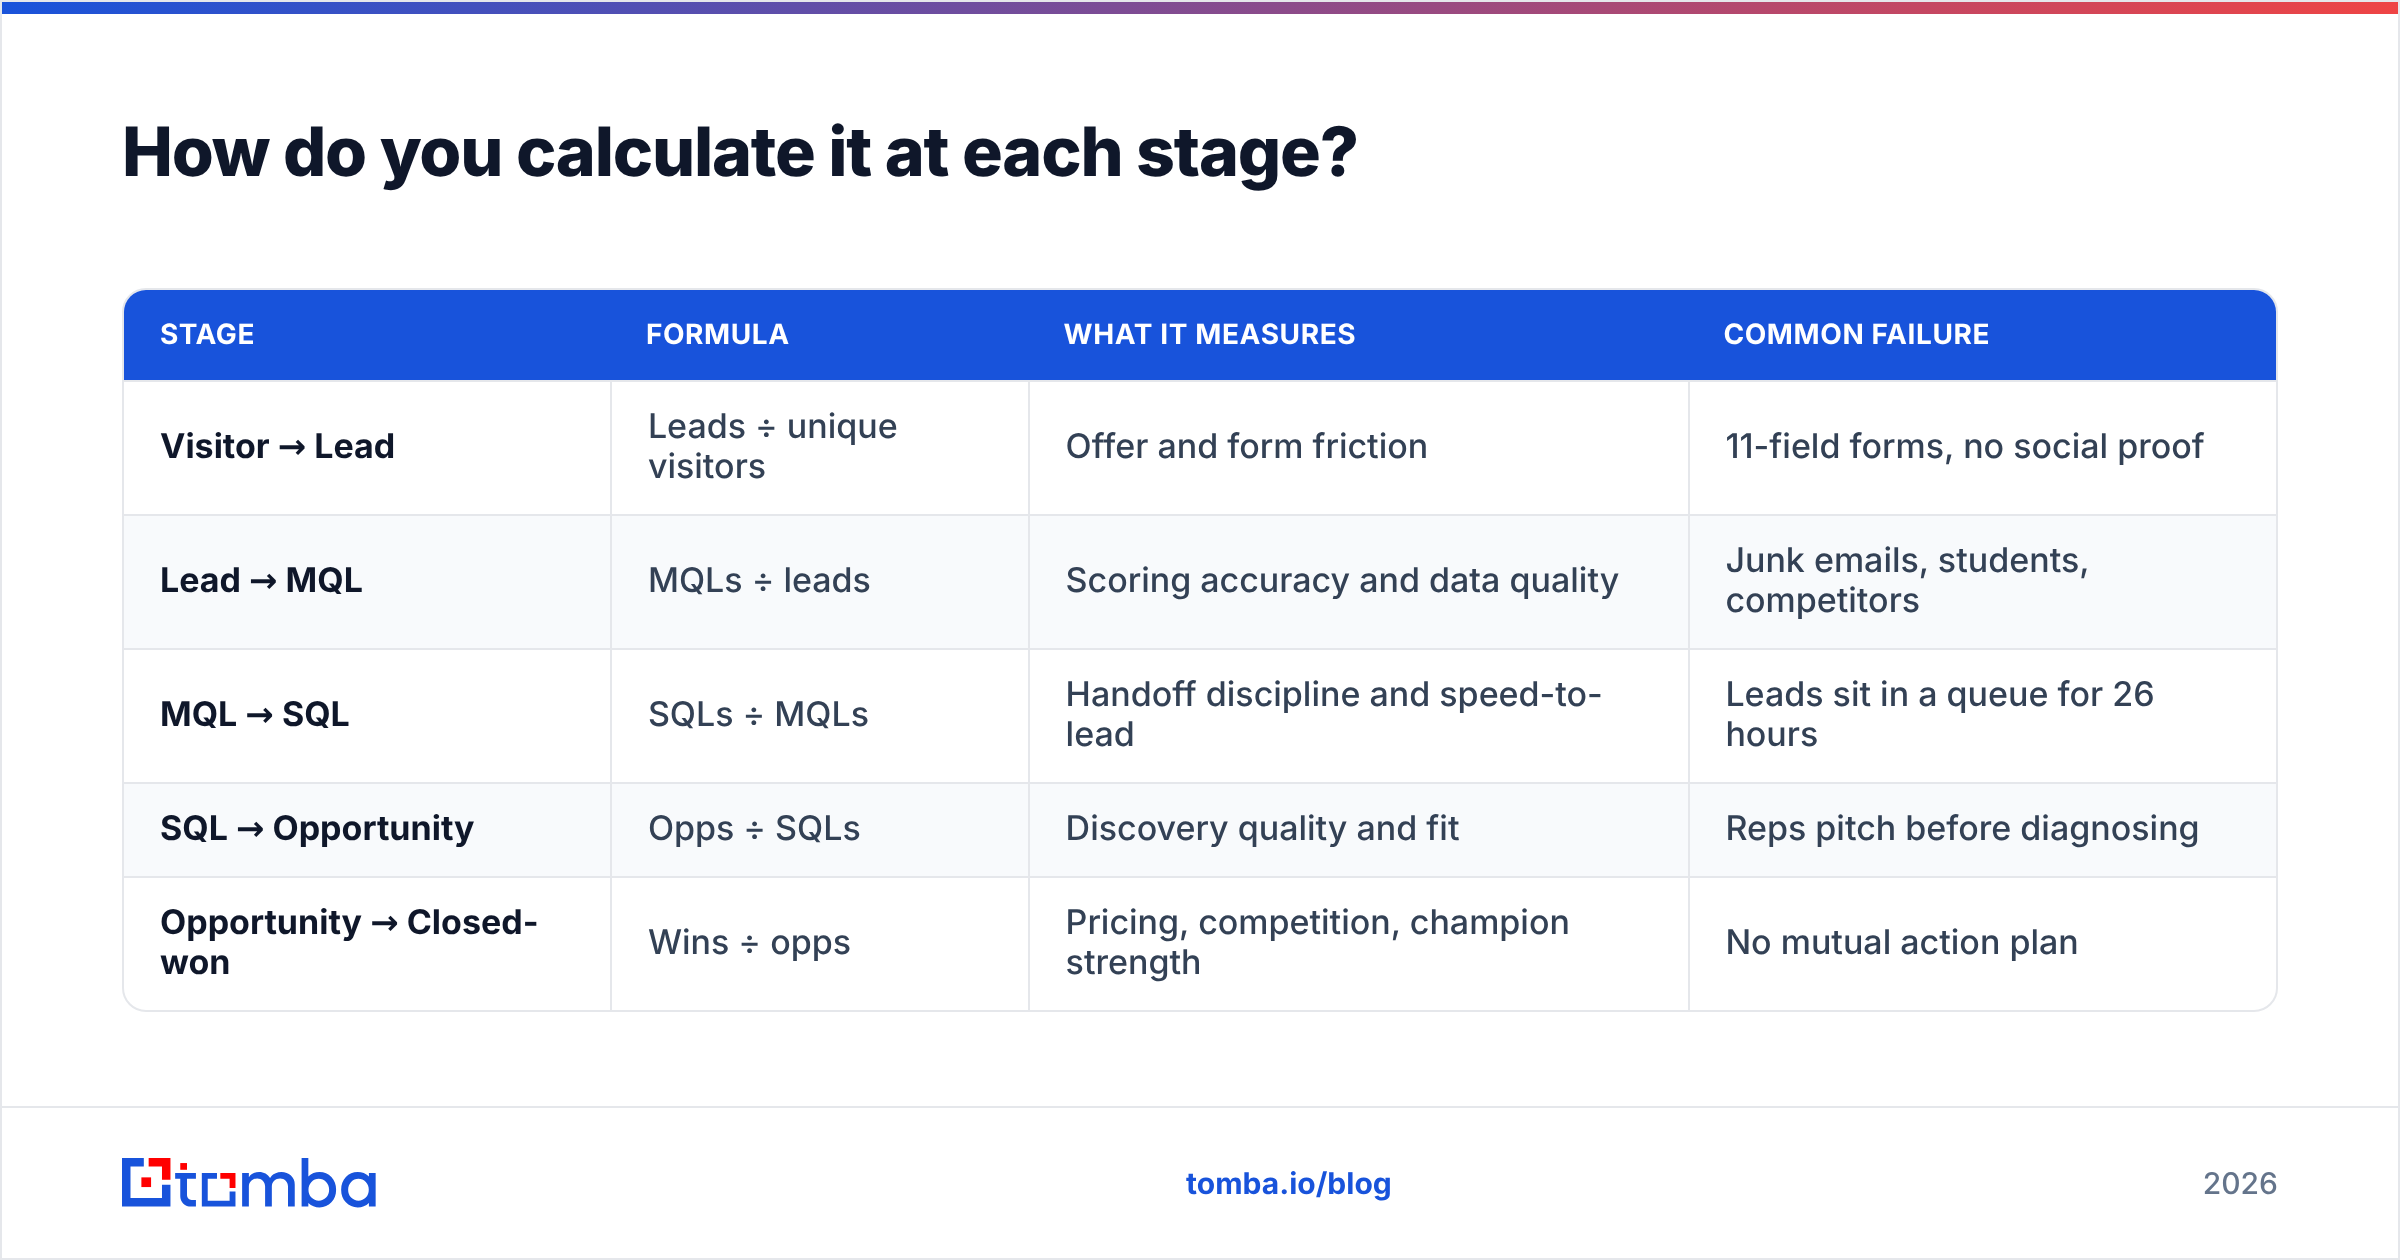
Break the funnel into discrete conversions and multiply. Here is the standard B2B chain with the math spelled out.
| Stage | Formula | What it measures | Common failure |
|---|---|---|---|
| Visitor → Lead | Leads ÷ unique visitors | Offer and form friction | 11-field forms, no social proof |
| Lead → MQL | MQLs ÷ leads | Scoring accuracy and data quality | Junk emails, students, competitors |
| MQL → SQL | SQLs ÷ MQLs | Handoff discipline and speed-to-lead | Leads sit in a queue for 26 hours |
| SQL → Opportunity | Opps ÷ SQLs | Discovery quality and fit | Reps pitch before diagnosing |
| Opportunity → Closed-won | Wins ÷ opps | Pricing, competition, champion strength | No mutual action plan |
Multiply the stage rates and you get your true inbound sales conversion rate. A funnel running 2.5% visitor-to-lead, 40% lead-to-MQL, 55% MQL-to-SQL, 60% SQL-to-opp and 25% opp-to-win produces a 3.3% lead-to-customer rate — and a 0.08% visitor-to-customer rate.
Now here is the useful part. If you lift only the MQL→SQL stage from 55% to 70%, your lead-to-customer rate moves from 3.3% to 4.2%. That is a 27% revenue increase from one stage, no extra traffic, no extra headcount. Understanding the win rate math at each step is what separates a conversion strategy from a wish.
What is a good inbound sales conversion rate in 2026?#
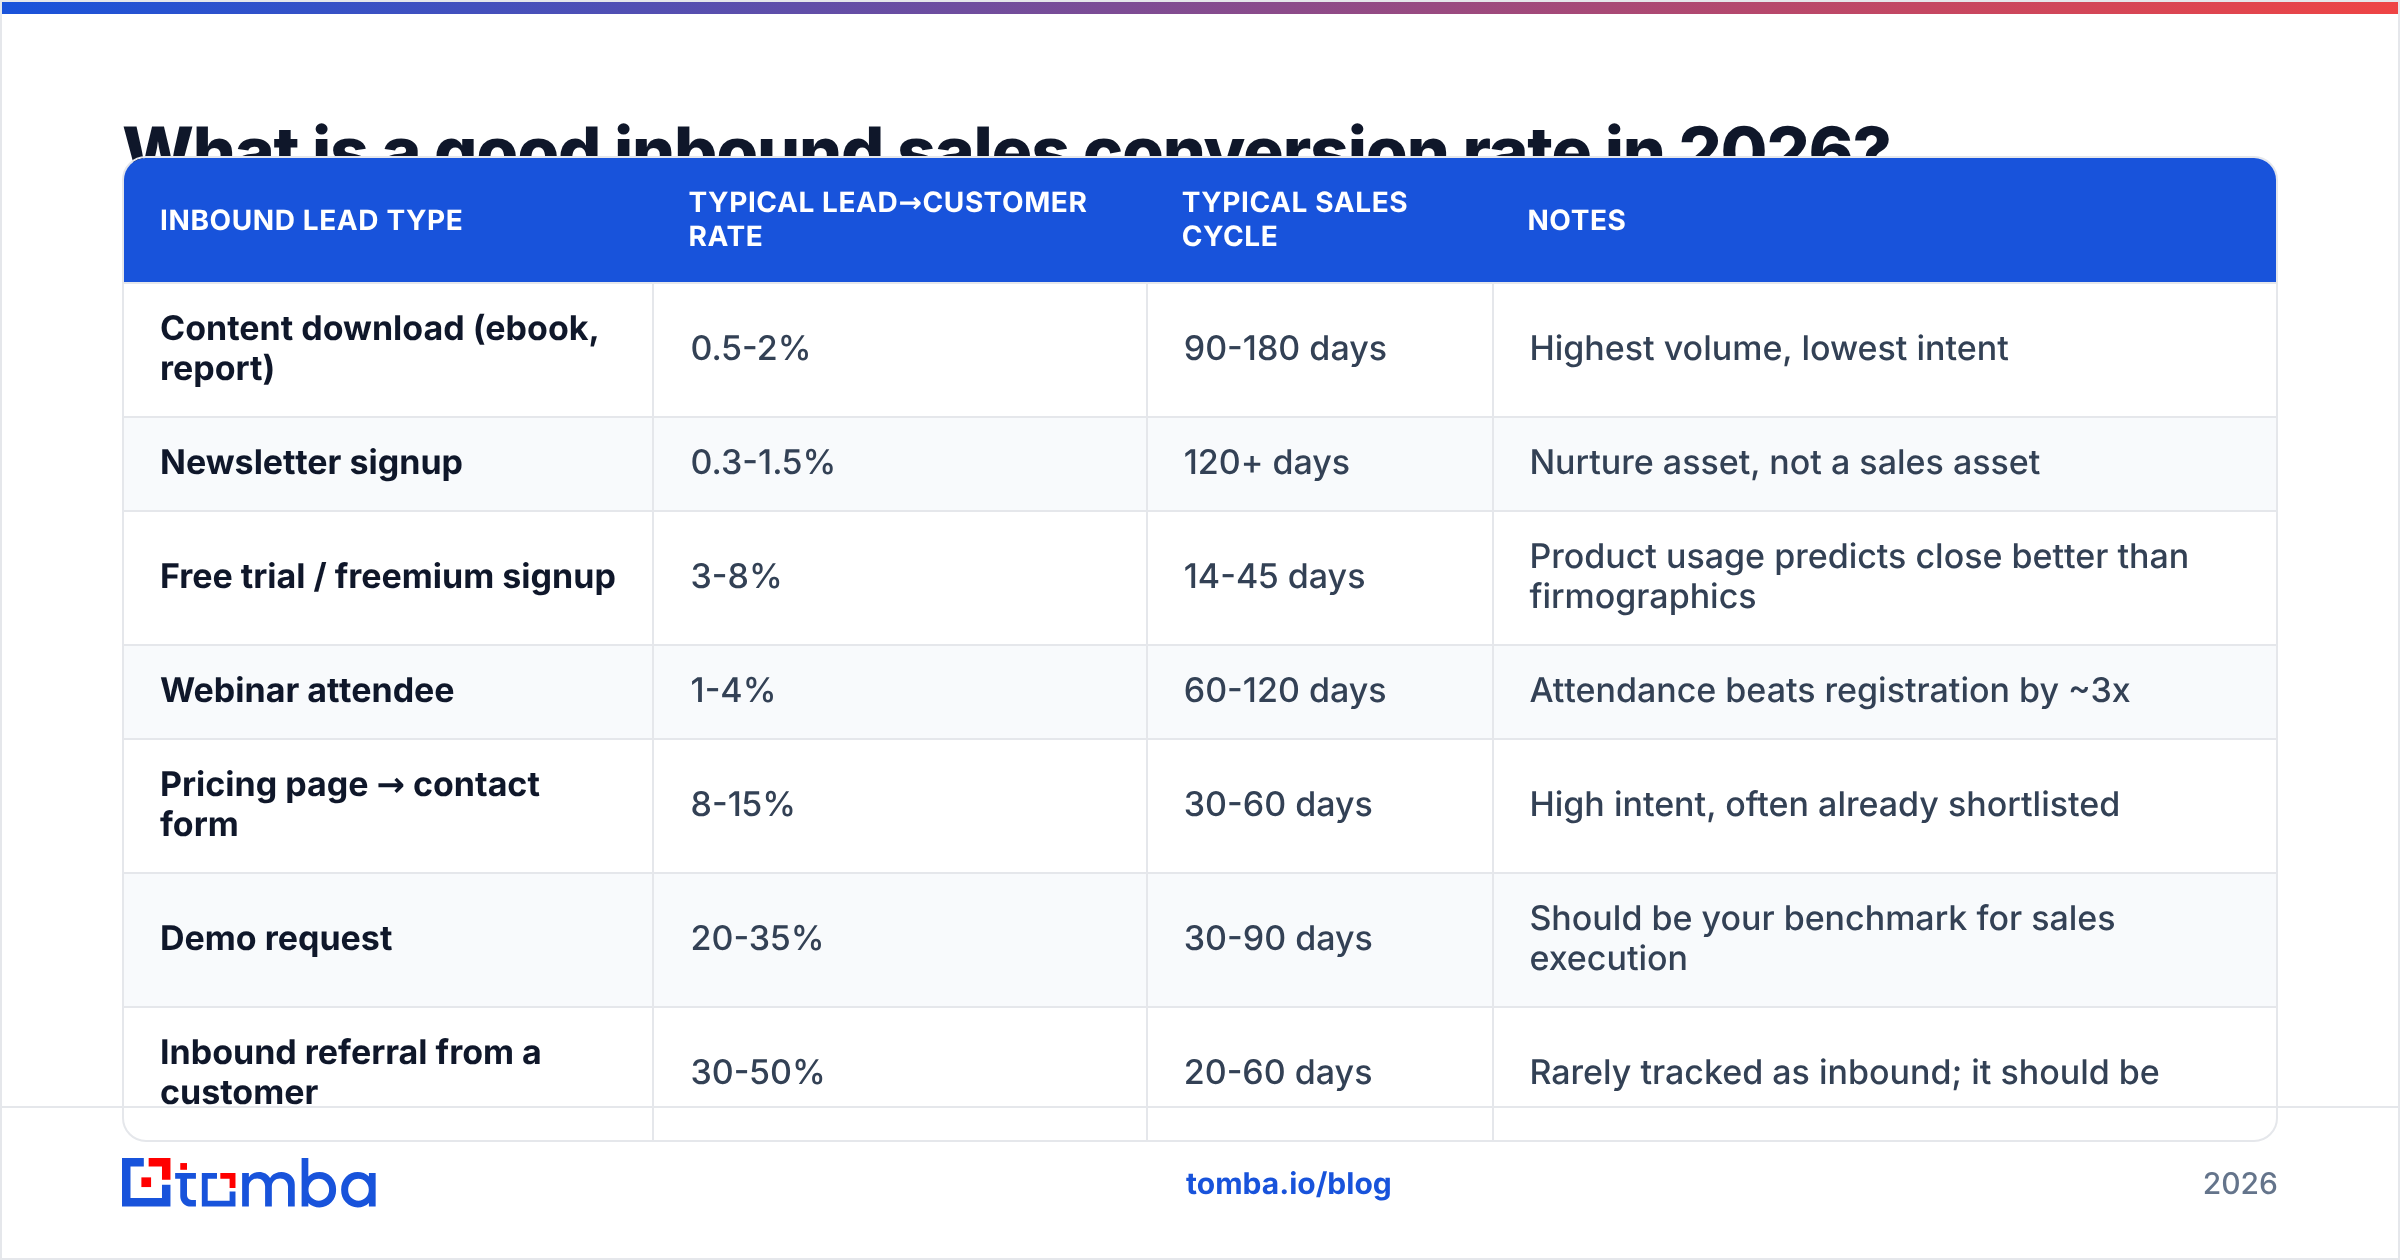
"Good" depends entirely on lead type. A gated ebook download and a "talk to sales" click are not the same species, and comparing them is the fastest way to draw a wrong conclusion.
| Inbound lead type | Typical lead→customer rate | Typical sales cycle | Notes |
|---|---|---|---|
| Content download (ebook, report) | 0.5-2% | 90-180 days | Highest volume, lowest intent |
| Newsletter signup | 0.3-1.5% | 120+ days | Nurture asset, not a sales asset |
| Free trial / freemium signup | 3-8% | 14-45 days | Product usage predicts close better than firmographics |
| Webinar attendee | 1-4% | 60-120 days | Attendance beats registration by ~3x |
| Pricing page → contact form | 8-15% | 30-60 days | High intent, often already shortlisted |
| Demo request | 20-35% | 30-90 days | Should be your benchmark for sales execution |
| Inbound referral from a customer | 30-50% | 20-60 days | Rarely tracked as inbound; it should be |
Two caveats before you benchmark yourself against this table.
First, ACV changes everything. A $600/year product converting inbound at 12% and a $180,000 ACV product converting at 4% can be equally healthy businesses. Industry data from sources like HubSpot's marketing statistics and Gartner's sales research consistently shows conversion rates falling as deal size rises — that is physics, not failure.
Second, your definition of "lead" determines your number more than your sales skill does. Teams that count every chatbot interaction as a lead will report 1%. Teams that only count demo requests will report 28%. Neither team is better at selling. They are counting differently.
Does speed-to-lead still move the number?#
Yes, and it is still the most under-executed lever in B2B.
The classic Lead Response Management study found that contacting a lead within five minutes versus thirty minutes made qualification roughly 21 times more likely. That research is old now, and the multiple has compressed as buyers got more asynchronous — but the direction has never reversed in any replication. Recent vendor benchmarks put the modern advantage at somewhere between 5x and 8x, which is still enormous.
Here is what actually happens when a form fill sits for six hours: the prospect submits forms to three vendors in one sitting. Vendor A calls in four minutes and books a meeting. Vendors B and C call the next morning and hear "we've already got something scheduled." Your conversion rate did not drop because your product got worse. It dropped because you were third in line.
Practical speed-to-lead fixes, in order of effort:
- Instant calendar booking on the thank-you page. Removes the human latency entirely for demo requests. Highest ROI change on this list.
- Round-robin routing with a five-minute SLA. Alerts fire in Slack, not just email. Unclaimed leads escalate after 300 seconds.
- Enrich before you route. Appending firmographics and a verified contact channel at form-submit time lets you route by segment instead of by round-robin. Contact enrichment at the point of capture takes milliseconds via API and removes the "who owns this?" delay.
- Pre-verify the email on submit. A bounced first touch costs you the whole lead. Running an email verifier check at capture flags typos ("gmial.com") before your rep wastes a day.
- Give reps a phone number, not just an email. Inbound leads who requested a demo expect a call. Having a B2B phone number attached to the record roughly doubles first-touch connect options.
Why is your inbound conversion rate lower than the benchmark?#
Nine times out of ten it is one of four causes, and they are diagnosable in an afternoon.
Cause 1: Your denominator is polluted. Free-email-domain signups, competitors doing research, and students count as leads in most CRMs. If 30% of your inbound is structurally unclosable, your reported conversion rate is 30% lower than your actual sales effectiveness. Segment your report by email domain type before you conclude anything.
Cause 2: Your MQL definition is scoring behavior you do not control. Points for opening emails and visiting the blog produce marketing qualified leads that reps hate. Points for pricing-page visits, integration-doc views, and multi-stakeholder activity produce leads reps fight over. Same scoring engine, opposite outcomes.
Cause 3: The handoff has no contract. Marketing throws leads over the wall, sales cherry-picks, and nobody agrees on what "worked" means. If you cannot answer "how many inbound leads were contacted three or more times within 10 days?" you do not have a conversion problem — you have a coverage problem.
Cause 4: Reps run inbound like outbound. An inbound lead already knows they have a problem. Opening with a discovery script designed for cold prospects insults their research and burns the intent advantage. Inbound calls should start closer to "here's what usually causes what you described" than to "so, tell me about your business."
Should you fix routing, data, or copy first?#
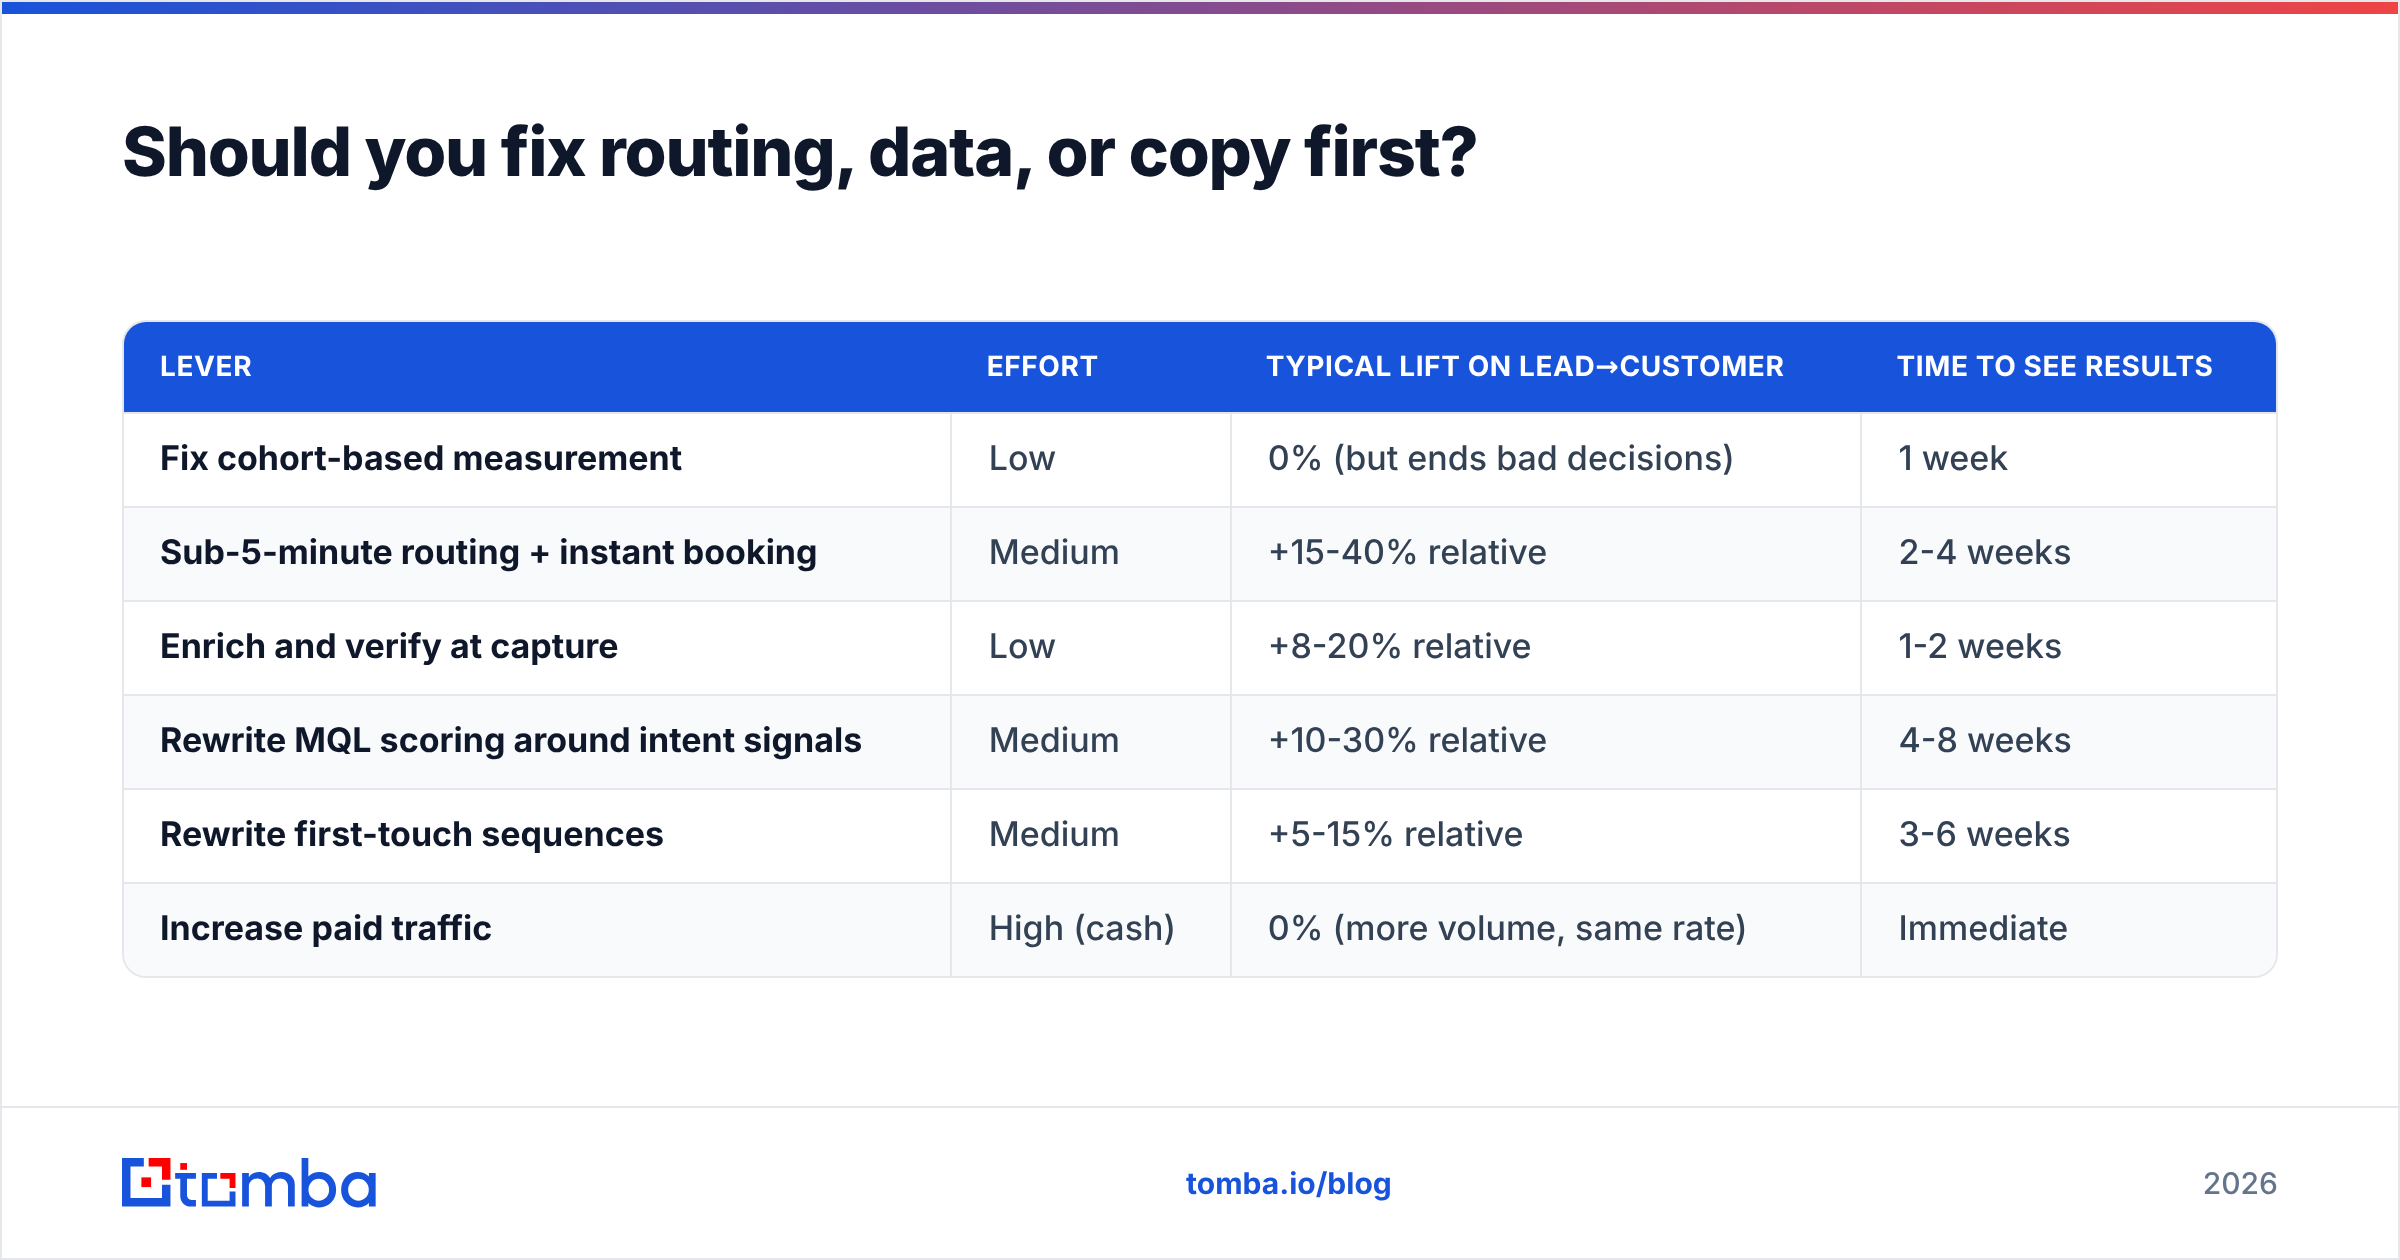
Fix the cheapest constraint with the biggest multiplier. In practice that ordering is almost always: measurement → routing → data → copy.
| Lever | Effort | Typical lift on lead→customer | Time to see results |
|---|---|---|---|
| Fix cohort-based measurement | Low | 0% (but ends bad decisions) | 1 week |
| Sub-5-minute routing + instant booking | Medium | +15-40% relative | 2-4 weeks |
| Enrich and verify at capture | Low | +8-20% relative | 1-2 weeks |
| Rewrite MQL scoring around intent signals | Medium | +10-30% relative | 4-8 weeks |
| Rewrite first-touch sequences | Medium | +5-15% relative | 3-6 weeks |
| Increase paid traffic | High (cash) | 0% (more volume, same rate) | Immediate |
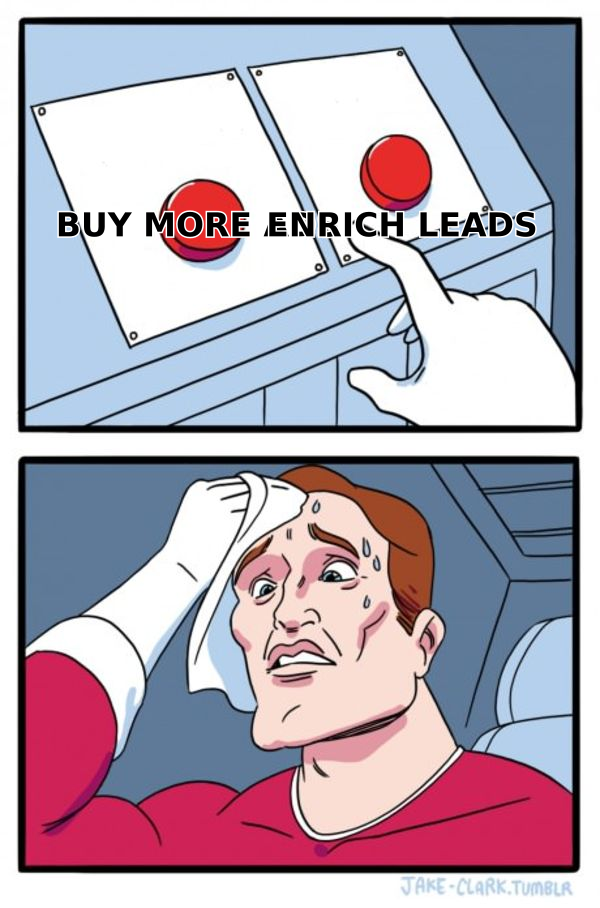
That last row matters. Buying more traffic does not improve your inbound sales conversion rate — it just buys more of the same rate at a higher CAC. Teams reach for it because it is the only lever a budget can pull alone.
What tools support inbound conversion work?#
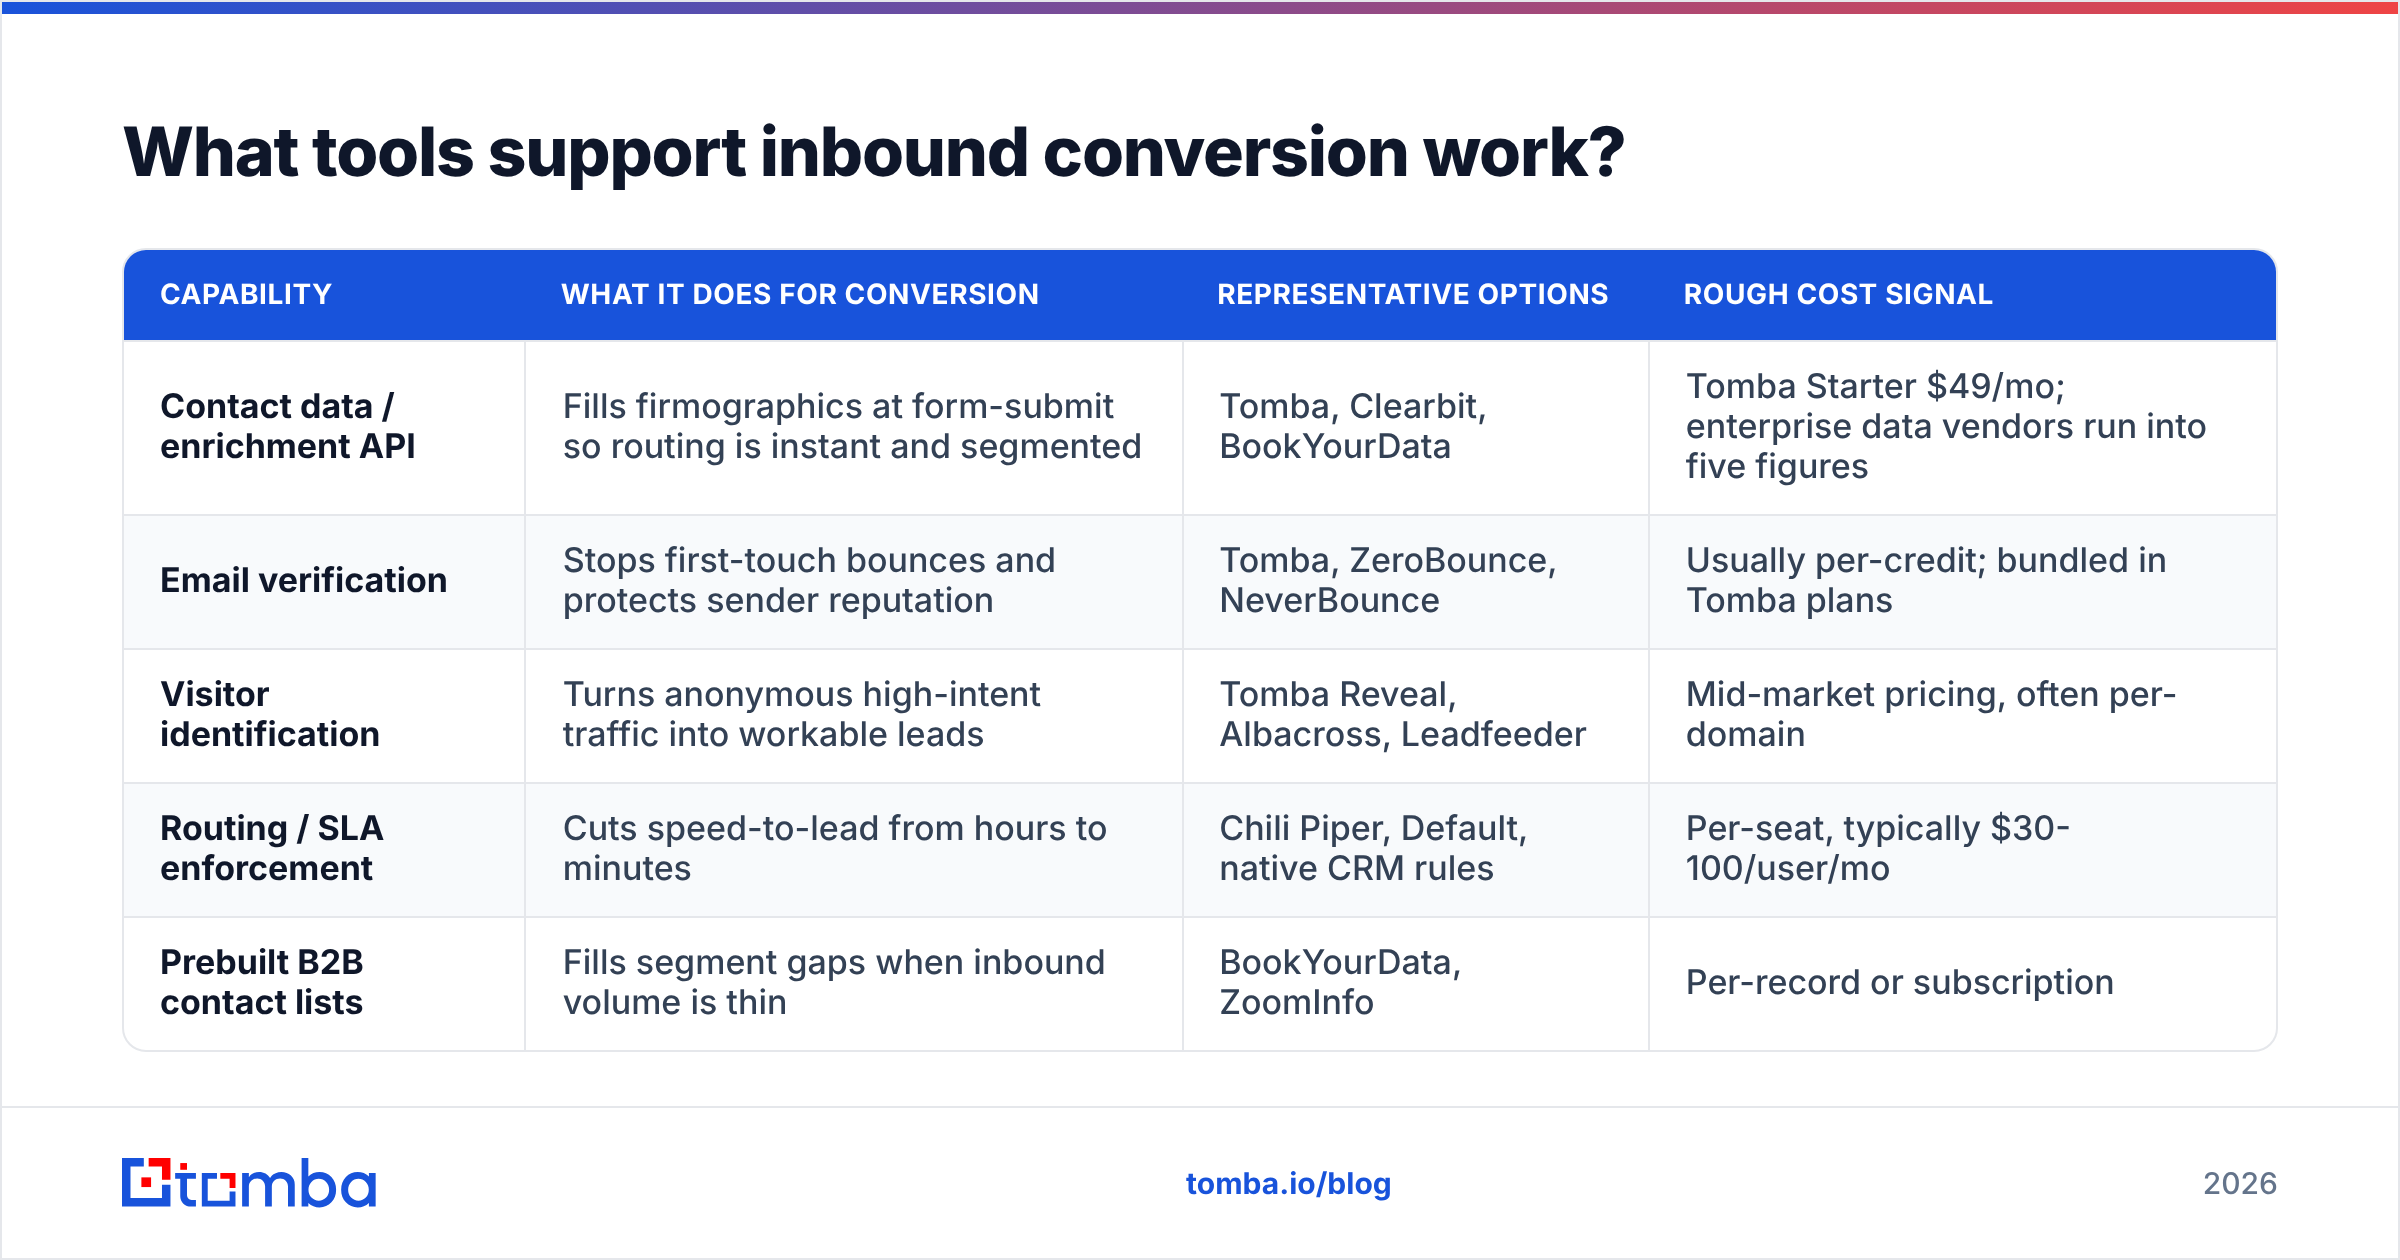
You need four capabilities: capture, enrichment, verification, and routing. Some platforms bundle them; most teams assemble two or three.
| Capability | What it does for conversion | Representative options | Rough cost signal |
|---|---|---|---|
| Contact data / enrichment API | Fills firmographics at form-submit so routing is instant and segmented | Tomba, Clearbit, BookYourData | Tomba Starter $49/mo; enterprise data vendors run into five figures |
| Email verification | Stops first-touch bounces and protects sender reputation | Tomba, ZeroBounce, NeverBounce | Usually per-credit; bundled in Tomba plans |
| Visitor identification | Turns anonymous high-intent traffic into workable leads | Tomba Reveal, Albacross, Leadfeeder | Mid-market pricing, often per-domain |
| Routing / SLA enforcement | Cuts speed-to-lead from hours to minutes | Chili Piper, Default, native CRM rules | Per-seat, typically $30-100/user/mo |
| Prebuilt B2B contact lists | Fills segment gaps when inbound volume is thin | BookYourData, ZoomInfo | Per-record or subscription |
BookYourData is worth a mention here for teams whose inbound volume is genuinely too low to optimize — you cannot improve a conversion rate on 40 leads a month, and a clean purchased list plus outbound is often the correct answer before conversion work makes sense. Check current Tomba pricing if you want the enrichment and verification side on a single meter: Free tier includes 25 searches/month, Starter is $49/mo, Growth $99/mo, and Pro $249/mo.
For evaluating any of these, real buyer reviews on G2 will tell you more about support quality and data freshness than any vendor benchmark page — including this one.
How do you track it without lying to yourself?#
Build one report and defend it from edits.
Cohort by creation month, not close month. Leads created in January get measured in April, once your median cycle has fully elapsed. Anything else mixes cohorts and produces a number that moves for reasons nobody can explain.
Report the chain, not the summary. Every conversion review should show all five stage rates side by side, with last quarter's figures next to them. The summary number is for the board. The chain is for the team.
Segment by three dimensions minimum. Lead source, lead type, and company size. A blended inbound sales conversion rate that mixes ebook downloads with demo requests is not measuring anything real.
Track contact-attempt coverage as a leading indicator. Conversion is a lagging metric with a 90-day delay. "Percentage of inbound leads contacted within five minutes" tells you today whether next quarter will be good.
Audit your data quality quarterly. Pull 200 random inbound records and check how many have a valid, reachable business email and a correct company assignment. If that number is below 85%, your conversion ceiling is set by your data, not your reps.
What should you do in the next 30 days?#
Week one: rebuild the report as a cohort chain with all five stages. Do not change anything else. You will almost certainly discover the weak stage is not where you assumed.
Week two: instrument speed-to-lead. Measure the actual median minutes from form submit to first human contact attempt. Most teams believe it is under an hour and discover it is over nine.
Week three: add enrichment and verification at the point of capture so routing is instant and first touches land. This is the smallest change on the list with the most compounding effect — every downstream stage inherits cleaner data.
Week four: rewrite your inbound first-touch script to acknowledge that the prospect came to you. Cut the discovery preamble in half and lead with a hypothesis.
Do those four things and a 3% inbound sales conversion rate becomes a 4% one without a single extra dollar of ad spend.
Start with the data layer. Every routing rule, scoring model, and first-touch sequence you build sits on top of contact records that are either accurate or aren't. Tomba Email Finder verifies and completes inbound contact records at capture time via API, so your reps reach the right person on the first attempt instead of the third. The free tier gives you 25 searches a month to test it against your own form fills before you commit to anything.
Related guides#
// get started
Find, verify and enrich your first contacts today
Start on the free plan with 25 searches a month, then scale when your team is ready.
Free plan · No credit card required · GDPR & CCPA
// about the author