How to Increase Sales Revenue in 2026: A Practical Playbook
Most revenue plans fail because they add activity instead of fixing the math. Here is the four-lever model that actually moves the number, plus the benchmarks to check your work.
TL;DR
- Revenue is an equation, not an effort level:
pipeline created × win rate × average deal size ÷ sales cycle length. If you can't say which of those four terms you're changing this quarter, you're not running a revenue plan — you're running an activity plan. - The cheapest lever for most teams is not "more leads." It's win rate and deal size on the pipeline you already have, because both compound without adding headcount.
- Bad contact data quietly taxes every other lever. A 30% invalid-email rate on outbound means you paid for 100 leads and got 70. Fix data hygiene before you buy more volume.
- Expansion revenue from existing customers closes at roughly 2-3x the rate of new logos in most B2B orgs. Most teams still spend under 20% of selling capacity there.
- Pick two levers per quarter, instrument them, and kill the rest. Teams that chase all four simultaneously move none of them measurably.
Why do most plans to increase sales revenue fail?#
Because they confuse inputs with outputs.
The standard response to a revenue gap is "do more" — more calls, more emails, more demos booked. That works exactly once, when a team is genuinely under-utilised. After that, activity increases and revenue doesn't, because the constraint was never activity. It was conversion, pricing, cycle length, or data quality.
Here's the analogy: if your bathtub is draining, turning the tap up higher does technically raise the water level. It also wastes water and hides the hole. Most revenue plans are tap-turning exercises.
The alternative is to treat revenue as an equation you can differentiate. Four terms, four levers:
- Pipeline created — the volume and quality of qualified opportunities entering the funnel each period. Constrained by targeting accuracy, contactability, and channel mix.
- Win rate — the percentage of qualified opportunities that close. Constrained by qualification discipline, competitive positioning, and multi-threading.
- Average deal size (ACV) — what a closed deal is worth. Constrained by packaging, discounting behaviour, and whether reps sell to the right buying level.
- Sales cycle length — how long capital is tied up per deal. Shortening it raises revenue per rep per year without changing anything else.
Multiply the first three, divide by the fourth, and you have annual revenue per rep. Every tactic worth running maps to exactly one of those terms. If a proposed initiative doesn't, it's culture work or busy work — both can be fine, neither is a revenue plan.

Which revenue lever should you pull first?#
The one with the worst current number relative to benchmark — not the one that's easiest to talk about in a QBR.
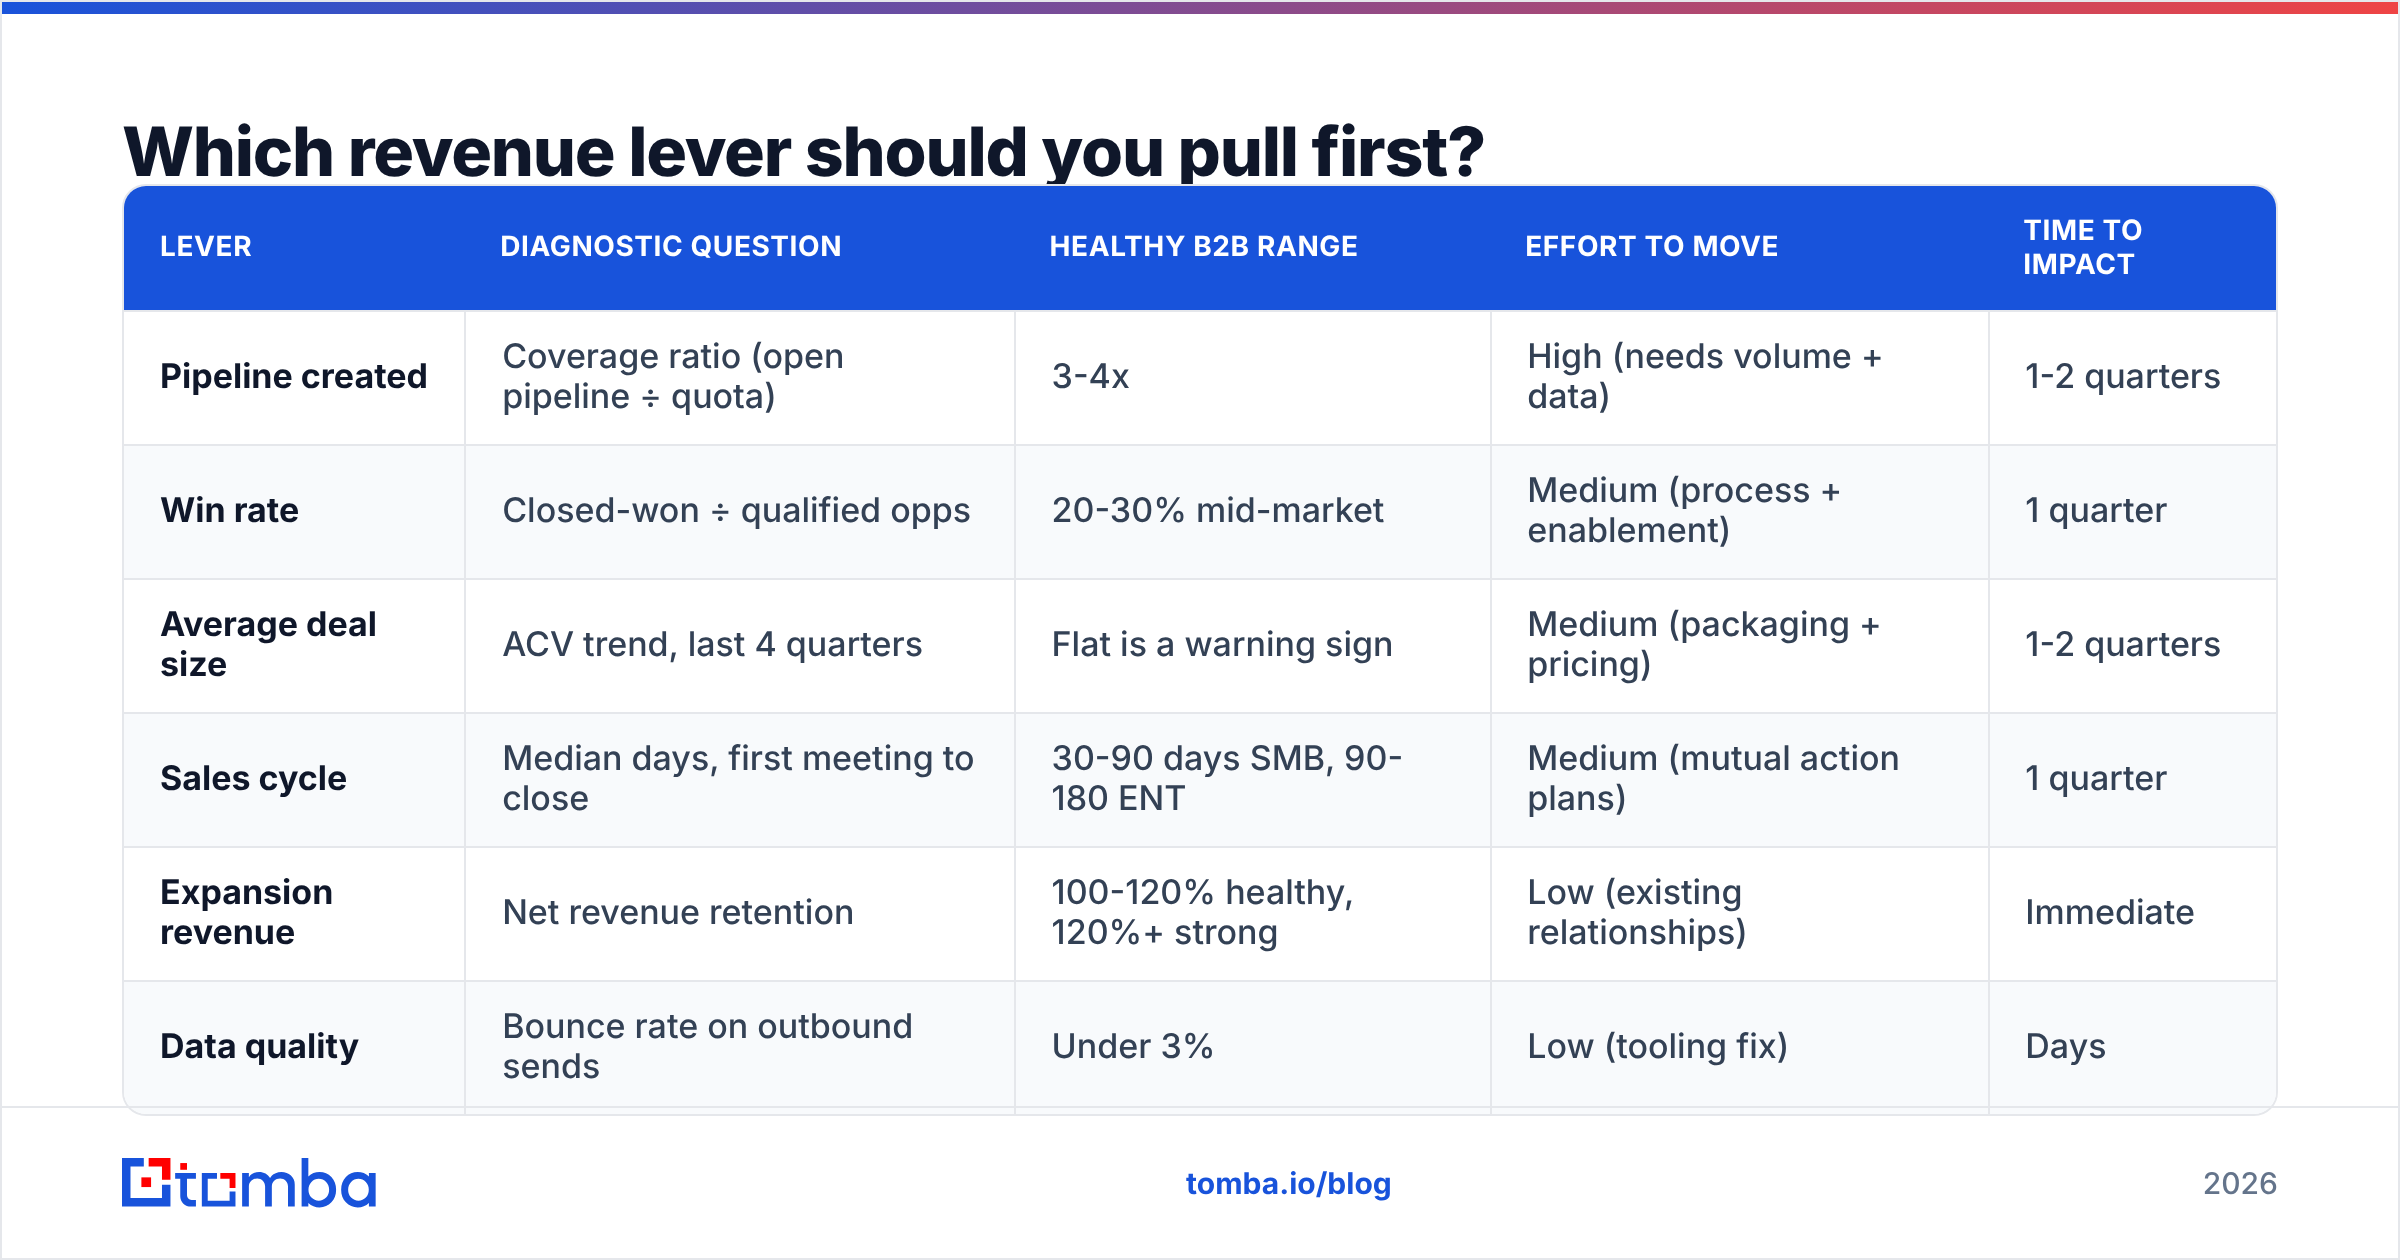
Run this diagnostic before committing to anything. Pull the last four completed quarters and fill in the right column honestly.
| Lever | Diagnostic question | Healthy B2B range | Effort to move | Time to impact |
|---|---|---|---|---|
| Pipeline created | Coverage ratio (open pipeline ÷ quota) | 3-4x | High (needs volume + data) | 1-2 quarters |
| Win rate | Closed-won ÷ qualified opps | 20-30% mid-market | Medium (process + enablement) | 1 quarter |
| Average deal size | ACV trend, last 4 quarters | Flat is a warning sign | Medium (packaging + pricing) | 1-2 quarters |
| Sales cycle | Median days, first meeting to close | 30-90 days SMB, 90-180 ENT | Medium (mutual action plans) | 1 quarter |
| Expansion revenue | Net revenue retention | 100-120% healthy, 120%+ strong | Low (existing relationships) | Immediate |
| Data quality | Bounce rate on outbound sends | Under 3% | Low (tooling fix) | Days |
Two things usually jump out of this table for teams under $20M ARR.
First, data quality is almost always the worst number and the cheapest to fix. A bounce rate above 5% isn't just wasted sends — it degrades sender reputation, which suppresses the deliverability of every legitimate email you send afterward. You are not running an outbound problem at that point. You are running an infrastructure problem wearing an outbound costume.
Second, expansion revenue is almost always under-resourced. Selling to a customer who already trusts you removes the two hardest steps: establishing credibility and getting budget approved cold. Yet most comp plans reward new logos disproportionately, so reps rationally ignore the easier revenue.
How do you increase pipeline without increasing spend?#
Improve targeting precision and contactability before you increase volume. Both are multipliers on spend you're already committing.
Targeting precision. Most ICP definitions are too broad to be useful — "B2B SaaS, 50-500 employees" describes tens of thousands of companies with wildly different buying behaviour. Tighten it using closed-won data, not aspiration. Pull your last 30 wins and find the three attributes they actually share. Often it's something unglamorous: they use a specific piece of adjacent software, they just raised a round, they have a named role in the org chart. Those are filterable signals; "innovative mid-market company" is not.
Contactability. This is where most outbound programs leak the hardest, and it's the least discussed. A prospect list is worthless if you can't reach the person on it. Three checks:
- Is the email address real? Use an email verifier before sending, not after bouncing. Verification before send costs a fraction of a cent per record; a damaged sending domain costs weeks of recovery.
- Are you handling catch-all domains correctly? Roughly 15-20% of B2B domains accept all mail, which makes standard verification return "unknown." Treating unknown as invalid throws away real prospects; treating it as valid inflates bounce rates. A dedicated catch-all verifier resolves the ambiguity instead of guessing.
- Do you have a second channel? Email-only sequences cap out. Pairing verified email with B2B phone numbers typically lifts connect rates on the same list, because the same person who ignores email answers a call about something they already read.
Channel mix. Outbound, inbound, partner, and community each have different cost-per-opportunity and different win rates downstream. Track win rate by source, not just volume by source. Plenty of teams discover their cheapest lead source has the worst close rate, which makes it the most expensive source once you account for rep time.
Is raising win rate better than adding more leads?#
Usually yes, and the math isn't close.
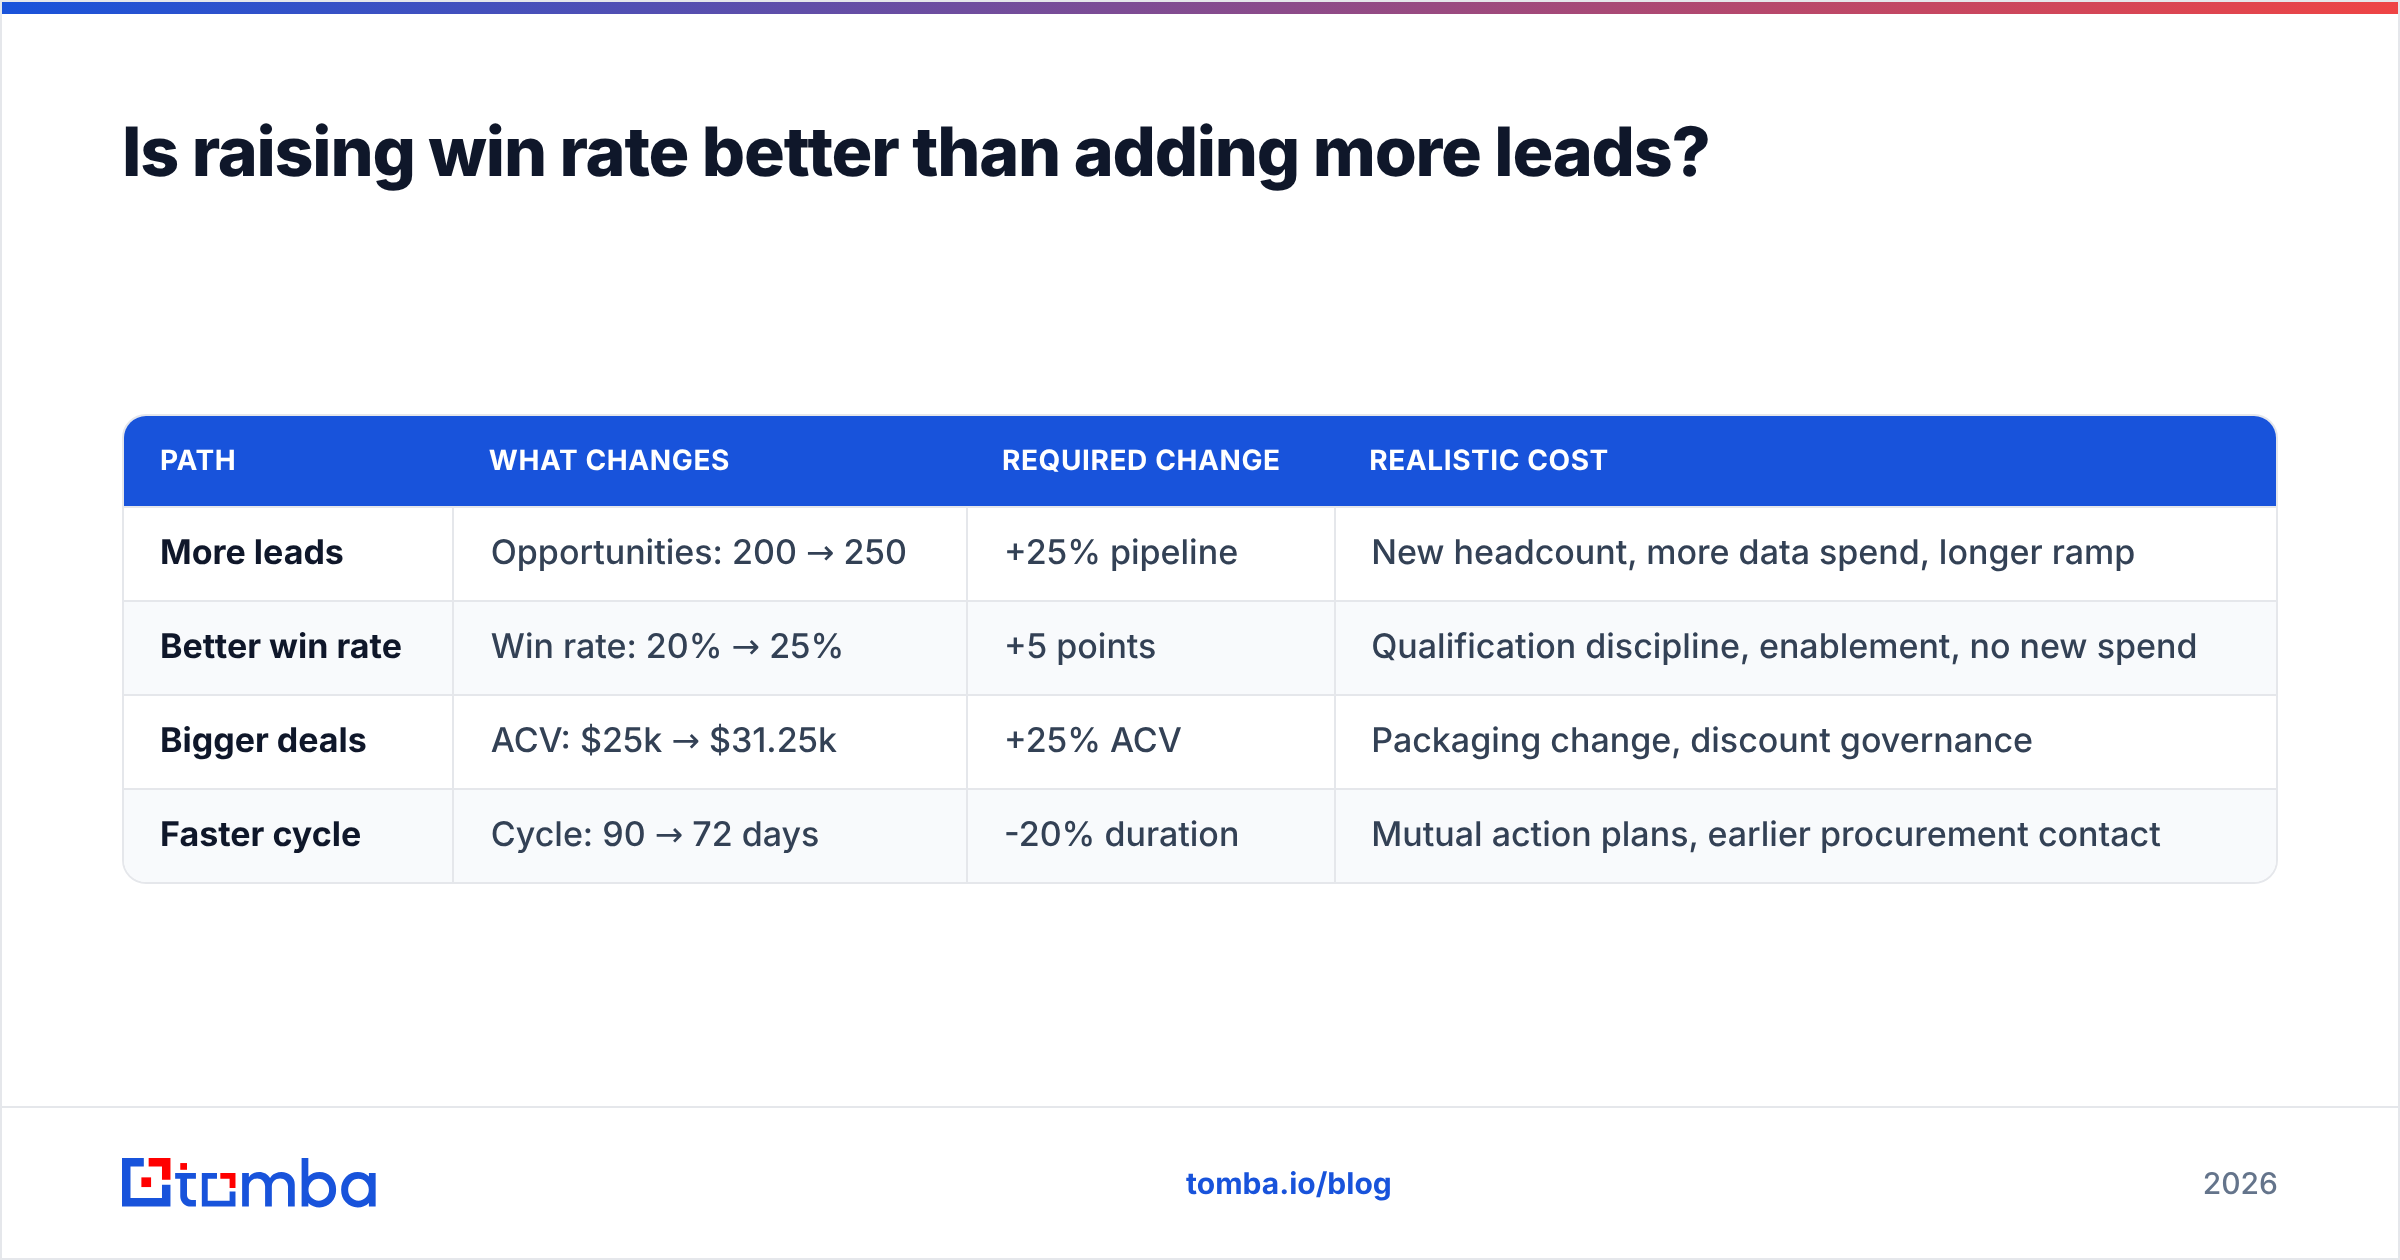
Take a team with 200 qualified opportunities per quarter, a 20% win rate, and a $25,000 ACV. That's $1M per quarter. Now compare two paths to $1.25M:
| Path | What changes | Required change | Realistic cost |
|---|---|---|---|
| More leads | Opportunities: 200 → 250 | +25% pipeline | New headcount, more data spend, longer ramp |
| Better win rate | Win rate: 20% → 25% | +5 points | Qualification discipline, enablement, no new spend |
| Bigger deals | ACV: $25k → $31.25k | +25% ACV | Packaging change, discount governance |
| Faster cycle | Cycle: 90 → 72 days | -20% duration | Mutual action plans, earlier procurement contact |
Adding 25% more pipeline means hiring, ramping, and spending — a two-quarter project with real cash outlay. Moving win rate five points is a process project you can start Monday. The three highest-yield win-rate interventions, in order:
- Enforce a disqualification bar. Reps who can't disqualify carry dead deals that inflate pipeline and destroy forecast accuracy. Require a documented answer to "what happens if they do nothing?" before an opp moves to stage two.
- Multi-thread every deal above a threshold. Single-threaded deals die when your champion changes jobs — which happens constantly. Two contacts minimum per opportunity above $10k, three above $50k. Use data enrichment to map the rest of the buying committee rather than asking your champion to introduce you and hoping.
- Fix the loss-reason taxonomy. "Price" is recorded as the loss reason in about half of all CRM entries and is almost never the real reason. Force a choice between: no budget, no urgency, lost to named competitor, no decision, wrong fit. Then read the distribution monthly. Patterns show up within a quarter.
For a deeper definition of the metric itself and how to segment it, see the win rate entry, and pair it with response rate at the top of funnel so you can see which stage is actually leaking.
How do you increase average deal size?#
Change what you sell and to whom — not what you charge for the same thing.
Sell higher. Deal size correlates more with buyer seniority than with negotiation skill. A director-level buyer approves director-level budgets. If your ACV is stuck, check the median title of your primary contact across closed-won deals. If it's manager-level, your ceiling is structural.
Package for expansion, not for the initial signature. Land-and-expand only works if the product has a natural second purchase. Seats, volume tiers, additional modules, and additional teams are all valid expansion vectors. If your product has none, expansion revenue will always be an uphill negotiation rather than a natural next step.
Govern discounting. Discount authority that sits with the rep produces predictable results: the discount becomes the close. Require approval above a threshold, and track discount depth by rep. According to research summarised across HubSpot's sales benchmark reporting, deals that involve heavy late-stage discounting also correlate with worse retention — you're buying a customer who joined for the price.
Bundle around the workflow, not the feature list. Buyers pay more for an outcome than for a capability. "Verified contact data flowing into your CRM automatically" prices higher than "email verification API," even when it's the same underlying work, because the first version absorbs the integration burden the buyer would otherwise carry.
What role does data quality play in revenue?#
It's a multiplier on every other lever, which makes it the highest-leverage unglamorous fix available.
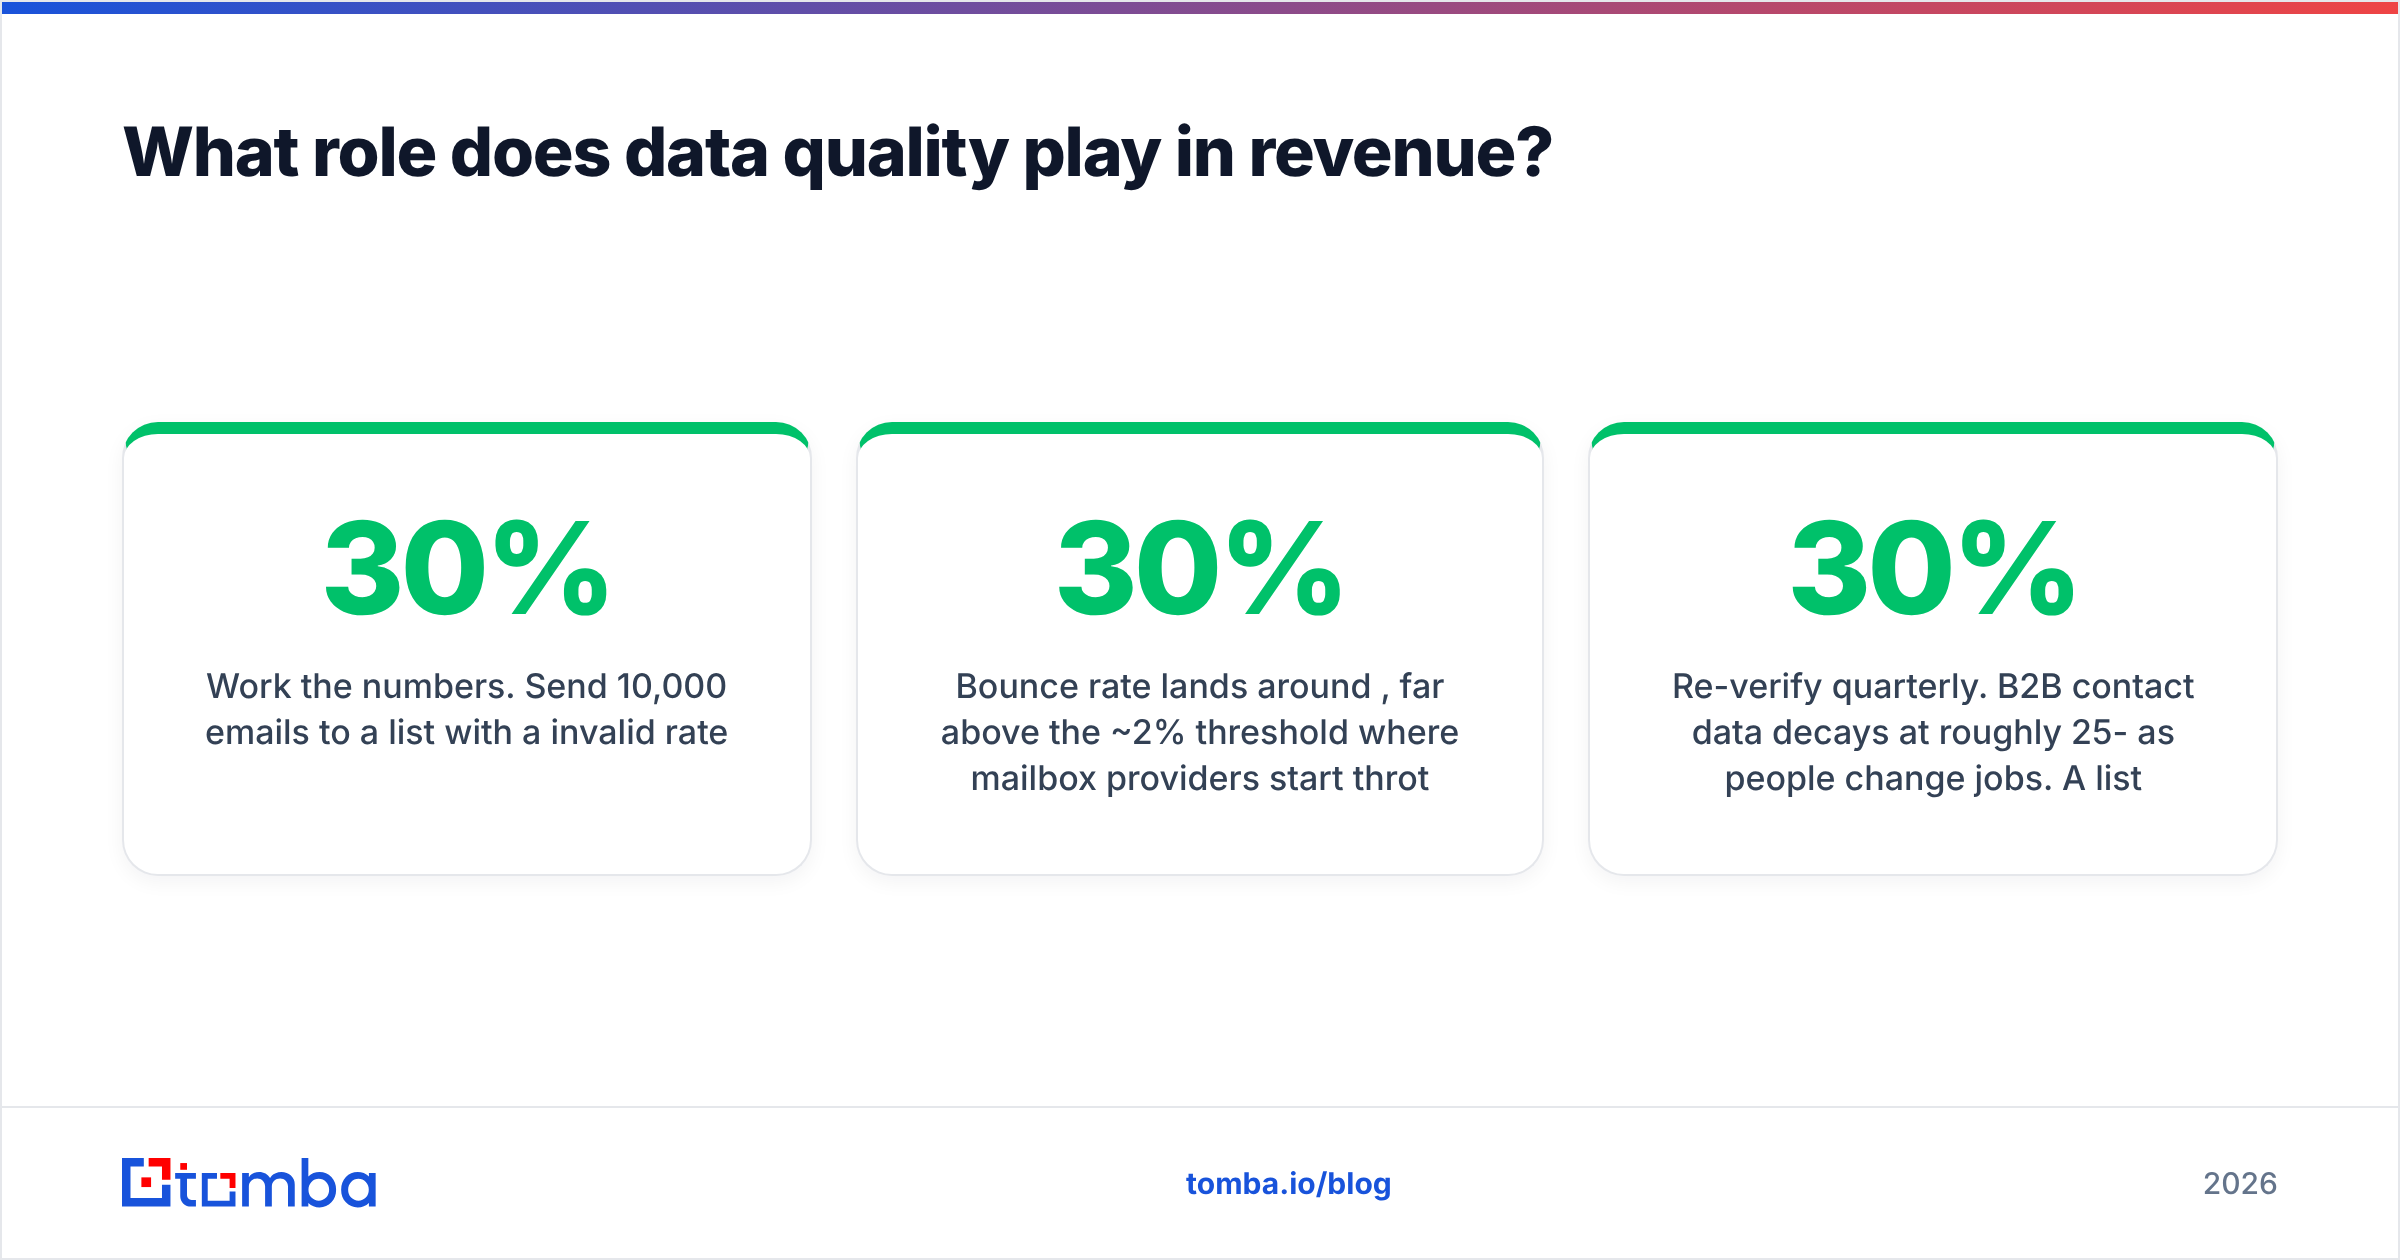
Work the numbers. Send 10,000 emails to a list with a 30% invalid rate:
- 3,000 hard bounce. Wasted send credits, wasted rep time on follow-up sequences aimed at nobody.
- Bounce rate lands around 30%, far above the ~2% threshold where mailbox providers start throttling. Your sender reputation drops.
- The 7,000 valid addresses now land in spam at a higher rate because the domain is flagged. You lose deliverability on the good half too.
- Forecast accuracy degrades, because pipeline built on unreachable contacts inflates stage-one counts.
One bad list poisons three quarters of work. This is why verification-before-send is not a nice-to-have — it's the precondition for every outbound number you report.

The operational fix is boring and effective:
- Verify at capture, not in batches. Every new record gets validated on entry.
- Re-verify quarterly. B2B contact data decays at roughly 25-30% per year as people change jobs. A list that was clean in January is measurably worse by October.
- Enrich rather than re-buy. If you have a name and a company, you don't need to purchase a new record — find email addresses against the data you already own, which is cheaper than another database subscription.
- Deduplicate before import. Duplicate records split activity history across two objects and make every conversion metric wrong.
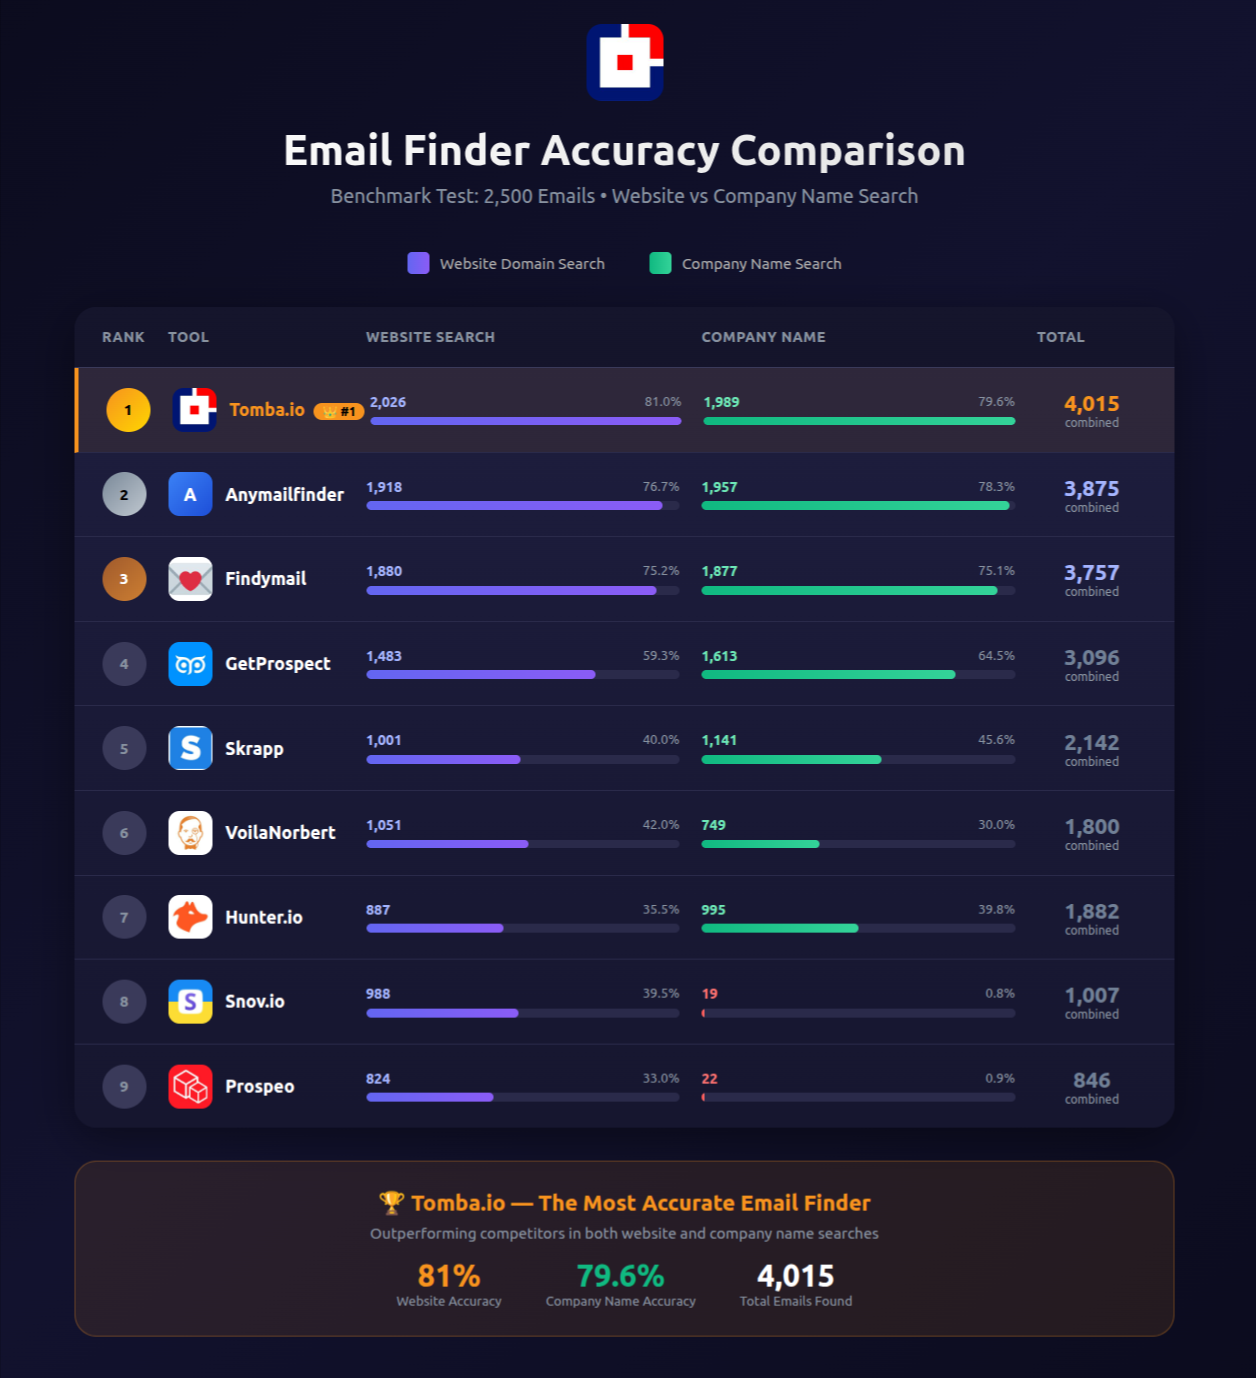
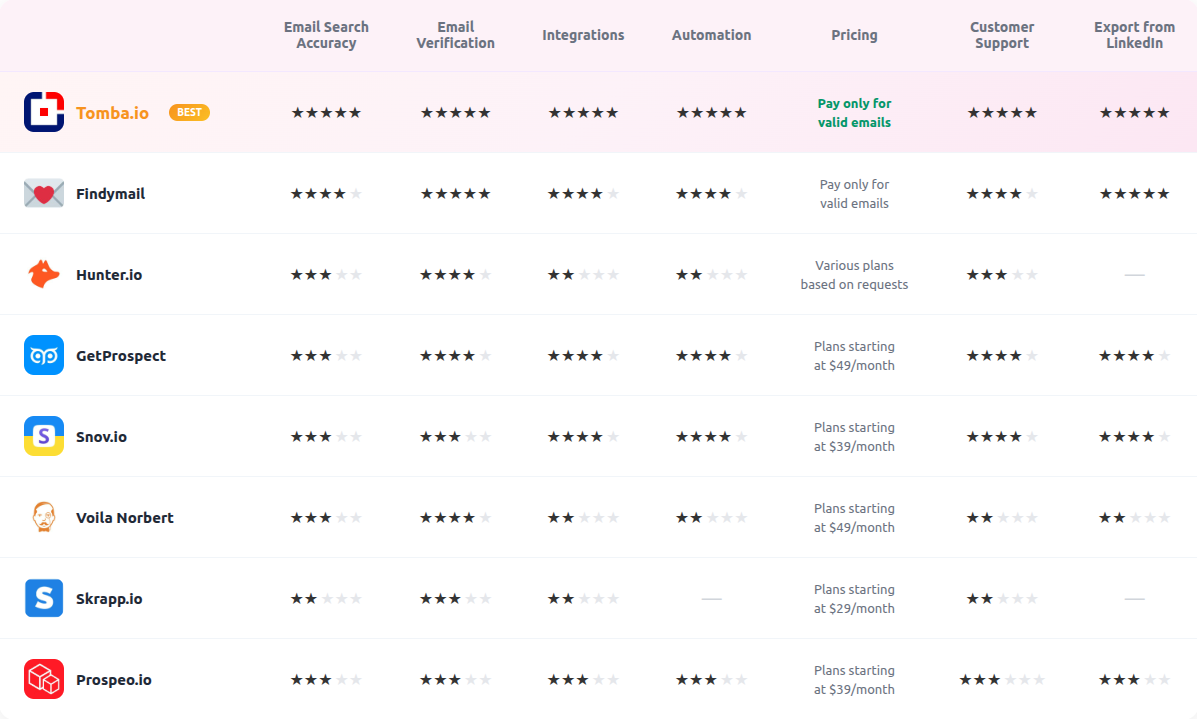
If you're evaluating providers on accuracy rather than list size, the comparison below is a reasonable starting point. Note that headline accuracy claims are usually measured on easy domains; ask any vendor for their catch-all and non-US performance specifically, since that's where the spread between tools is widest.
How should you compare tooling options?#
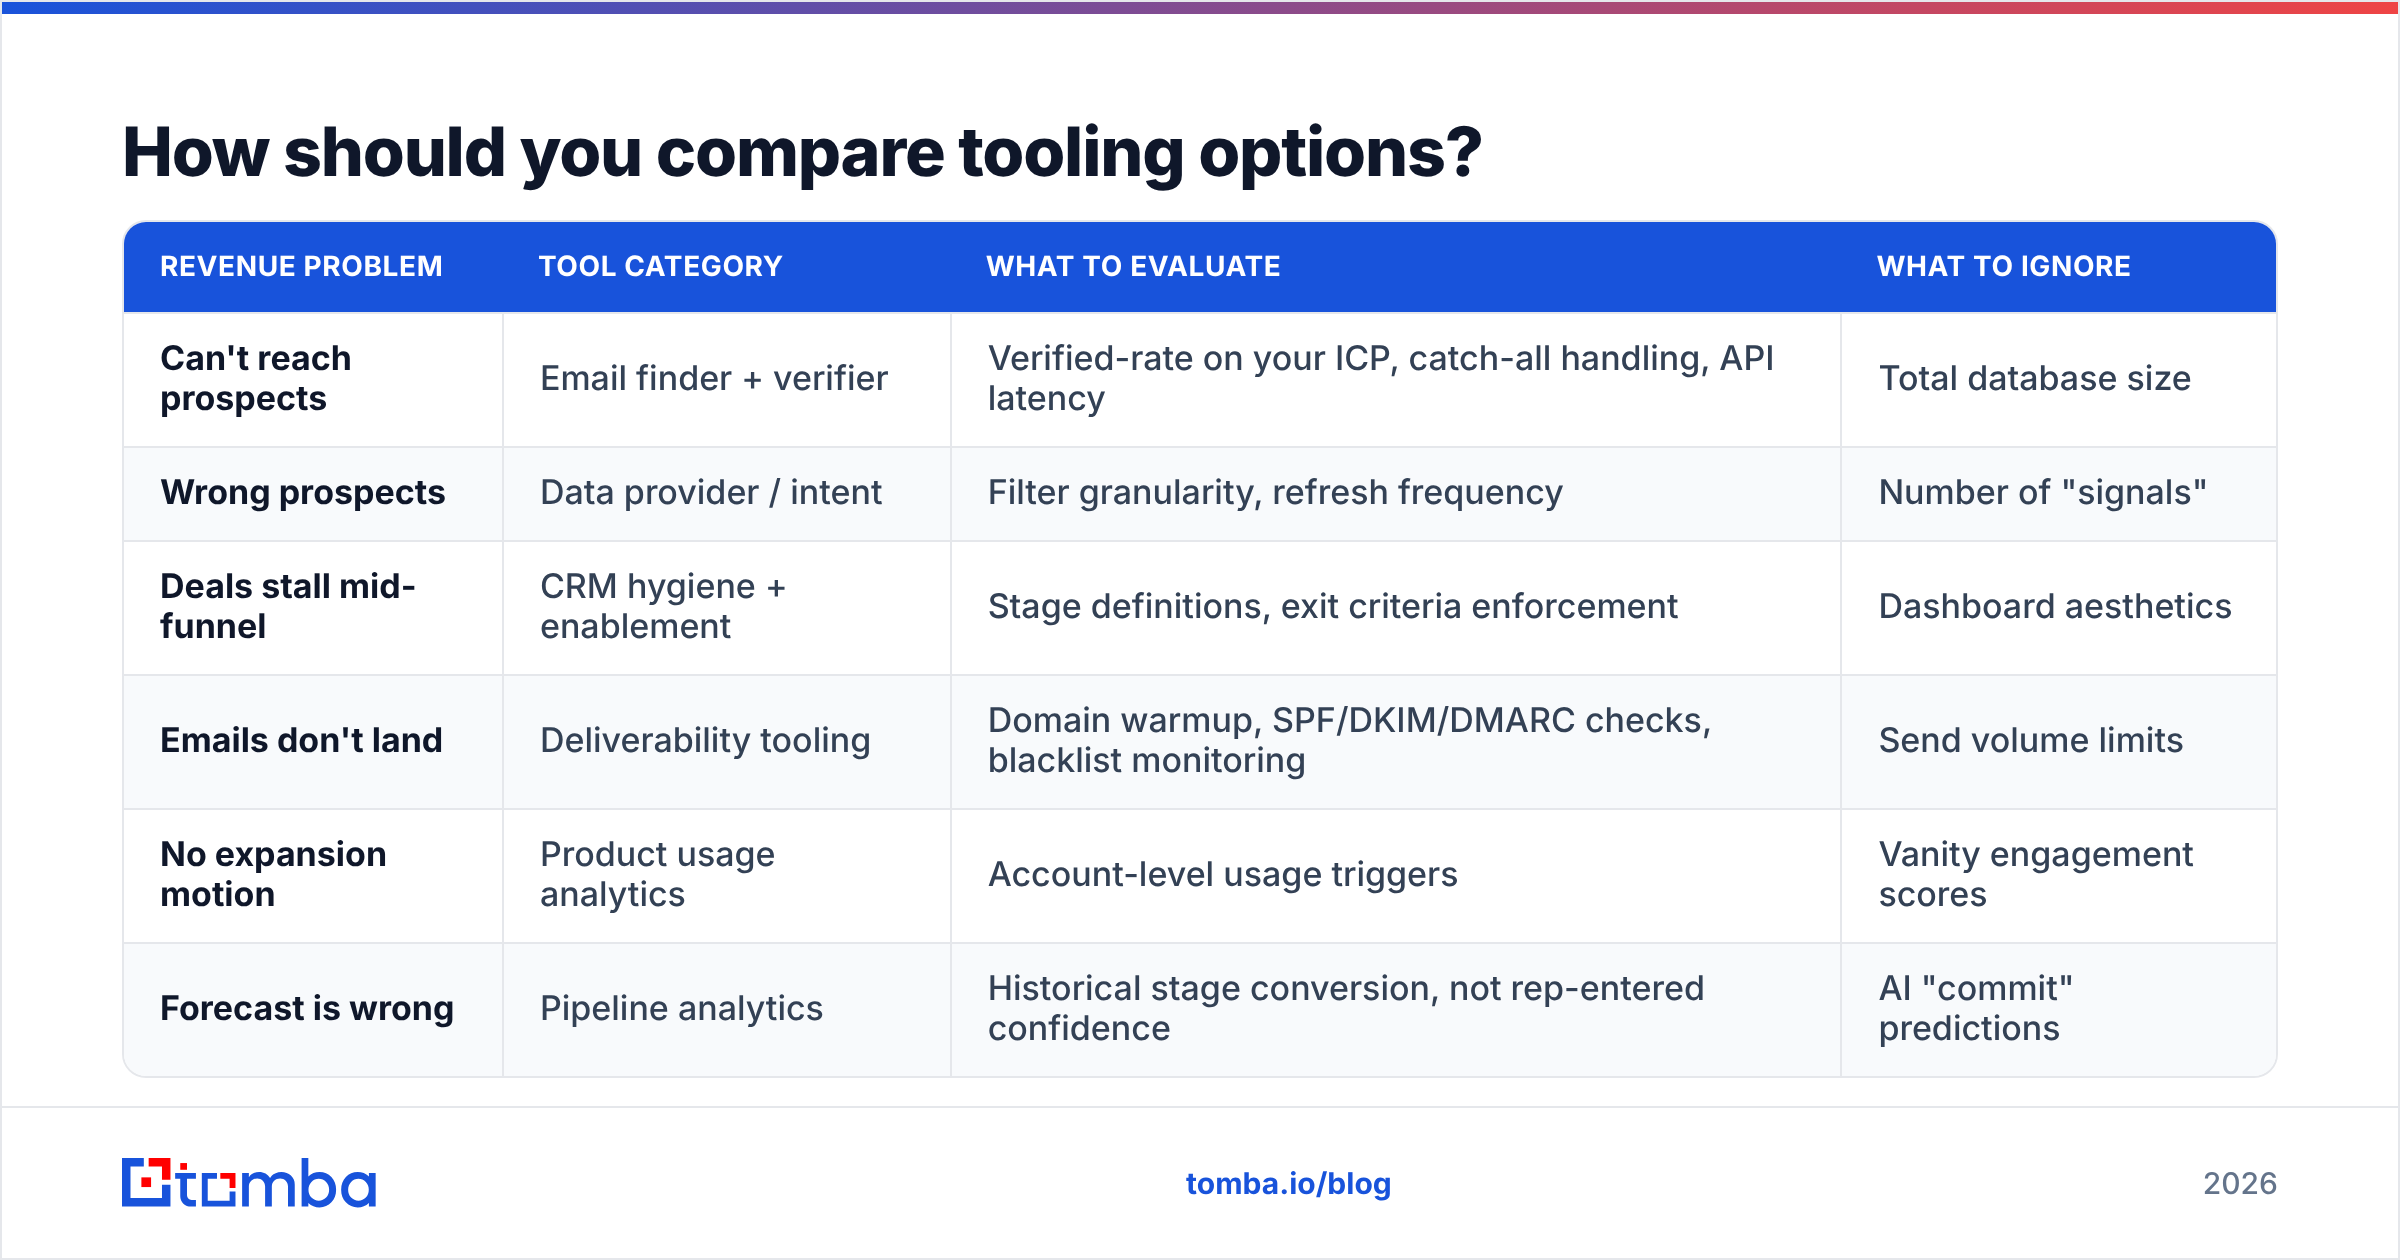
By where the leak is, not by feature count. Different revenue problems need different categories of tool, and buying the wrong category is how teams end up with nine subscriptions and a flat number.
| Revenue problem | Tool category | What to evaluate | What to ignore |
|---|---|---|---|
| Can't reach prospects | Email finder + verifier | Verified-rate on your ICP, catch-all handling, API latency | Total database size |
| Wrong prospects | Data provider / intent | Filter granularity, refresh frequency | Number of "signals" |
| Deals stall mid-funnel | CRM hygiene + enablement | Stage definitions, exit criteria enforcement | Dashboard aesthetics |
| Emails don't land | Deliverability tooling | Domain warmup, SPF/DKIM/DMARC checks, blacklist monitoring | Send volume limits |
| No expansion motion | Product usage analytics | Account-level usage triggers | Vanity engagement scores |
| Forecast is wrong | Pipeline analytics | Historical stage conversion, not rep-entered confidence | AI "commit" predictions |
A note on buying from list vendors versus finding tools: both are legitimate. If you need a large pre-built dataset with firmographic filters, a curated database provider like BookYourData gives you volume with known coverage — useful for broad campaigns where you're not targeting named accounts. If you're working named accounts and need the specific person on a specific team, a find-and-verify workflow is more accurate, because you're resolving one record at a time against live sources rather than reading from a snapshot. Most teams past Series A end up using both, and that's the right answer more often than picking a side.
Compare public review data before you commit — G2's lead intelligence category is more useful than vendor landing pages, mainly because the negative reviews tell you where the coverage gaps are. Also check whether the tool has a real Tomba API or equivalent, since anything you can't automate will decay into manual work within two quarters.
What does a 90-day revenue plan look like?#
Two levers, instrumented, with a kill date. Here's a template that survives contact with reality.
Days 1-14 — Instrument. Fix data hygiene first because it's fast and it makes every subsequent measurement trustworthy. Verify the existing database, set up verification at capture, establish baseline bounce rate. Pull four quarters of stage-conversion data and lock the baselines for win rate, ACV, and cycle length. Do not change process yet — you need a clean before-picture.
Days 15-45 — Run two interventions. Pick the two worst numbers from your diagnostic table. For most teams that's win rate and expansion. Implement the disqualification bar and multi-threading minimums for win rate. For expansion, build a simple usage-trigger list and assign it to named reps with a specific target. Two levers, no more — a third guarantees you won't be able to attribute the result.
Days 46-75 — Measure and adjust. Compare against locked baselines. Look for the shape of the change, not just direction: a win-rate lift that comes entirely from fewer opportunities entering the funnel is qualification discipline working correctly, not a fluke. A cycle-time drop concentrated in small deals means you improved SMB and learned nothing about enterprise.
Days 76-90 — Decide. Each intervention gets one of three verdicts: scale it, fix it, or kill it. "Give it another quarter" is not on the list — that's how organisations accumulate half-finished initiatives that consume attention forever. Then re-run the diagnostic and pick the next two levers.
The discipline that makes this work is refusing to add a fifth lever because someone in a meeting had a good idea. Good ideas are abundant. Attention isn't. If you want the wider framework for who owns which lever across marketing, sales, and CS, the revenue operations definition covers the ownership model.
What should you do this week?#
Start with the measurement that takes an afternoon and changes the most: find out how much of your contact database is actually reachable.
Run a sample of 500 records from your CRM through verification. If more than 10% come back invalid or unknown, you've found your first lever, and it's the cheapest one on the list. Everything downstream — win rate, cycle time, forecast accuracy — is being measured through a distorted lens until that's fixed.
Then fill the gaps rather than buying a new list. The Tomba Email Finder resolves verified professional email addresses from a name and domain, handles catch-all domains explicitly instead of returning a shrug, and runs through the API or a spreadsheet add-on so it fits whatever workflow you already have. The free tier covers 25 searches a month if you just want to test accuracy against contacts you can independently confirm; paid plans start at $49/month on Starter and scale to $99/month on Growth, with full Tomba pricing published rather than quote-gated. Verify a sample first, check it against records you already know are correct, and only then decide whether the accuracy holds up for your ICP.
Related guides#
// get started
Find, verify and enrich your first contacts today
Start on the free plan with 25 searches a month, then scale when your team is ready.
Free plan · No credit card required · GDPR & CCPA
Get the Tomba newsletter
Product and data updates
// about the author