Incremental Sales Definition: How to Measure Real Revenue Lift
Most teams report total sales and call it growth. Incremental sales strip out the revenue you would have earned anyway — here's the definition, the formula, and how to measure lift without lying to your board.
TL;DR
- Incremental sales are the revenue that would not have existed without a specific action — a campaign, a discount, a new channel, a rep. Total sales minus baseline sales equals incremental sales.
- The hard part is not the formula, it's the counterfactual: estimating what you would have sold anyway. Get the baseline wrong and every downstream number — ROAS, CAC, payback — is fiction.
- Holdout tests beat attribution models. A randomized control group is the only method that measures causation rather than correlation.
- Most reported "lift" is cannibalized, pulled-forward, or organic demand wearing a campaign badge. Discount promotions are the worst offenders.
- Clean contact data is upstream of all of it: if your test and control cells have different data quality, you measured your database, not your campaign.
What is the incremental sales definition?#
Incremental sales are the additional revenue generated by a specific initiative, above and beyond what you would have earned without it.
Think of it like a rain gauge in a garden that also has a sprinkler. The gauge shows two inches of water. That does not mean the rain delivered two inches — the sprinkler was running the whole time. Incremental measurement is the discipline of separating rain from sprinkler.
The formula is simple:
Incremental Sales = Total Sales During Period − Baseline Sales
Where baseline sales are what the same audience, in the same period, would have bought without the intervention. Everything difficult about incrementality lives inside that second term.
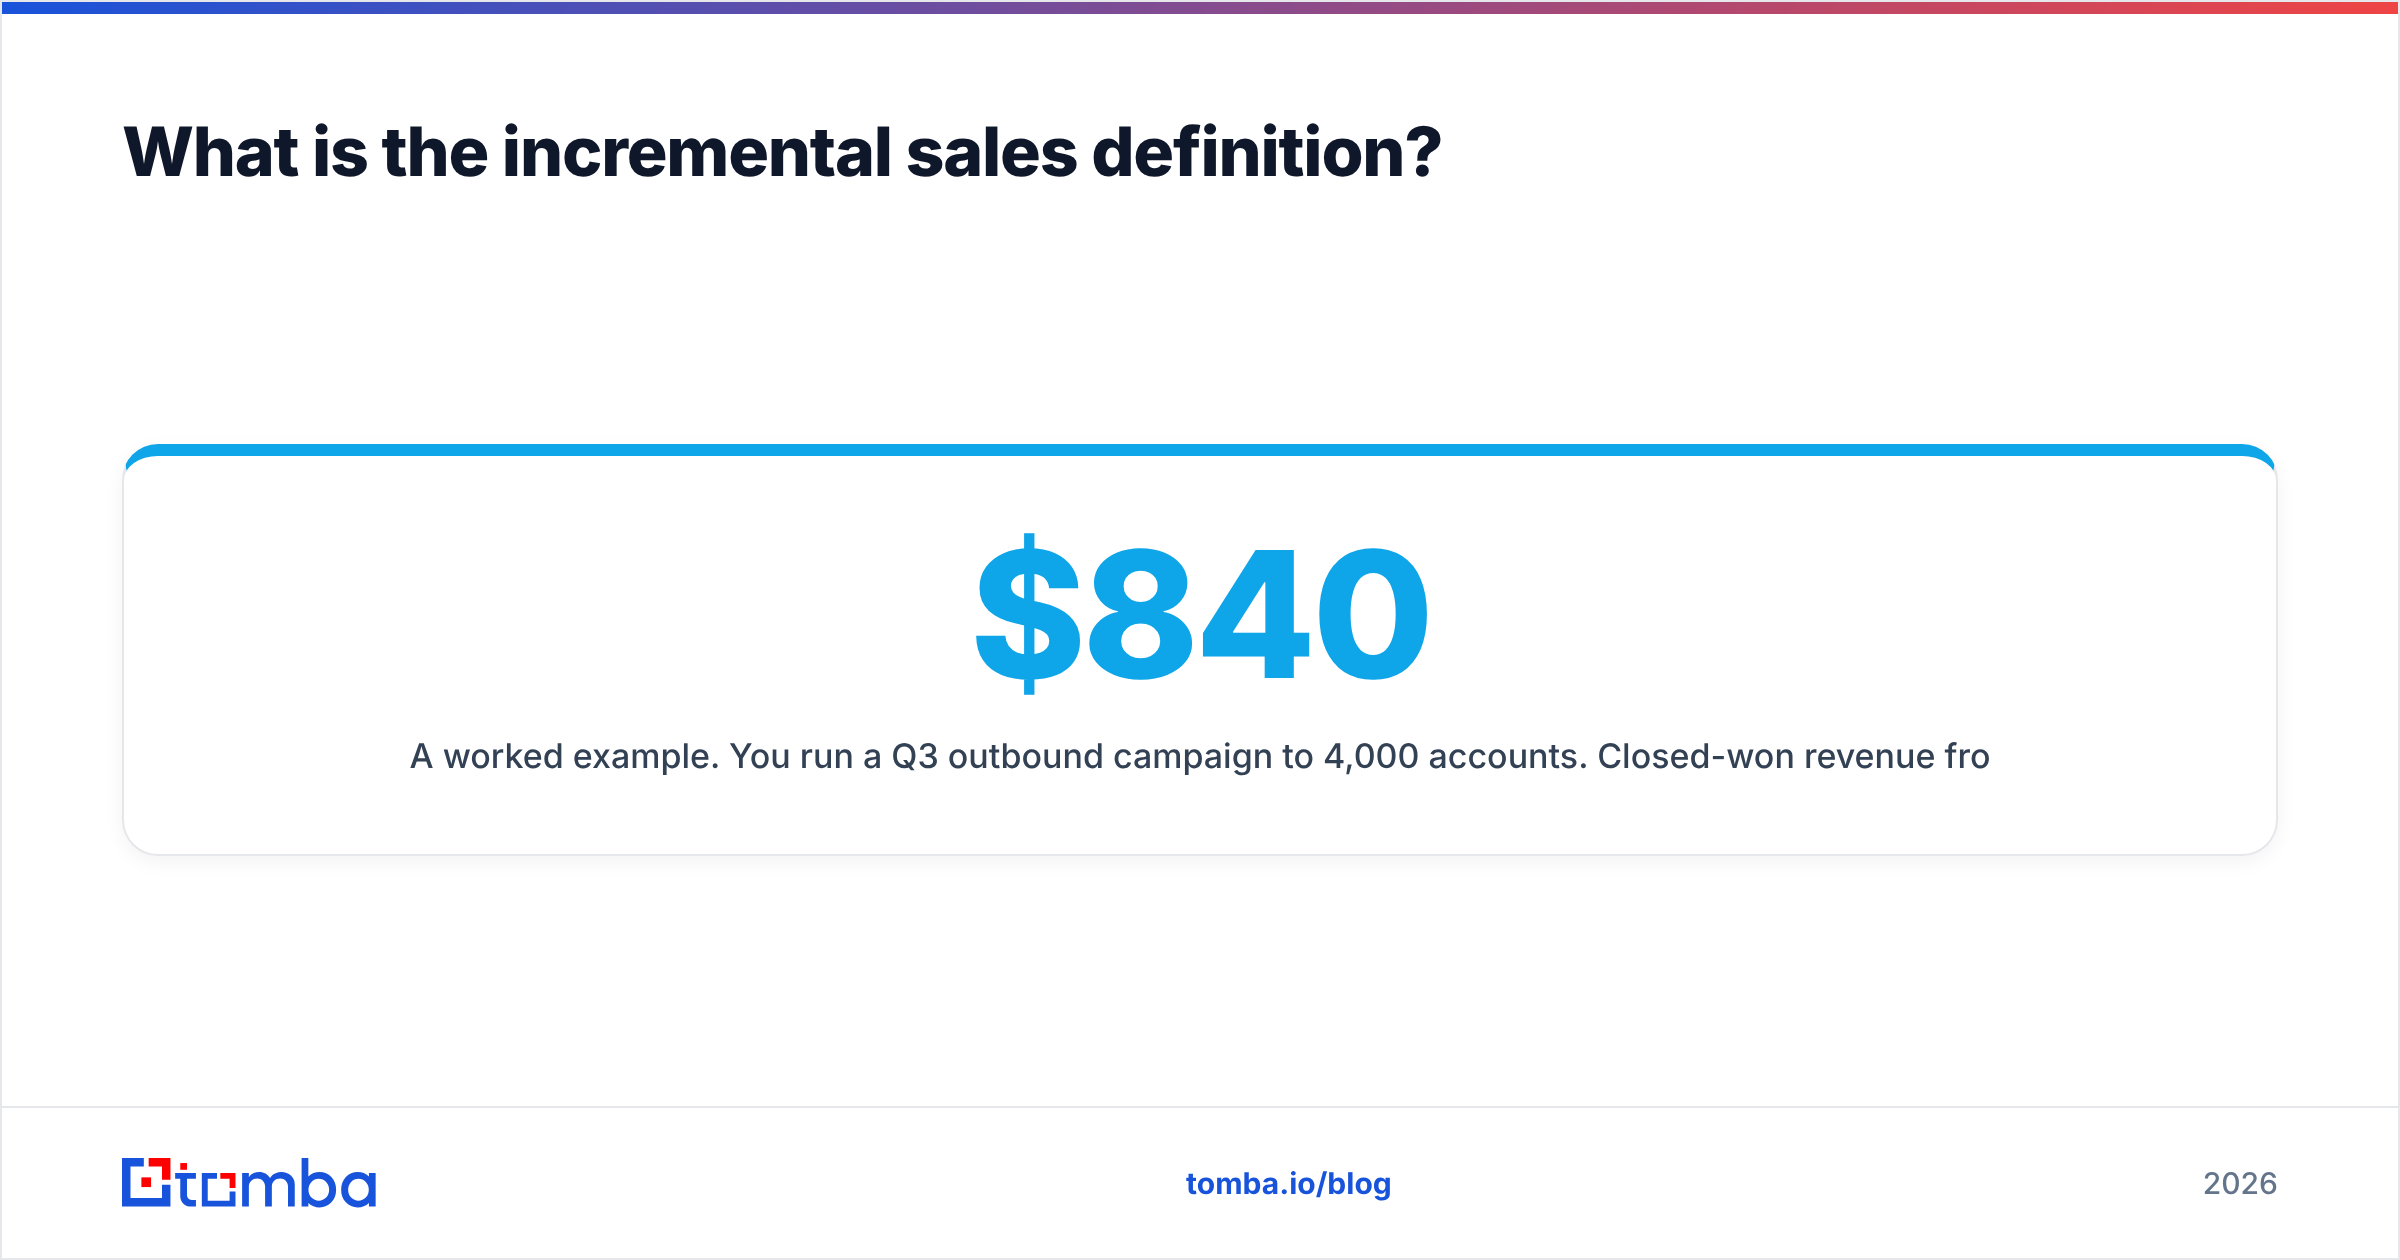
A worked example. You run a Q3 outbound campaign to 4,000 accounts. Closed-won revenue from those accounts is $840,000. Your finance team celebrates. But a matched set of 4,000 accounts you did not touch closed $520,000 in the same window through inbound, renewals, and referrals. Your incremental sales are $320,000 — not $840,000. Your true cost per incremental dollar just got 2.6x worse than the deck says.
That gap is where most GTM budgets quietly die.

Why do incremental sales matter more than total sales?#
Because total sales reward you for demand you did not create.
Four concrete consequences of confusing the two:
- Budget misallocation. Retargeting your existing pipeline looks like the highest-ROAS channel in every dashboard, because it intercepts buyers who were already converting. Kill the channel in a holdout test and revenue often barely moves.
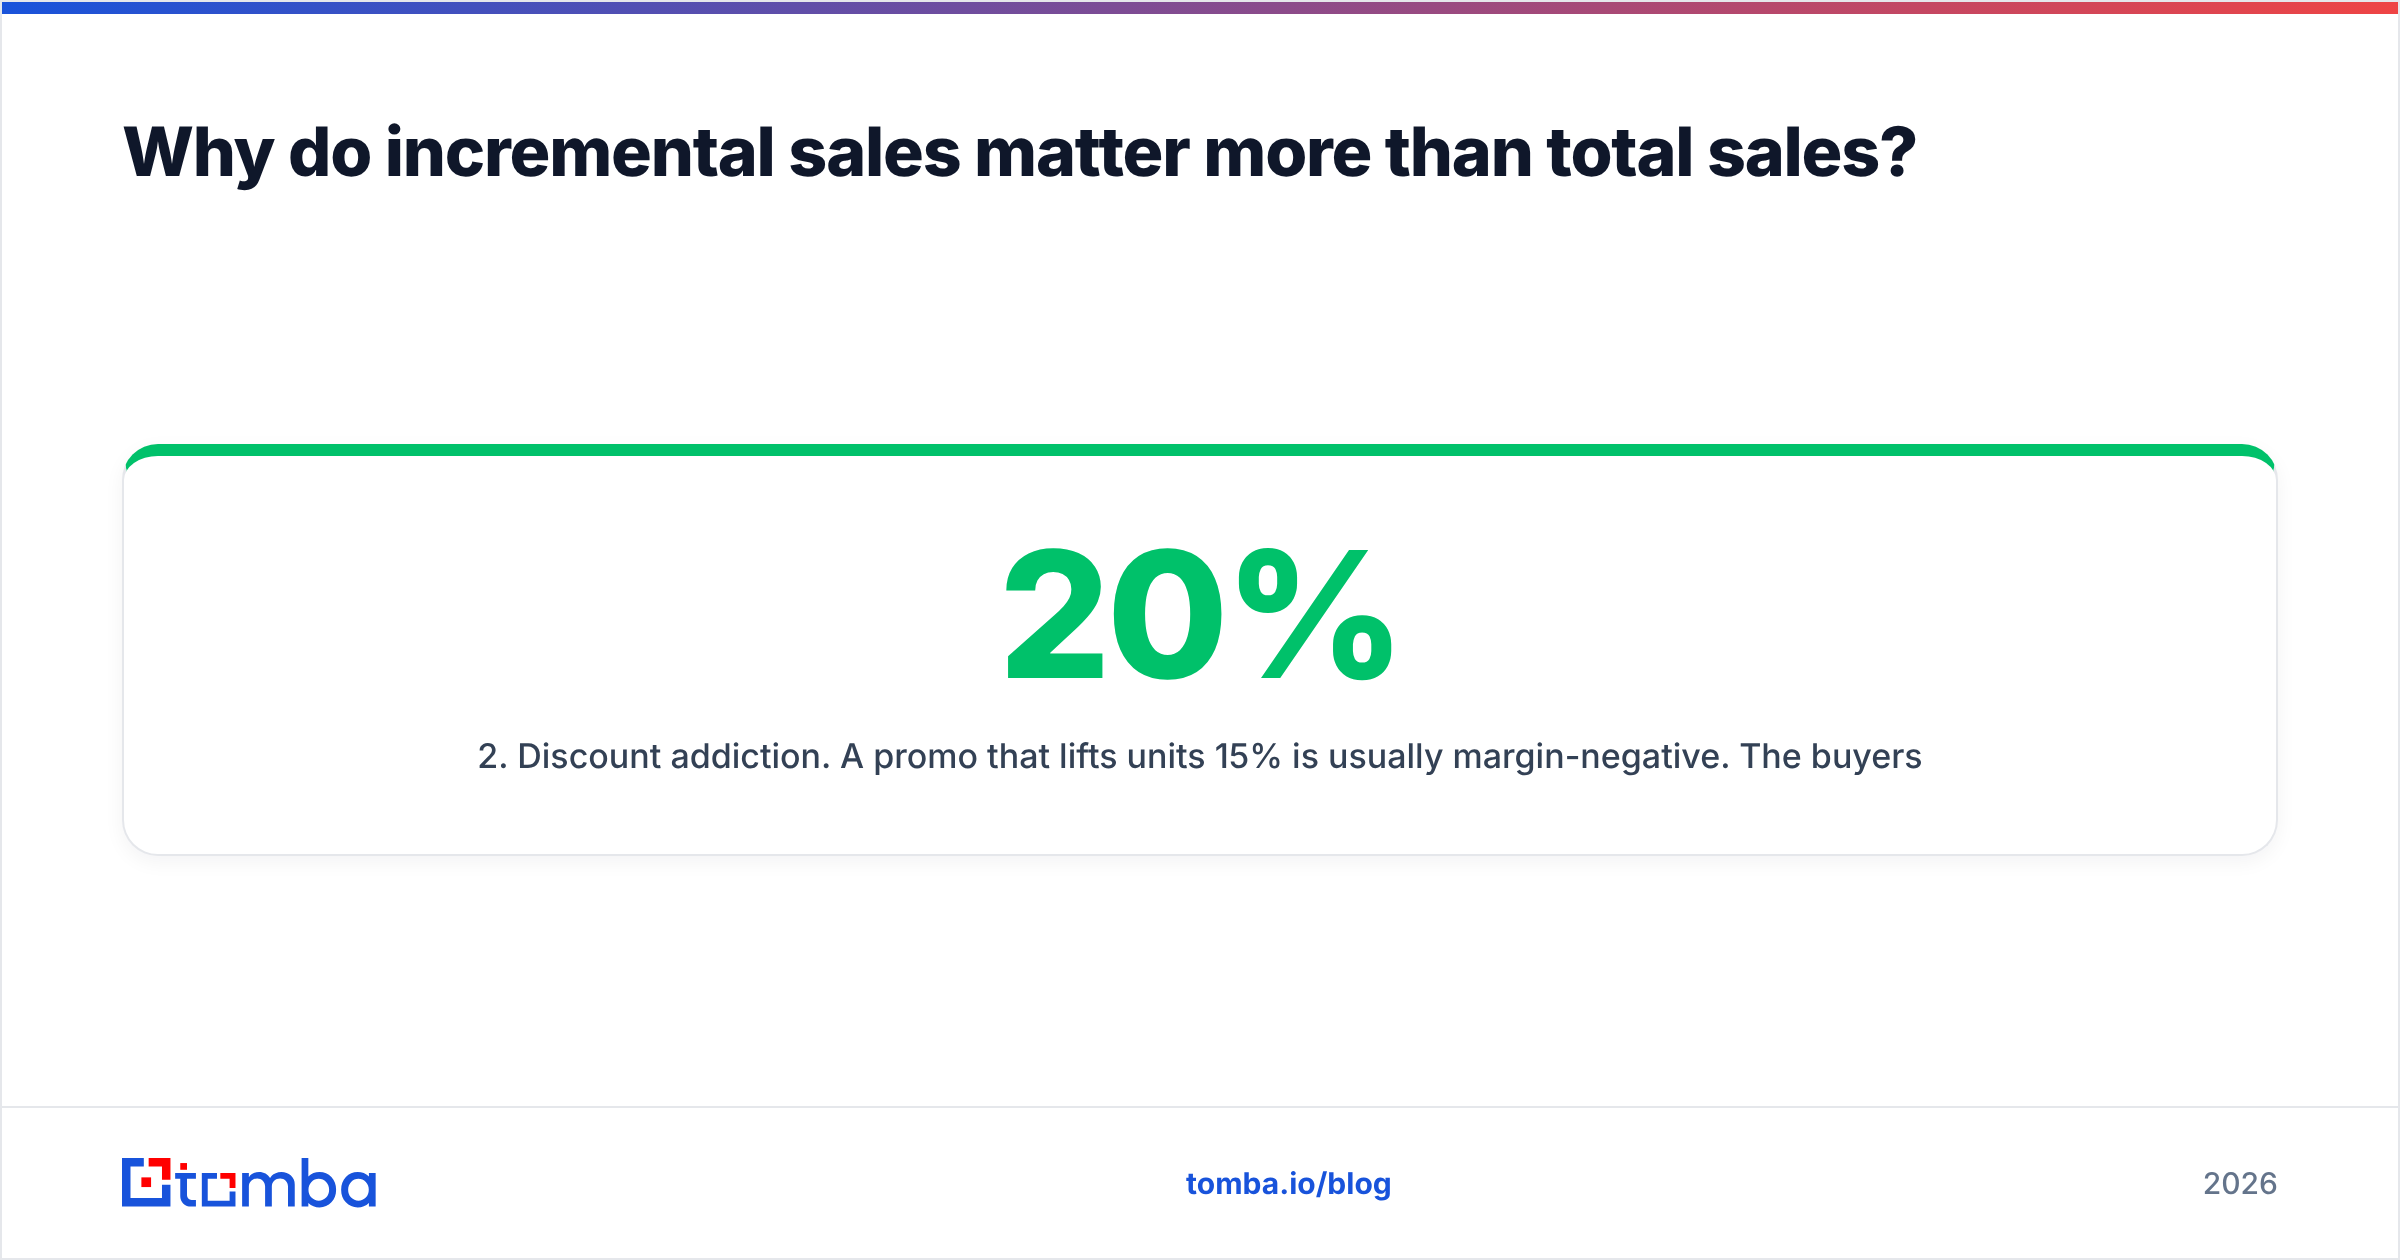
- Discount addiction. A 20% promo that lifts units 15% is usually margin-negative. The buyers who would have paid full price now pay 80%, and that subsidy is invisible in a total-sales report.
- False rep performance signals. A rep working a warm territory posts bigger numbers than a rep opening a cold vertical. Without a baseline adjustment, you promote the territory, not the seller.
- Board credibility risk. When a CFO models revenue and the marketing-attributed number exceeds actual company revenue — a common outcome with multi-touch attribution — every subsequent forecast gets discounted.
Forrester and Gartner have both pushed B2B teams toward incrementality testing over last-touch reporting for exactly this reason: attribution answers "who was nearby when the sale happened," incrementality answers "did this cause the sale."
How do you calculate incremental sales?#
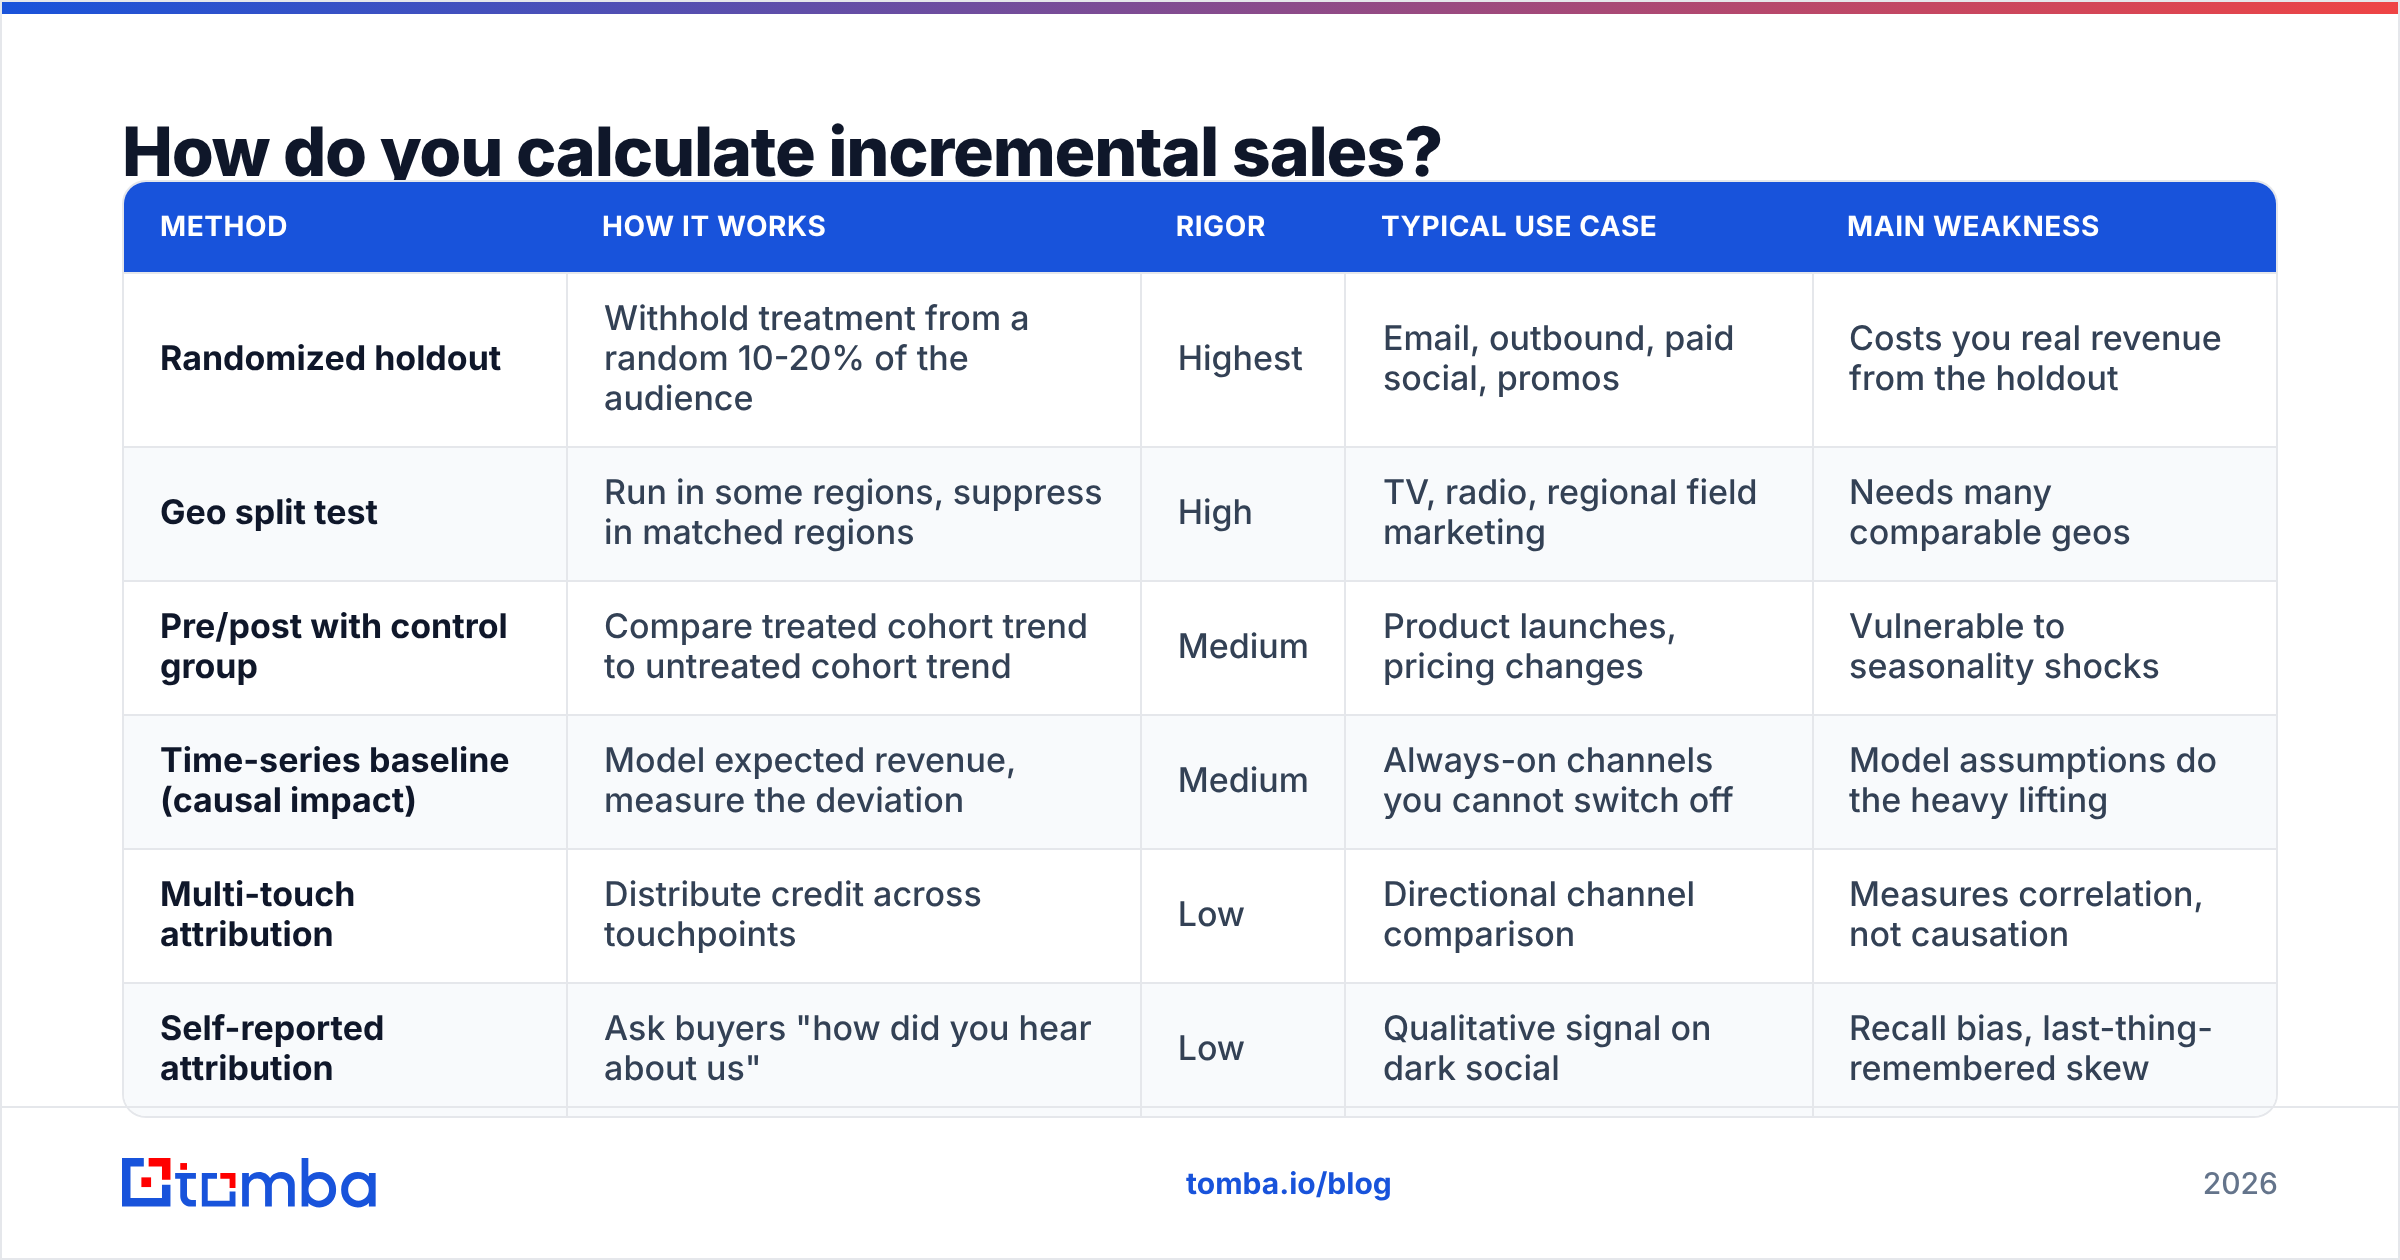
Pick a method based on how much control you have over who receives the treatment. Each trades rigor for feasibility.
| Method | How it works | Rigor | Typical use case | Main weakness |
|---|---|---|---|---|
| Randomized holdout | Withhold treatment from a random 10-20% of the audience | Highest | Email, outbound, paid social, promos | Costs you real revenue from the holdout |
| Geo split test | Run in some regions, suppress in matched regions | High | TV, radio, regional field marketing | Needs many comparable geos |
| Pre/post with control group | Compare treated cohort trend to untreated cohort trend | Medium | Product launches, pricing changes | Vulnerable to seasonality shocks |
| Time-series baseline (causal impact) | Model expected revenue, measure the deviation | Medium | Always-on channels you cannot switch off | Model assumptions do the heavy lifting |
| Multi-touch attribution | Distribute credit across touchpoints | Low | Directional channel comparison | Measures correlation, not causation |
| Self-reported attribution | Ask buyers "how did you hear about us" | Low | Qualitative signal on dark social | Recall bias, last-thing-remembered skew |
The practical rule: use the most rigorous method your operating constraints allow, and label the rest as directional. A geo test you actually run beats a randomized design you keep postponing.
The five steps of a clean incrementality test#
- Define the unit. Account, contact, geo, or store. Mixing units mid-test invalidates the read.
- Randomize, don't cherry-pick. If the holdout is "accounts the reps didn't get to," you have selection bias, not a control group.
- Size for the effect you expect. Detecting a 5% lift in a 3%-conversion population needs tens of thousands of units. Detecting a 40% lift needs far fewer. Run the power calculation before, not after.
- Pre-register the metric and the window. Closed-won revenue at 90 days, decided upfront. Choosing the metric after seeing the data is how 8% lifts become 38% lifts.
- Measure net, not gross. Subtract cannibalization from other channels and margin given away in discounts.
What makes baseline sales so hard to estimate?#
Four forces corrupt the counterfactual, and they all push reported lift upward.
Cannibalization. Your new channel converts buyers who would have arrived through an existing one. Channel-level reports show two wins; company revenue shows one. In B2B this is rampant between outbound SDR motions and inbound demo requests targeting the same account list.
Pull-forward. A deadline promo compresses six weeks of demand into one. Week one looks spectacular, weeks two through six sag, and quarterly incrementality is near zero. Always extend the measurement window past the promo period.
Organic drift. Brand demand, category growth, and seasonality all move the baseline. A campaign launched in your strongest quarter inherits that tailwind unless the control group experiences it too.
Data quality asymmetry. This one is underrated. If your treated list was enriched and verified while the holdout was raw exported CSV rows, you are measuring deliverability, not the campaign. Run both cells through the same email verifier and the same data enrichment pipeline before the split, or the test is unusable.

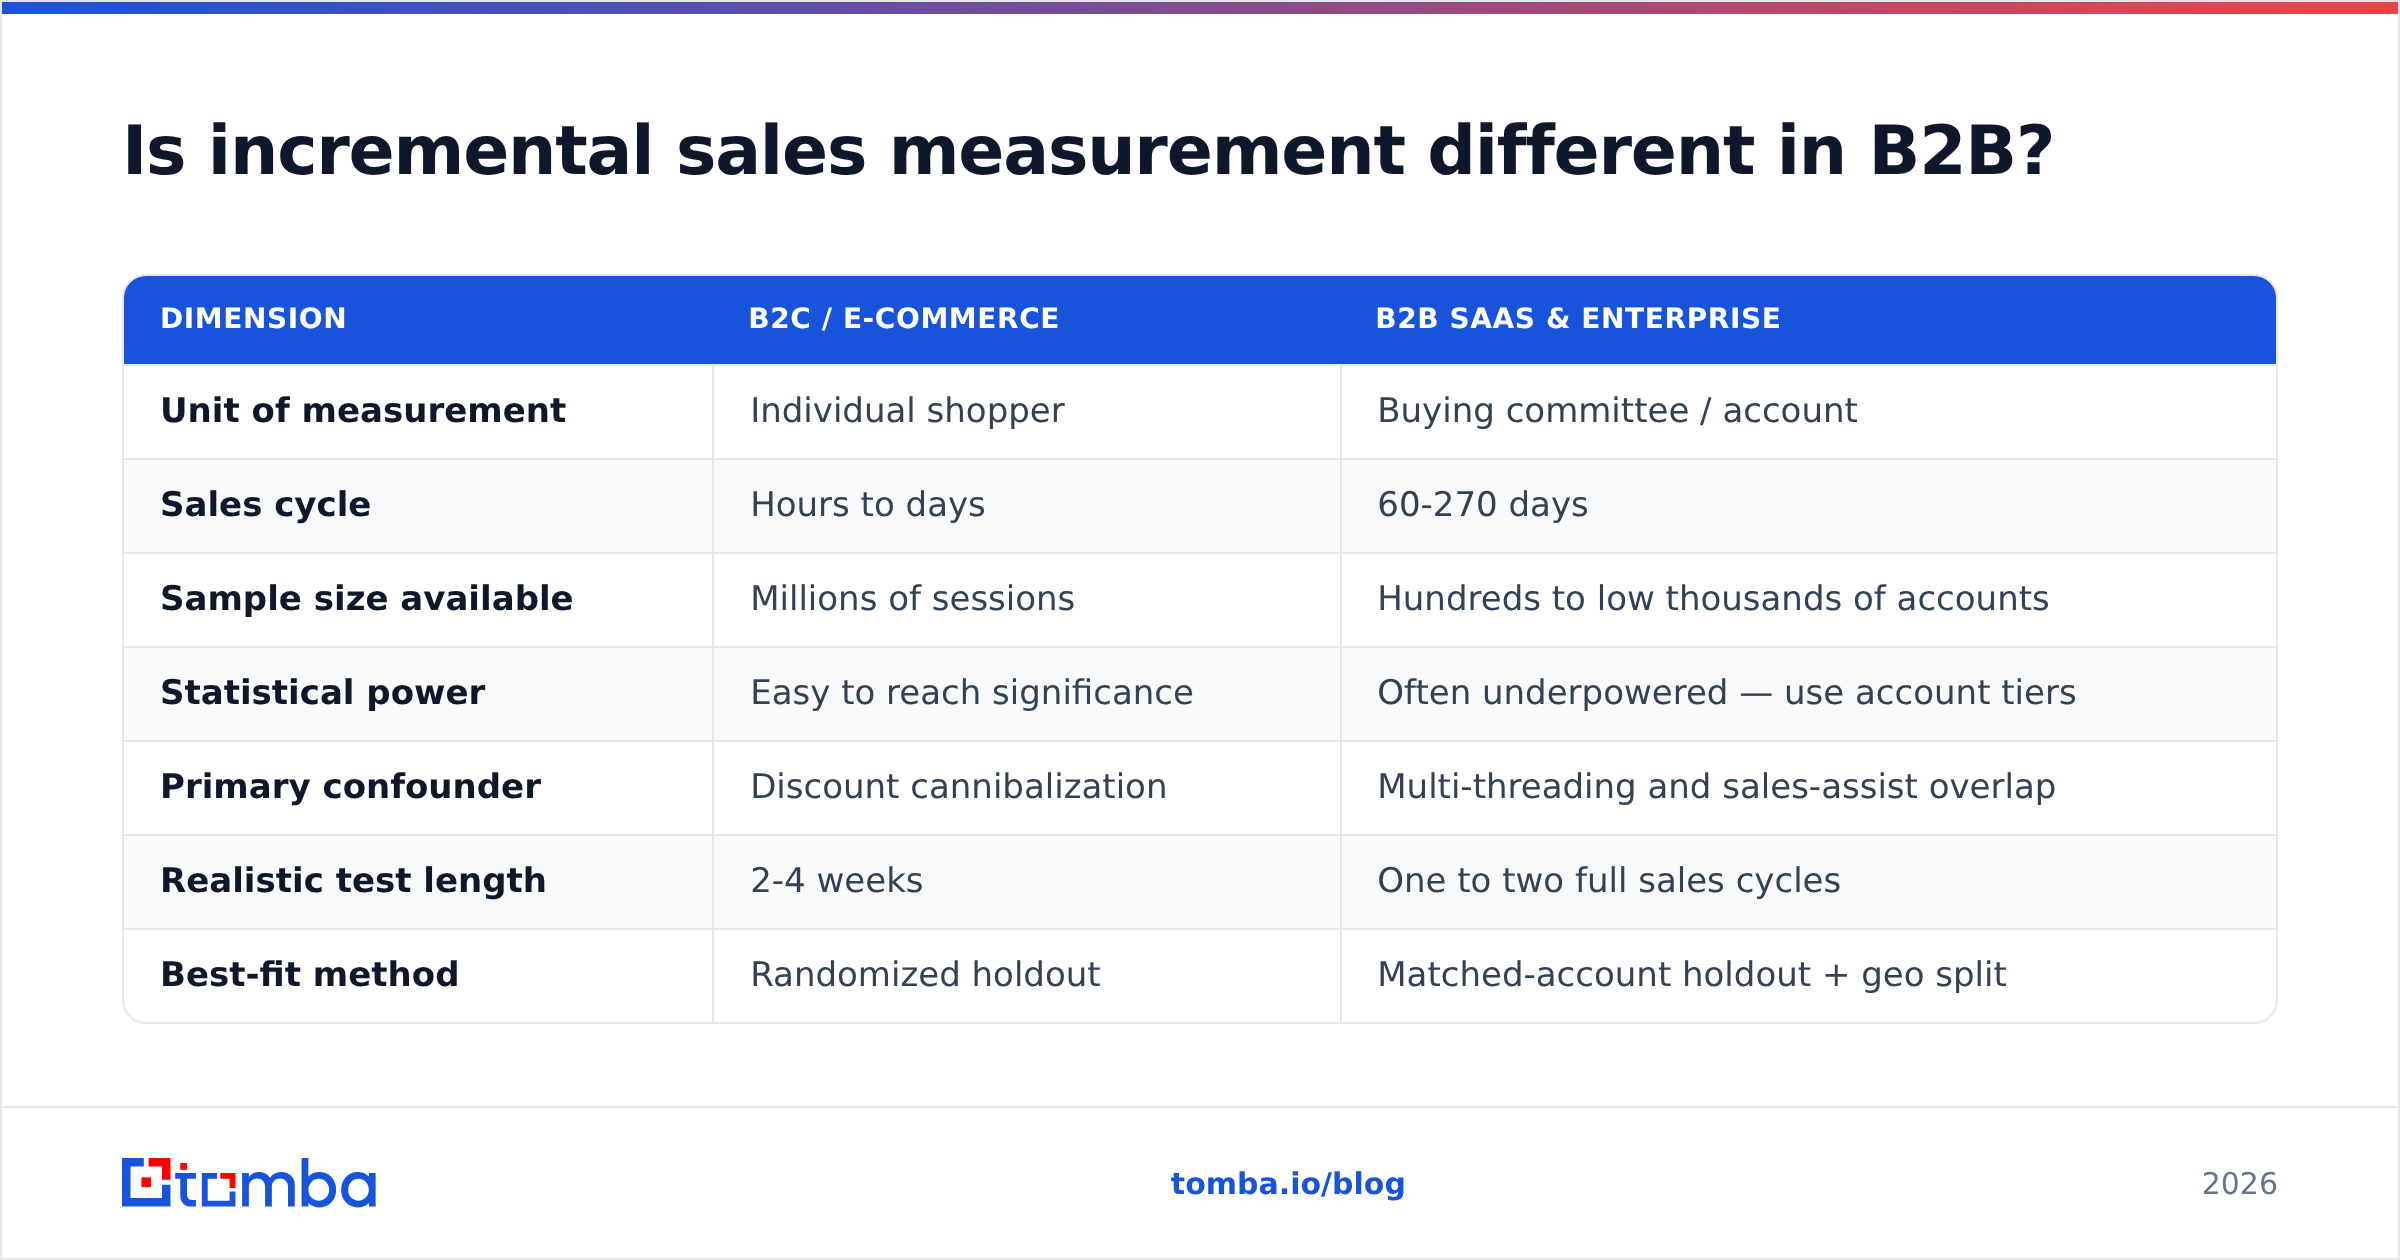
Is incremental sales measurement different in B2B?#
Yes, and the differences are structural rather than cosmetic.
| Dimension | B2C / e-commerce | B2B SaaS & enterprise |
|---|---|---|
| Unit of measurement | Individual shopper | Buying committee / account |
| Sales cycle | Hours to days | 60-270 days |
| Sample size available | Millions of sessions | Hundreds to low thousands of accounts |
| Statistical power | Easy to reach significance | Often underpowered — use account tiers |
| Primary confounder | Discount cannibalization | Multi-threading and sales-assist overlap |
| Realistic test length | 2-4 weeks | One to two full sales cycles |
| Best-fit method | Randomized holdout | Matched-account holdout + geo split |
The B2B adaptation that actually works: stratify before you randomize. Bucket accounts by tier, industry, and employee count, then randomize within each bucket. This removes most of the variance that would otherwise swamp a small sample. It is the same logic as blocking in agricultural field trials — control for the soil before you compare the fertilizer.
The second adaptation: measure pipeline-stage progression, not just closed-won, as an early indicator. If treated accounts create SQLs at 1.8x the control rate at day 30, you have a real signal months before revenue lands. Just don't report the leading indicator as the final result.
What tooling do you need to run incrementality tests?#
Less than vendors want you to believe. You need four things: a clean account list, a random assignment mechanism, a suppression capability in your execution channel, and a warehouse or CRM field that records cell membership permanently.
The failure point is almost always the first and last items.
On list quality: an incrementality test compares two populations. If one has 12% bounced contacts and the other has 4%, the comparison is broken before a single email sends. Standardize the input. Build both cells from the same source — a domain search pass across target companies, a bulk verification sweep, then randomize. Teams pulling from a maintained B2B database with consistent refresh cadence get cleaner reads than teams stitching together three scraped exports.
On cell membership: write the test cell to a permanent CRM field at assignment time, not at analysis time. Reconstructing "who was in the holdout" from campaign logs six months later is how tests quietly become anecdotes. HubSpot and Salesforce both support custom fields for this; the discipline is organizational, not technical.
For teams running tests programmatically, an email finder API that returns confidence scores lets you match cells on data-quality percentile, not just firmographics — a refinement that measurably tightens variance on small B2B samples.
What are the most common incrementality mistakes?#
- Declaring victory on a 3% lift with n=400. That result is noise. Report the confidence interval or don't report at all.
- Peeking and stopping early. Checking daily and stopping when the p-value dips below 0.05 inflates false positives dramatically. Fix the end date in advance.
- Ignoring the holdout's cost. A 20% holdout on a $10M channel means forgoing real revenue. Budget for it explicitly and shrink the holdout once the effect size is known.
- Testing during an anomaly. Product launches, outages, competitor news, and holiday periods contaminate both cells unevenly.
- Measuring the wrong horizon. A 30-day window on a 120-day sales cycle measures enthusiasm, not revenue.
- Confusing incremental revenue with incremental profit. Subtract COGS, discounts, and delivery cost. A channel can be revenue-incremental and margin-destructive at the same time.
One more, specific to outbound: do not let reps see the holdout list. If SDRs know which accounts are excluded, some will work them anyway. Suppress at the system level, and audit dial and send logs against the holdout roster after the fact.
How do you report incremental sales to leadership?#
Report three numbers together, always: total revenue, estimated baseline, and incremental lift with a confidence interval. A single "campaign drove $840K" line invites the wrong decision.
A defensible reporting line looks like this: "Treated accounts generated $840K; matched control generated $520K. Incremental revenue is $320K ±$74K at 90% confidence. Program cost was $95K, so cost per incremental dollar is $0.30. Method: stratified holdout, n=8,000 accounts, 90-day window, pre-registered metric."
That paragraph survives CFO scrutiny. "Marketing-influenced pipeline of $4.2M" does not.
Also publish your negative results. A channel that tested flat is a genuine finding worth six figures in reallocated budget. Teams that only surface winning tests train themselves to run tests they already know the answer to, which defeats the purpose.
Where does incrementality fit into your RevOps stack?#
It belongs alongside forecasting and pipeline hygiene as a standing revenue operations function — not a one-off marketing project. Practical cadence for most mid-market teams:
- Quarterly: one major channel holdout, rotating across paid, outbound, and lifecycle.
- Monthly: a discount or offer test on a single segment.
- Always-on: a permanent 5% global holdout that receives no marketing, giving you a rolling read on total marketing incrementality.
That permanent holdout is the highest-leverage item on the list and the one most teams skip. It costs a small slice of revenue and buys you a defensible answer to the question every CFO eventually asks: what happens if we cut marketing spend in half?
Getting started without breaking your pipeline#
Start with one channel, one segment, one 90-day window, and a 10% holdout. Write down the hypothesis and the success threshold before launch. Run it to completion even if the early read looks bad.
The prerequisite is a target list you trust on both sides of the split. If half your contacts bounce, you measured your data vendor, not your campaign.
Tomba's Email Finder gives you that foundation — verified professional email addresses sourced by domain, name, or company, with confidence scores you can match on when building test and control cells. The free tier includes 25 searches per month, and paid plans start at $49/mo (Starter), $99/mo (Growth), and $249/mo (Pro); full Tomba pricing is public. Build both cells from the same verified source, randomize inside strata, and for the first time your lift number will mean something.
Related guides#
// get started
Find, verify and enrich your first contacts today
Start on the free plan with 25 searches a month, then scale when your team is ready.
Free plan · No credit card required · GDPR & CCPA
// about the author