Internal QBR: How to Run One That Actually Changes Behavior
Most internal QBRs are 60 slides of backward-looking noise. Here's the agenda, data model, and follow-through system that turns a quarterly business review into decisions your team acts on.
TL;DR
- An internal QBR is a quarterly working session where a go-to-market team reviews what happened, decides what changes, and commits to owners and dates. It is not a status report with a deck attached.
- The failure mode is universal: 80% of the time goes to backward-looking narration, 20% to decisions. Flip that ratio and the meeting starts paying for itself.
- Cap it at three hours, three decisions, and one page of pre-read data circulated 48 hours early. Anything more gets skimmed.
- Your QBR is only as honest as your CRM. If contact data is 30% stale, every conversion rate you debate is fiction.
- The follow-through beats the meeting. Assign a single owner per decision, a check-in date at week 6, and kill anything with no owner.
What is an internal QBR?#
An internal QBR (quarterly business review) is a recurring meeting where a company's own team — usually sales, marketing, customer success, and RevOps — reviews the last quarter's performance and decides what to change in the next one. The "internal" qualifier matters because the term is overloaded. A customer QBR is a meeting you run with an account to justify renewal. An internal QBR is a meeting you run on yourself.
Think of it like a pit stop in motorsport. The car is already moving fast; the point of the stop isn't to admire the lap times, it's to change tires and adjust the wing based on what the last stint revealed. A pit crew that spends twelve seconds reading telemetry aloud and zero seconds touching the car has run a beautiful, useless pit stop. That's what most internal QBRs are.
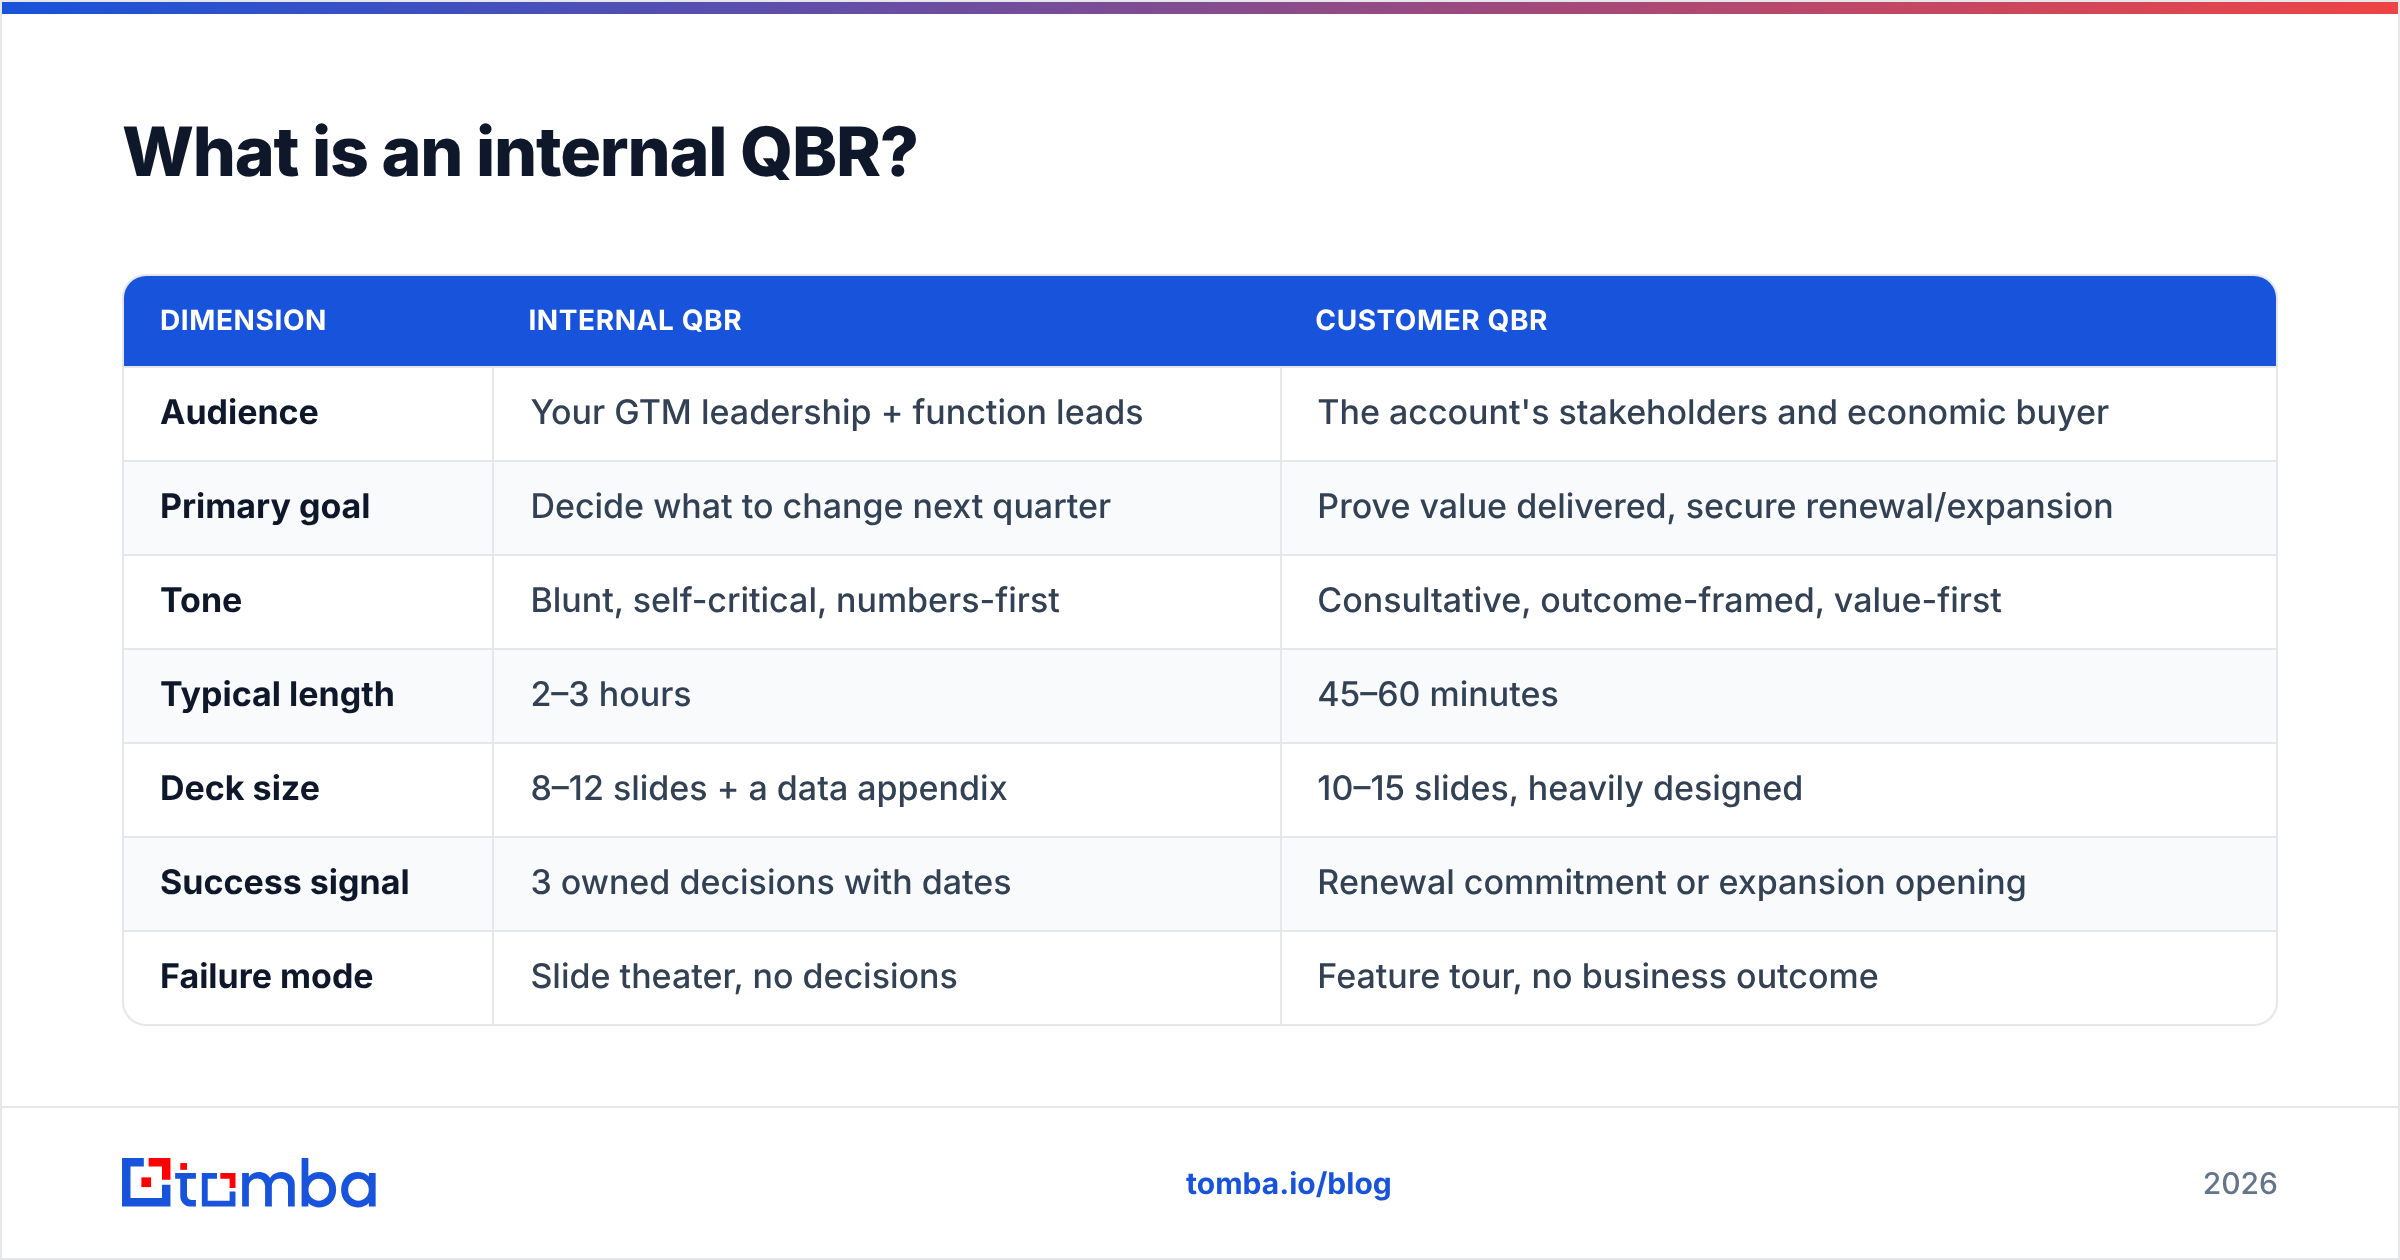
Here's what distinguishes the two formats in practice:
| Dimension | Internal QBR | Customer QBR |
|---|---|---|
| Audience | Your GTM leadership + function leads | The account's stakeholders and economic buyer |
| Primary goal | Decide what to change next quarter | Prove value delivered, secure renewal/expansion |
| Tone | Blunt, self-critical, numbers-first | Consultative, outcome-framed, value-first |
| Typical length | 2–3 hours | 45–60 minutes |
| Deck size | 8–12 slides + a data appendix | 10–15 slides, heavily designed |
| Success signal | 3 owned decisions with dates | Renewal commitment or expansion opening |
| Failure mode | Slide theater, no decisions | Feature tour, no business outcome |
If you run both and use the same template, you've already made the core mistake. Customer QBRs are persuasive documents. Internal QBRs are diagnostic ones.
Why do most internal QBRs fail?#
They fail for four reasons that show up in nearly every organization above 20 people.
- The deck becomes the deliverable. Someone spends nine days building 62 slides. The building is the work product, so nobody questions whether the meeting produced anything. Measure QBR output in decisions, not slides.
- Everything is backward-looking. Q3 attainment, Q3 pipeline coverage, Q3 win rate. All true, all historical. If more than half your agenda describes the past rather than proposing a change, you're holding a book report.
- No one owns the follow-up. Decisions get made in the room and evaporate by week two because "the team" owns them. A decision with a committee owner has no owner.
- The data is dirty. This is the quiet killer. Teams argue for forty minutes about whether outbound or inbound converts better, while 28% of the outbound contact records bounced and were never marked. Your win rate comparison is only meaningful if both cohorts had the same chance of actually reaching a human.
Gartner's research on sales operations has repeatedly flagged the same pattern: reviews that surface information without forcing a resource reallocation don't move performance. You can read their broader take on sales performance management for the enterprise framing, but the operational lesson is simple — a review is only a review if something is reviewed and then changed.
What should the internal QBR agenda look like?#
Three hours, four blocks, hard stops. Here's the structure that survives contact with a real calendar.
Block 1 — Number reality check (25 minutes). Attainment vs. plan, by segment and by rep. No commentary on why yet. Just get everyone looking at the same scoreboard. This should be read, not presented — put it in the pre-read and use the live time for questions only.
Block 2 — Pipeline forensics (45 minutes). Not "how much pipeline do we have" but "where did pipeline die and why." Stage-by-stage conversion, time-in-stage drift, and a deliberate look at the deals that stalled rather than lost. Stalled deals carry more diagnostic signal than closed-lost, because closed-lost usually gets a lazy reason code.
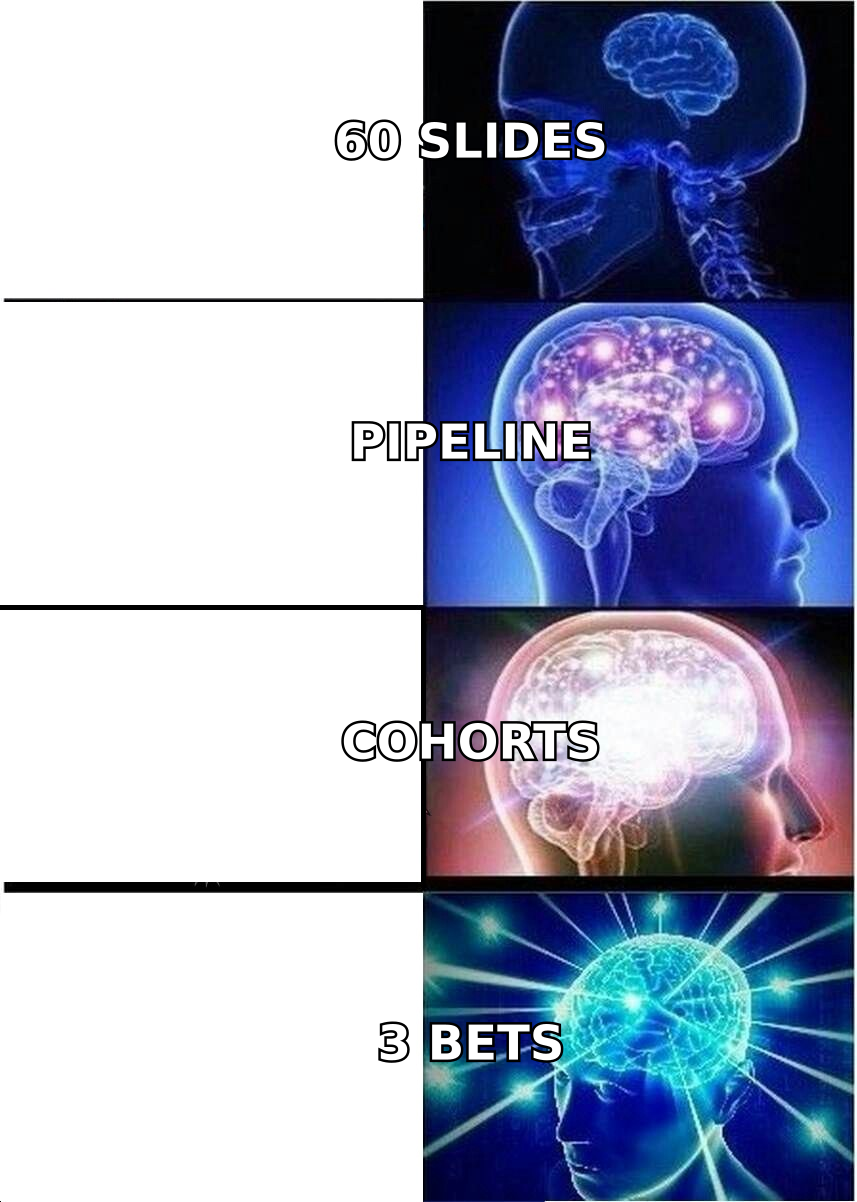
Block 3 — The three bets (60 minutes). This is the meeting. Each function proposes one change for next quarter with an expected impact and a cost. Debate them. Kill two-thirds of them. Leave with three.
Block 4 — Owners, dates, kill criteria (20 minutes). Every surviving bet gets a named human, a check-in date, and a pre-agreed condition under which you stop. The kill criteria matter more than people expect — without them, failed experiments run all four quarters because nobody wants to be the one to call it.
Leave the remaining 30 minutes unscheduled. It always gets used.
Which metrics belong in an internal QBR?#
Pick eight. Not forty. The temptation is to show everything you can query, which turns the room into a dashboard tour. These are the ones that consistently drive decisions rather than discussion:
- Pipeline coverage by segment — total qualified pipeline divided by quota, split by segment. A blended number hides that enterprise is at 4.2x and mid-market is at 1.8x.
- Stage-to-stage conversion, trailing four quarters — one quarter of conversion data is noise. Four quarters shows whether the top-of-funnel problem you're about to debate is real.
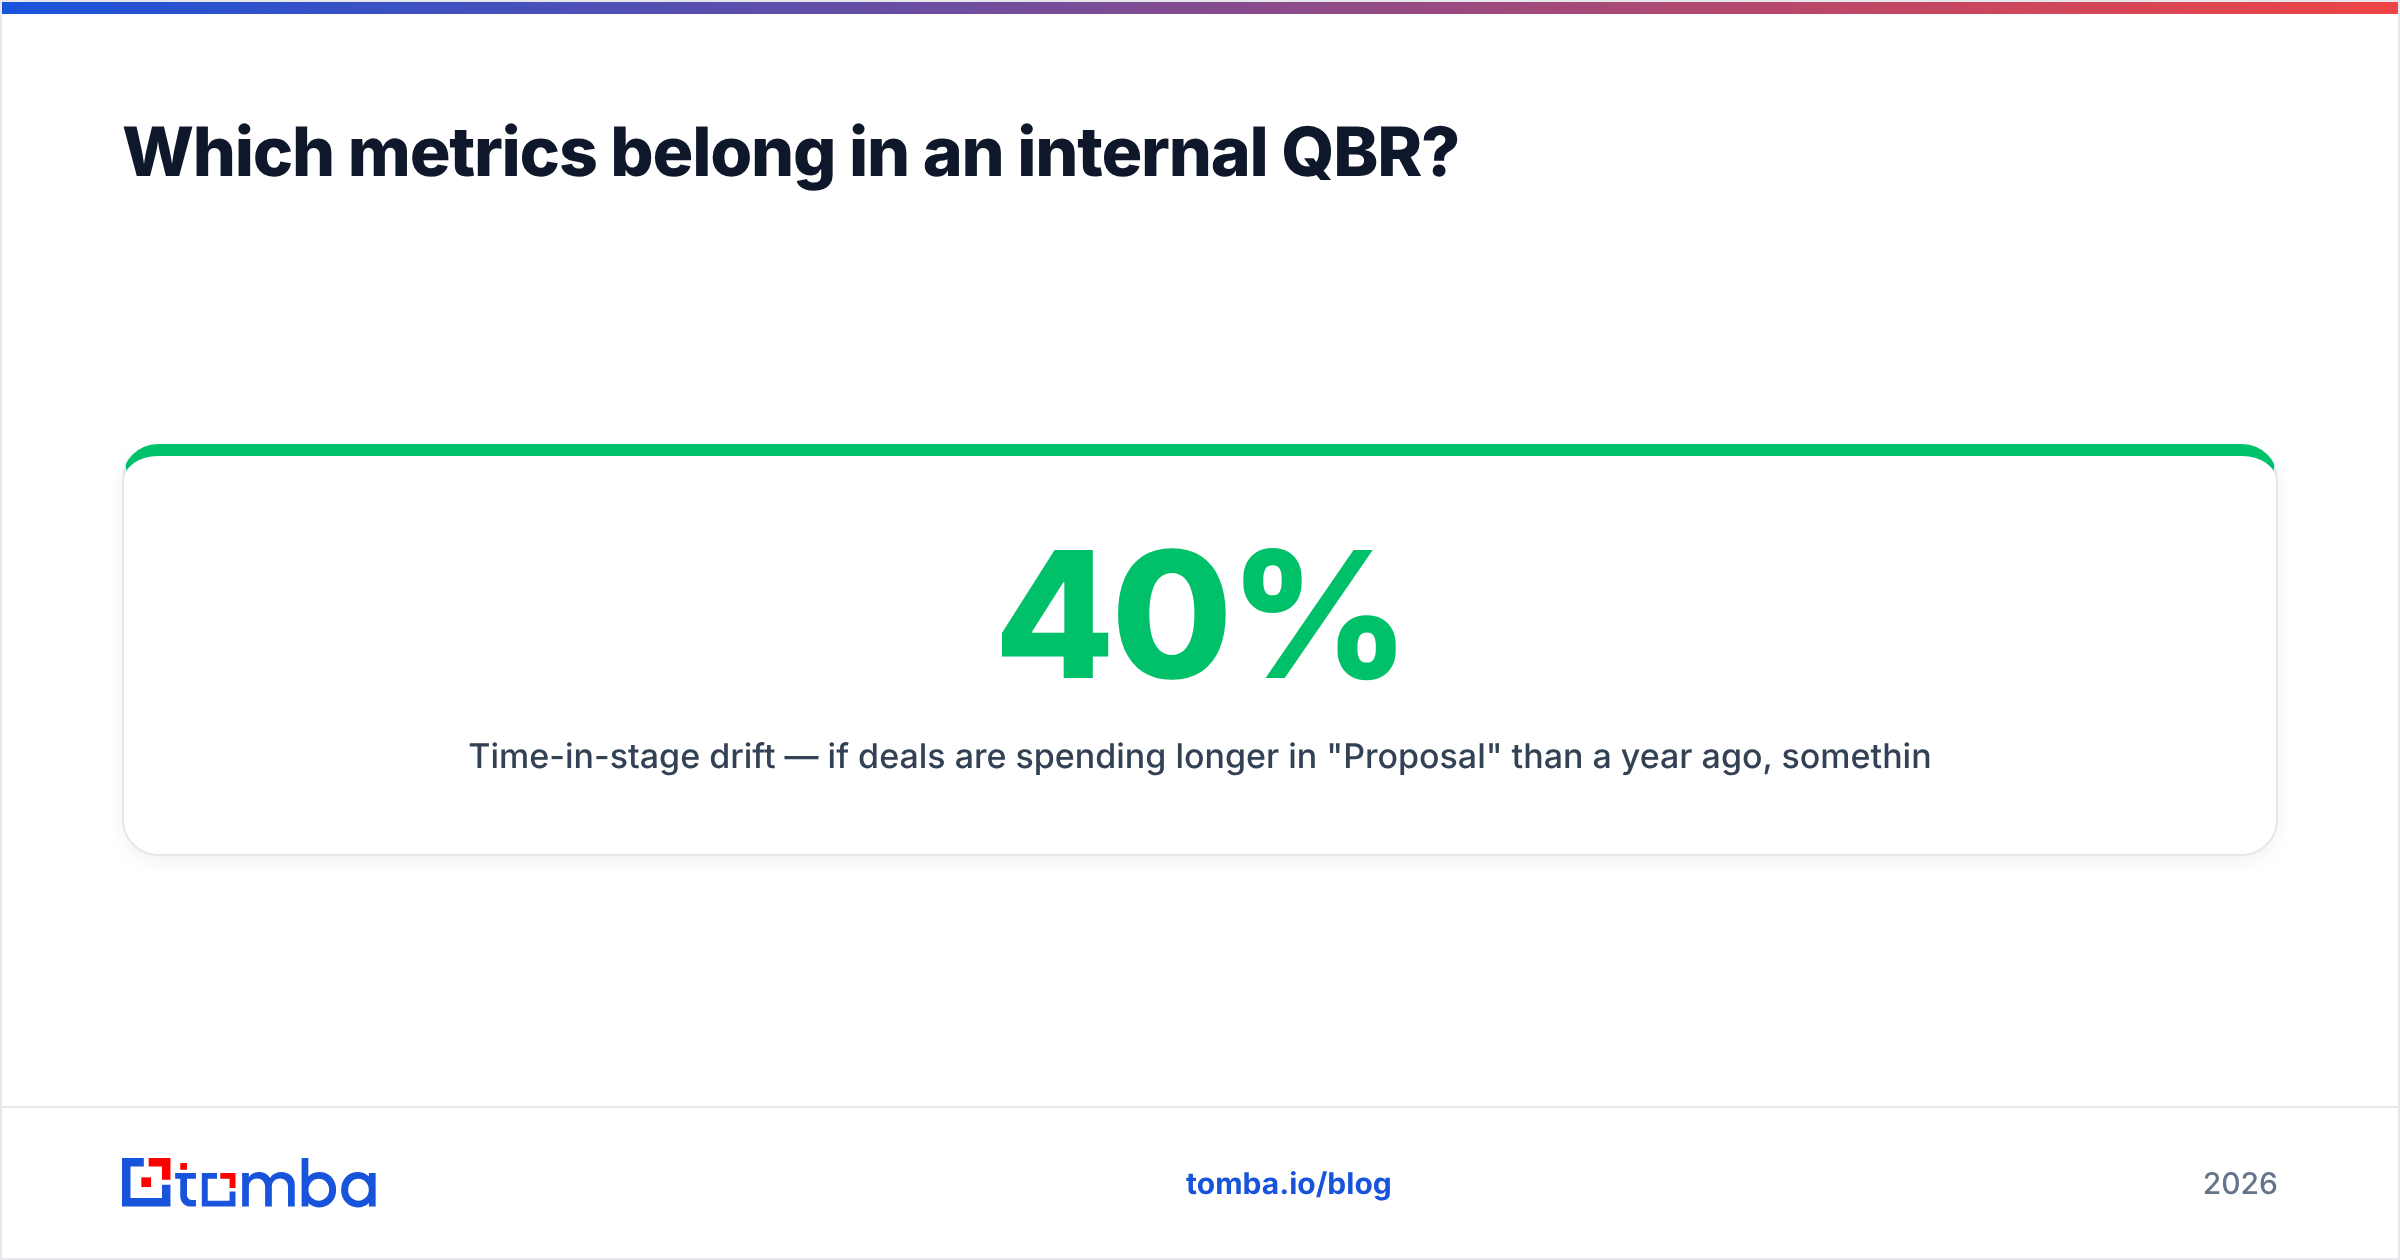
- Time-in-stage drift — if deals are spending 40% longer in "Proposal" than a year ago, something changed in buying committees, not in your reps.
- Contactability rate — the percentage of prospected contacts you actually reached. This is the metric almost nobody tracks and it silently corrupts everything else.
- Net revenue retention — the single best composite health signal for a subscription business.
- Response rate by sequence and segment — separates "our messaging is weak" from "our list is wrong," which are treated as the same problem far too often.
- Ramp time for new reps — leading indicator for next quarter's capacity, not this quarter's result.
- Cost per qualified opportunity — the number that makes channel arguments resolvable.
Notice what's missing: activity counts. Calls dialed and emails sent belong in a weekly manager one-on-one, not a quarterly strategy meeting. Putting them in the QBR invites the room to solve for effort instead of outcome.
How do you prepare the data before the meeting?#
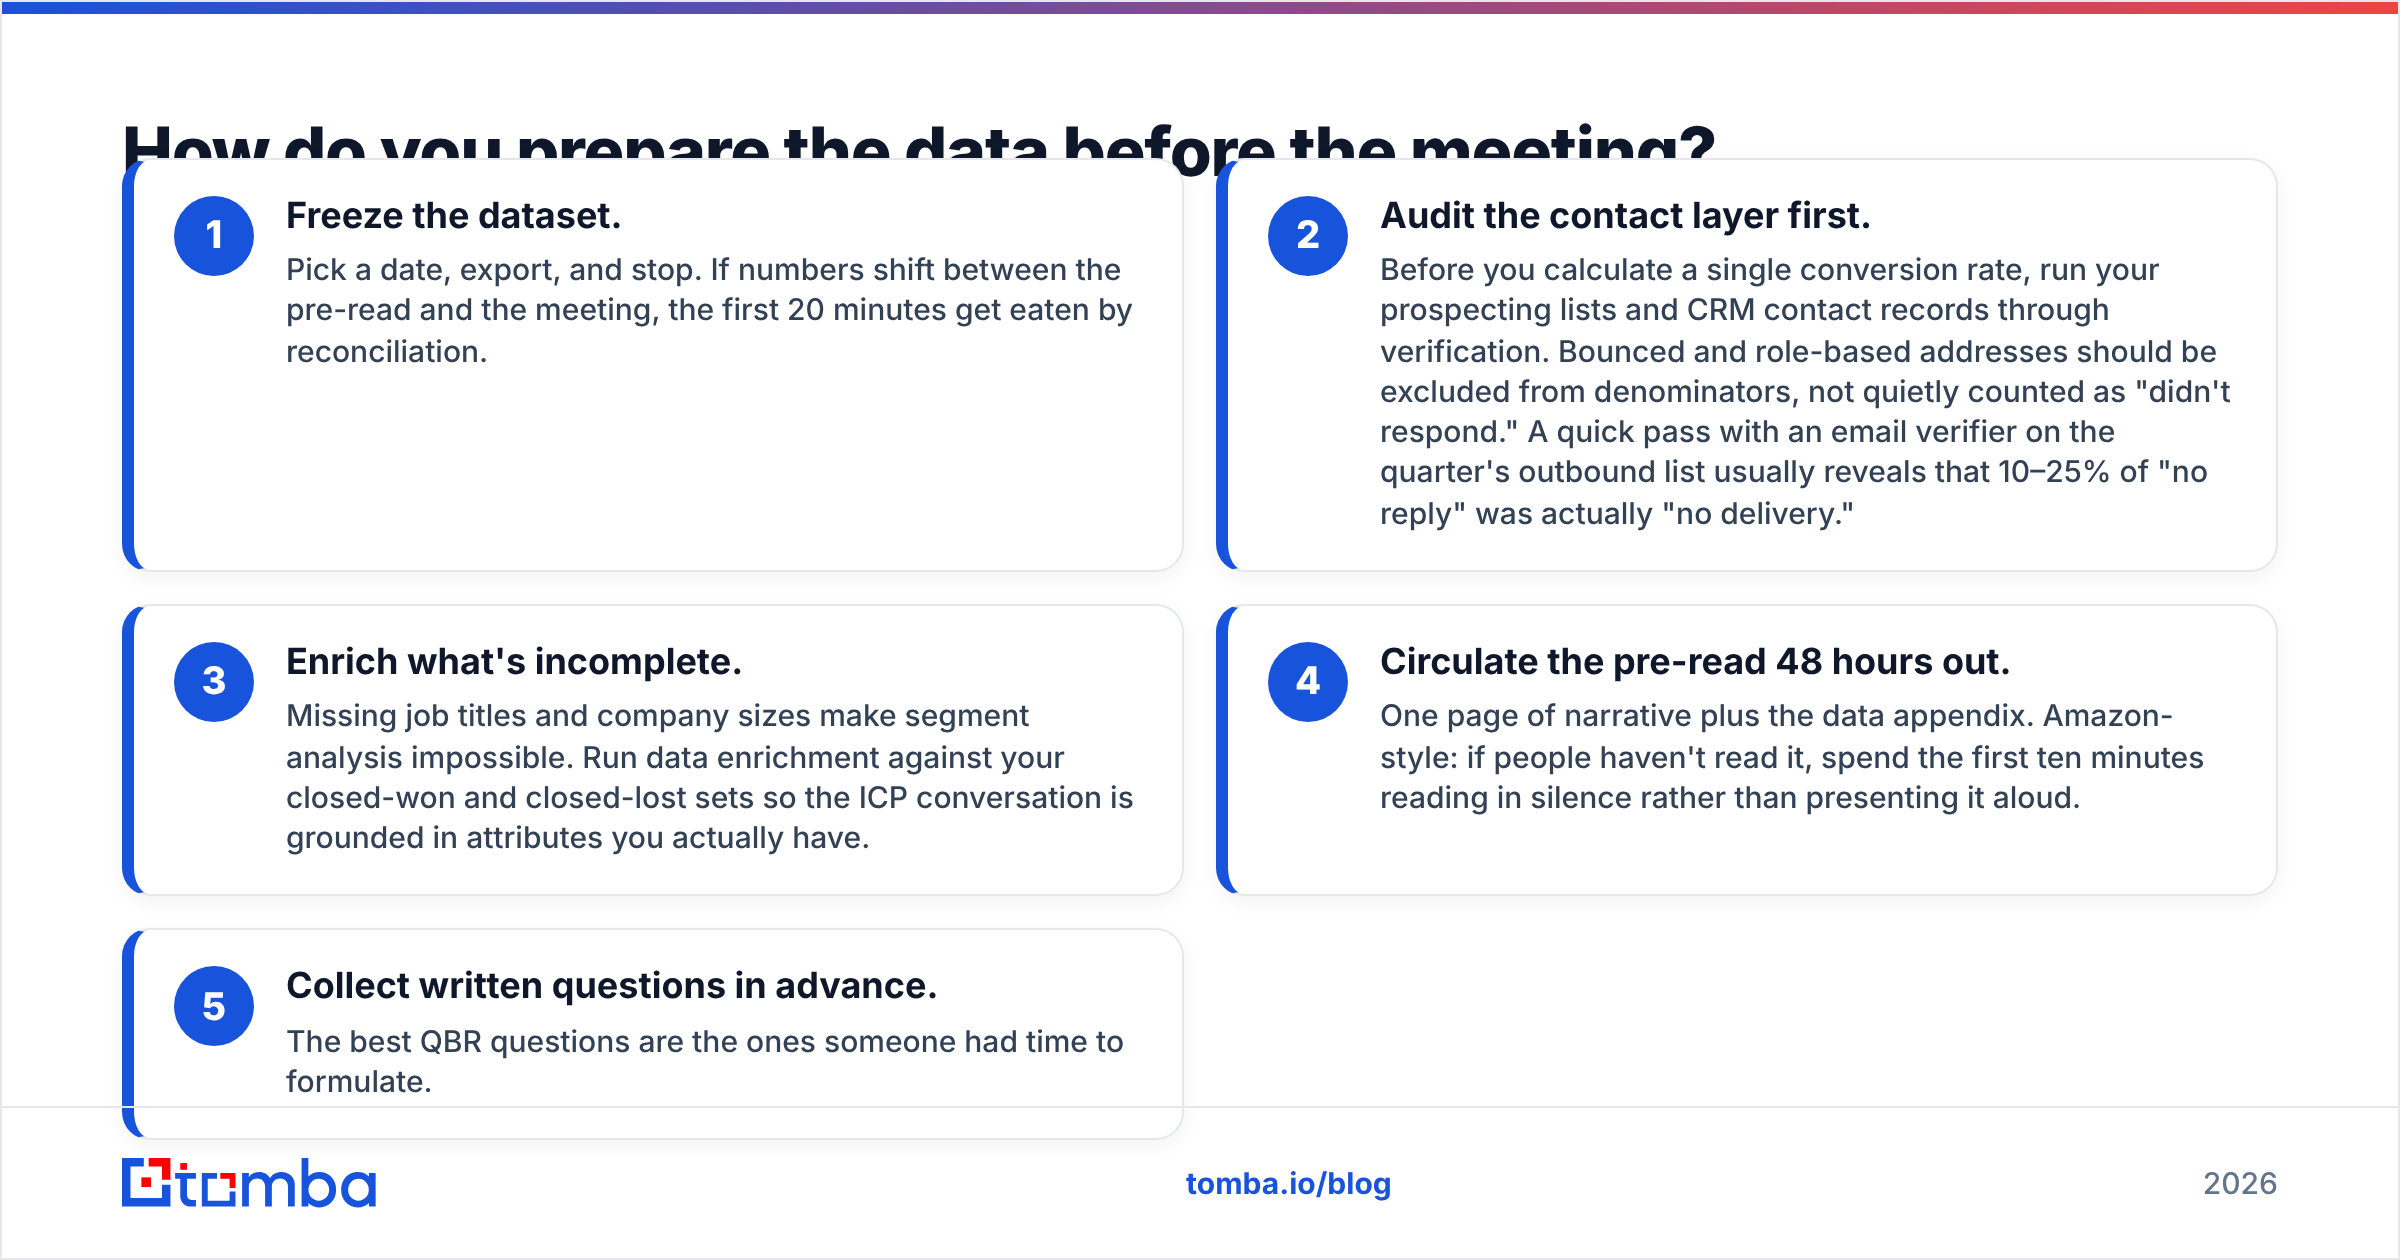
Start two weeks out, not two days. The preparation sequence that works:
- Freeze the dataset. Pick a date, export, and stop. If numbers shift between the pre-read and the meeting, the first 20 minutes get eaten by reconciliation.
- Audit the contact layer first. Before you calculate a single conversion rate, run your prospecting lists and CRM contact records through verification. Bounced and role-based addresses should be excluded from denominators, not quietly counted as "didn't respond." A quick pass with an email verifier on the quarter's outbound list usually reveals that 10–25% of "no reply" was actually "no delivery."
- Enrich what's incomplete. Missing job titles and company sizes make segment analysis impossible. Run data enrichment against your closed-won and closed-lost sets so the ICP conversation is grounded in attributes you actually have.
- Circulate the pre-read 48 hours out. One page of narrative plus the data appendix. Amazon-style: if people haven't read it, spend the first ten minutes reading in silence rather than presenting it aloud.
- Collect written questions in advance. The best QBR questions are the ones someone had time to formulate.
Step two is the one teams skip, and it's the one that changes the meeting most. HubSpot's research on CRM data decay puts B2B contact data degradation at roughly 22–30% annually — job changes, domain migrations, and departures. Over four quarters, that means a meaningful slice of your "we tried that segment and it didn't work" conclusions were actually deliverability failures dressed up as market feedback.
How do you compare QBR formats across team sizes?#
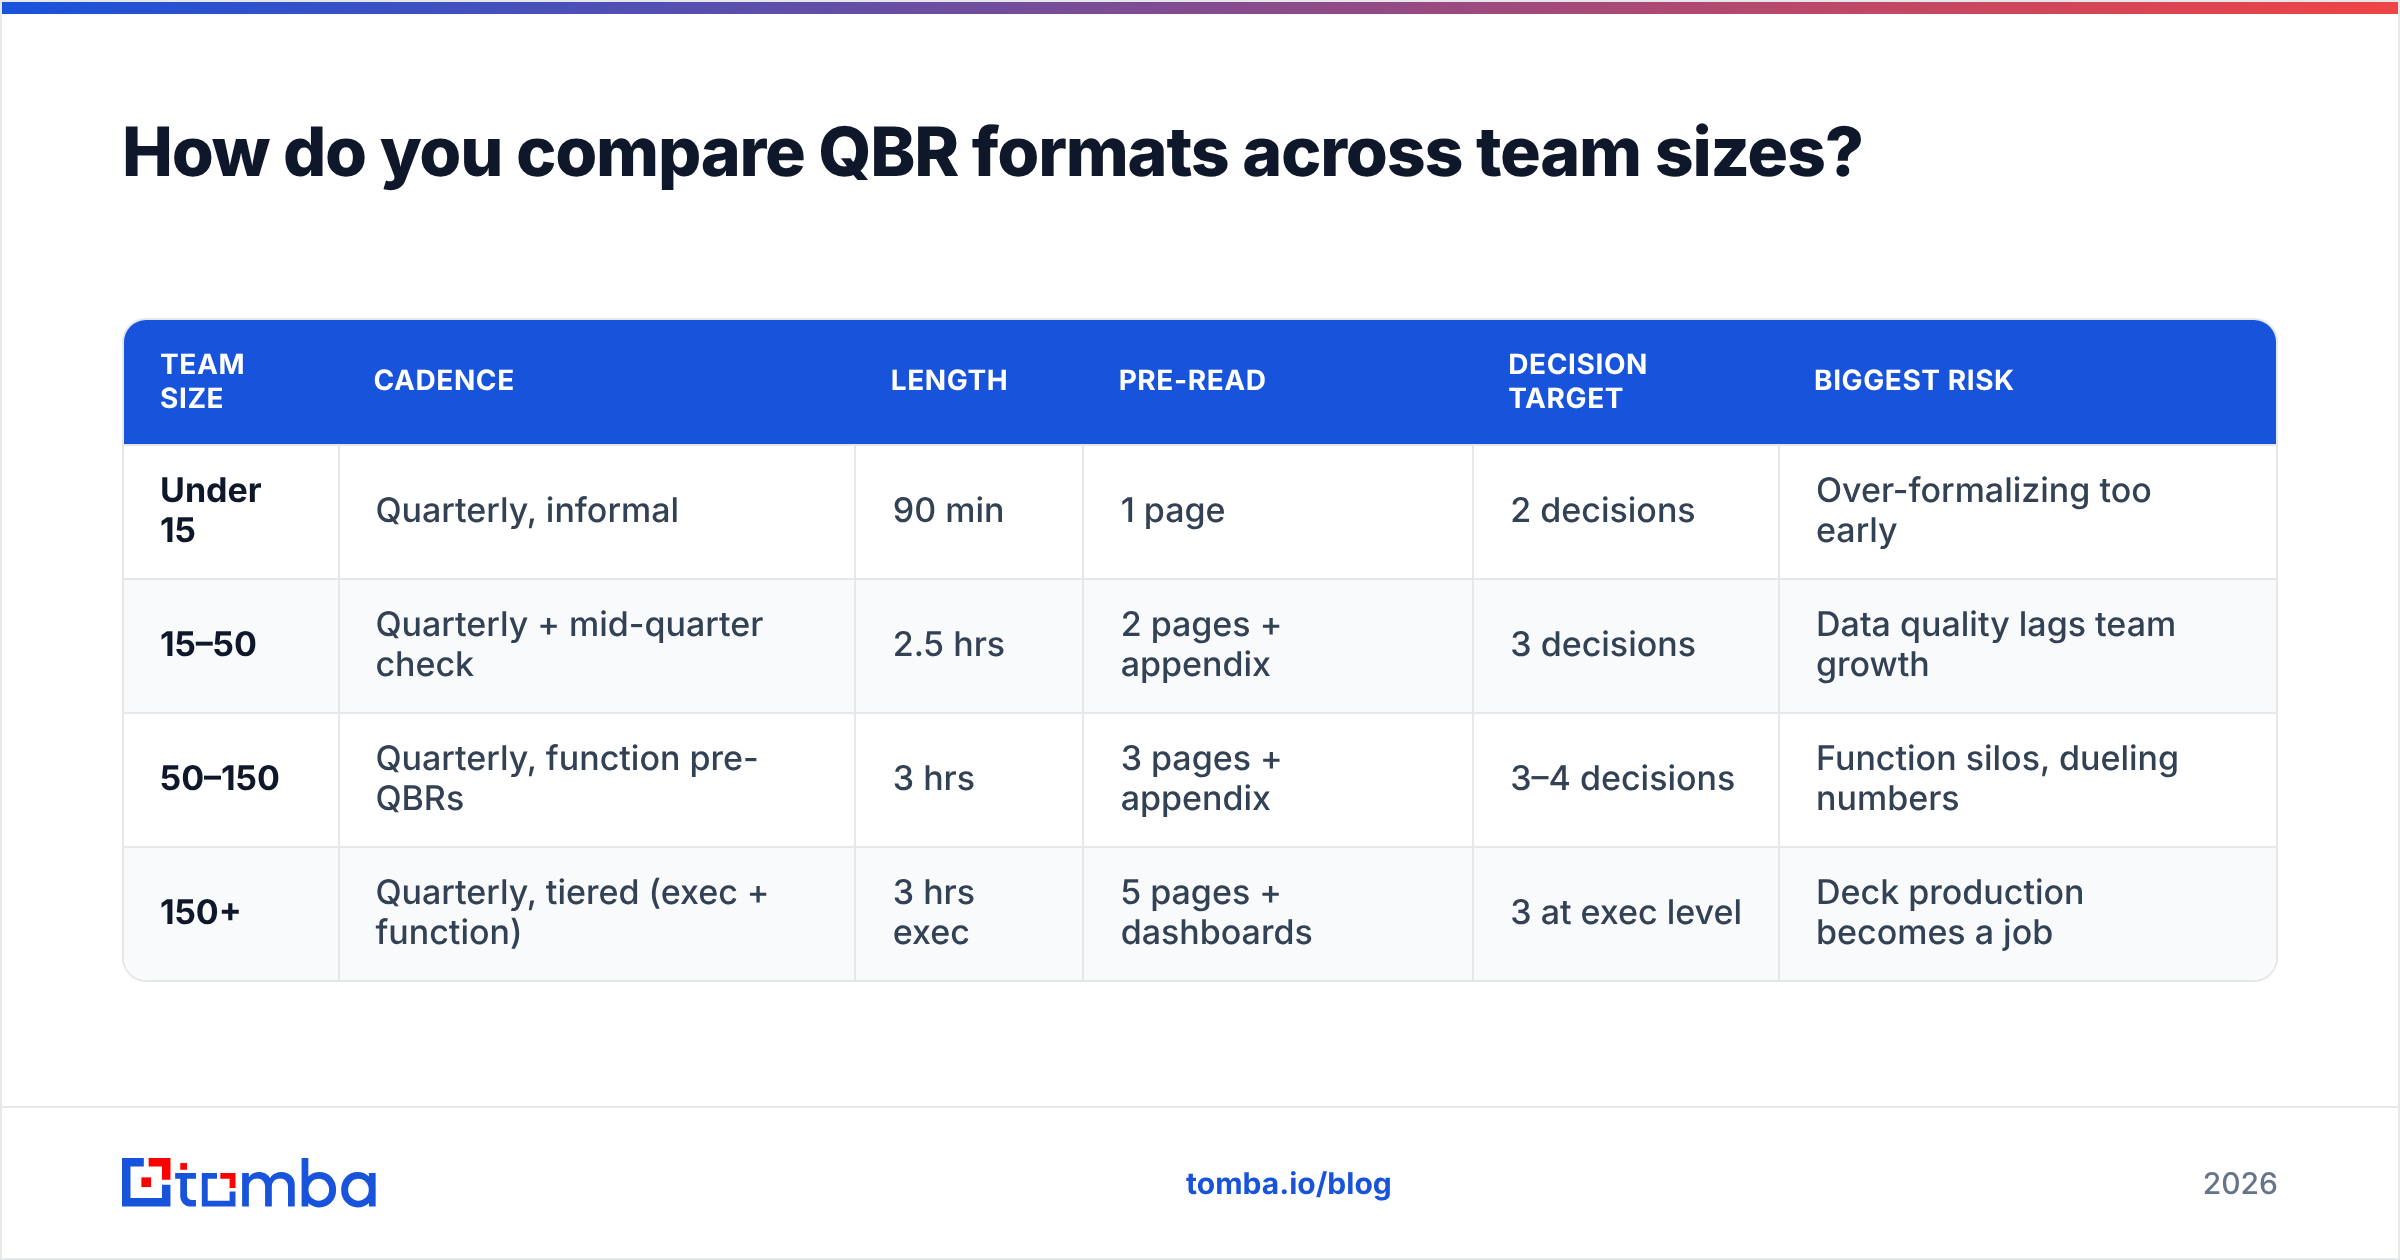
There's no single right cadence. A 12-person startup running a three-hour formal QBR is performing bureaucracy; a 300-person org running a 45-minute standup is skipping the strategy. Match the format to the stage:
| Team size | Cadence | Length | Pre-read | Decision target | Biggest risk |
|---|---|---|---|---|---|
| Under 15 | Quarterly, informal | 90 min | 1 page | 2 decisions | Over-formalizing too early |
| 15–50 | Quarterly + mid-quarter check | 2.5 hrs | 2 pages + appendix | 3 decisions | Data quality lags team growth |
| 50–150 | Quarterly, function pre-QBRs | 3 hrs | 3 pages + appendix | 3–4 decisions | Function silos, dueling numbers |
| 150+ | Quarterly, tiered (exec + function) | 3 hrs exec | 5 pages + dashboards | 3 at exec level | Deck production becomes a job |
The pattern across every row: decision count stays roughly flat as the company grows. What scales is the preparation, not the output. If your 200-person org is leaving a QBR with eleven decisions, you haven't had a strategy meeting — you've had an inbox.
What does good follow-through look like?#
Most of the value in an internal QBR is created in the six weeks after it ends. The mechanics:
- One owner per decision, named in the doc. Not a team, not a function. A person who would be embarrassed at week six.
- A week-6 check-in on the calendar before anyone leaves the room. Booked live, during Block 4. Calendar invites created after the meeting get created at a 40% rate, generously.
- A visible artifact. A shared doc or a CRM-linked project board where all three bets live with status. If the decisions exist only in meeting notes, they're already dead.
- Explicit kill criteria. "If we haven't hit 15 qualified meetings from this segment by week 8, we stop and reallocate the SDR." Writing the stop condition while you're still optimistic is the only time you'll write an honest one.
- A five-minute QBR retro at the start of the next one. What did we commit to? What happened? This single habit does more for QBR quality than any template.
Salesforce's guidance on sales operations planning makes a similar point about closing the loop between planning cycles — the plan only has teeth if the next cycle audits the last one.
How do you keep the underlying data trustworthy between QBRs?#
Quarterly cleanup is better than none, but it means you spend the first month of every quarter acting on three-month-old records. Treating data hygiene as continuous instead of episodic removes the largest single source of QBR disagreement.
A workable rhythm:
- Weekly — verify new contacts at the point of entry, not at the point of campaign send. Wire this into your intake workflow via the Tomba API or a HubSpot integration so nothing dirty lands in the CRM in the first place.
- Monthly — re-verify any contact record untouched for 90+ days, and re-enrich company attributes for open opportunities.
- Quarterly, pre-QBR — full sweep of the segment lists you plan to discuss, plus a bounce-rate reconciliation against your sending platform.
Tools in this space split into two camps. Broad data platforms like Apollo and ZoomInfo bundle contact data with sequencing and intent, which suits teams wanting one vendor. Focused providers — Tomba, BookYourData, and similar — concentrate on getting the contact layer right and integrating with whatever you already use for sequencing. Neither camp is wrong; the choice depends on whether you want an all-in-one or a best-of-breed stack. What matters for your QBR is that someone owns contactability as a tracked metric, and that it appears on the eight-metric list rather than as an excuse raised in Block 2.
One practical note on cost: data hygiene is usually cheaper than the meeting time it saves. At the $49/mo Starter tier or $99/mo Growth tier, verifying a quarter's prospecting list costs less than one hour of the combined salaries sitting in your QBR room. Full Tomba pricing starts with a free tier of 25 searches a month if you want to test the workflow before committing.
What should you cut from your current QBR?#
If you're auditing an existing format, these are the highest-value deletions:
- Individual rep report-outs. Six reps narrating their own quarter for eight minutes each is 48 minutes of information already in the dashboard. Move it to one-on-ones.
- Marketing campaign recaps. Unless a campaign informs a next-quarter bet, it's a newsletter item.
- Competitive updates with no action attached. "Competitor X raised a Series C" is interesting. It's not a decision unless it changes pricing, positioning, or targeting.
- Any slide titled "Key Takeaways." If the takeaways needed a slide, the preceding slides failed.
- The full product roadmap. It has its own meeting. Include only the two items GTM is selling against next quarter.
Cutting these typically reclaims 60–75 minutes, which is exactly the amount of time Block 3 needs and never gets.
Make your next QBR argue about the right things#
The difference between a QBR that changes behavior and one that fills a calendar slot usually isn't the agenda — it's whether the numbers on the screen can be trusted enough to act on. Teams that skip the data audit end up litigating measurement instead of strategy, and the three hours disappear into "I don't think that number's right."
Fix the input layer first. Run your quarter's prospecting lists and CRM contact records through Tomba Email Finder before you build the deck, so contactability stops being an unmeasured variable and becomes a line on your scoreboard. Start on the free tier, verify one segment, and see how much of last quarter's "that channel doesn't work" was actually mail that never arrived. Then go have the argument worth having.
Related guides#
// get started
Find, verify and enrich your first contacts today
Start on the free plan with 25 searches a month, then scale when your team is ready.
Free plan · No credit card required · GDPR & CCPA
Get the Tomba newsletter
Product and data updates
// about the author