Lead Conversion in 2026: How to Turn More Leads Into Revenue
Most lead conversion problems are diagnosed as closing problems and are actually data, routing, or timing problems. Here are the benchmarks, the math, and the fixes that move the rate.
TL;DR
- Lead conversion is a chain of stage-to-stage handoffs, not one number. If you only track "leads to customers," you cannot tell whether the problem is targeting, routing, data, or closing.
- The median B2B lead-to-customer rate sits in the 2-5% range across most channels. Inbound demo requests convert far higher; scraped cold lists convert far lower. Comparing yourself to a blended benchmark is close to useless.
- The three leaks that cost the most are bad contact data, slow first response, and missing qualification — in that order. All three are fixable in weeks, unlike brand or pricing problems.
- A 5% bounce rate on your outbound list does more damage than a weak subject line, because it suppresses deliverability for every future send.
- Fix the data layer first. Verified contacts, enriched firmographics, and a real MQL definition typically move conversion more than another round of copy testing.
What is lead conversion, exactly?#
Lead conversion is the percentage of leads that advance from one defined stage to the next, ending with a closed-won deal. That second half of the sentence is where most teams get sloppy: they report a single "lead conversion rate" that blends a self-serve trial signup with a list-purchased cold contact, then wonder why the number never moves.
Think of it like a municipal water system. You do not measure water loss by comparing what enters the reservoir with what comes out of taps — you measure pressure at each junction, because that is the only way to find the cracked pipe. A funnel works the same way. The aggregate number tells you that you are losing water. Junction-level measurement tells you where.
A workable stage model for most B2B teams looks like this:
- Raw lead — any contact captured, from a form fill to a scraped domain. No quality claim attached.
- Contactable lead — the email is verified, the phone is valid, and the record has a real company attached. This stage is skipped by nearly everyone and it is the single biggest silent leak.
- Marketing qualified lead (MQL) — fits ICP and has shown intent. Your marketing qualified lead definition should be written down and argued over by sales and marketing, not inferred from a scoring model nobody has opened in a year.
- Sales accepted lead (SAL) — a rep has looked at it and agreed it is worth working. If your SAL acceptance rate is under 70%, marketing and sales disagree about the ICP.
- Sales qualified opportunity (SQO) — budget, authority, need, and timing confirmed enough to forecast.
- Closed-won — signed.
Every one of those transitions has its own rate, its own owner, and its own failure mode. Report all six or report nothing.
How do you calculate lead conversion rate correctly?#
The formula is trivial. The denominators are not.
Conversion rate = (leads that reached stage N+1) ÷ (leads that entered stage N) × 100
Three rules keep this honest:
- Cohort the denominator by entry date, not exit date. If you divide this month's closed deals by this month's new leads, you are mixing a 60-day sales cycle with a 30-day window. The number will look great in a slow month for lead gen and terrible after a good one.
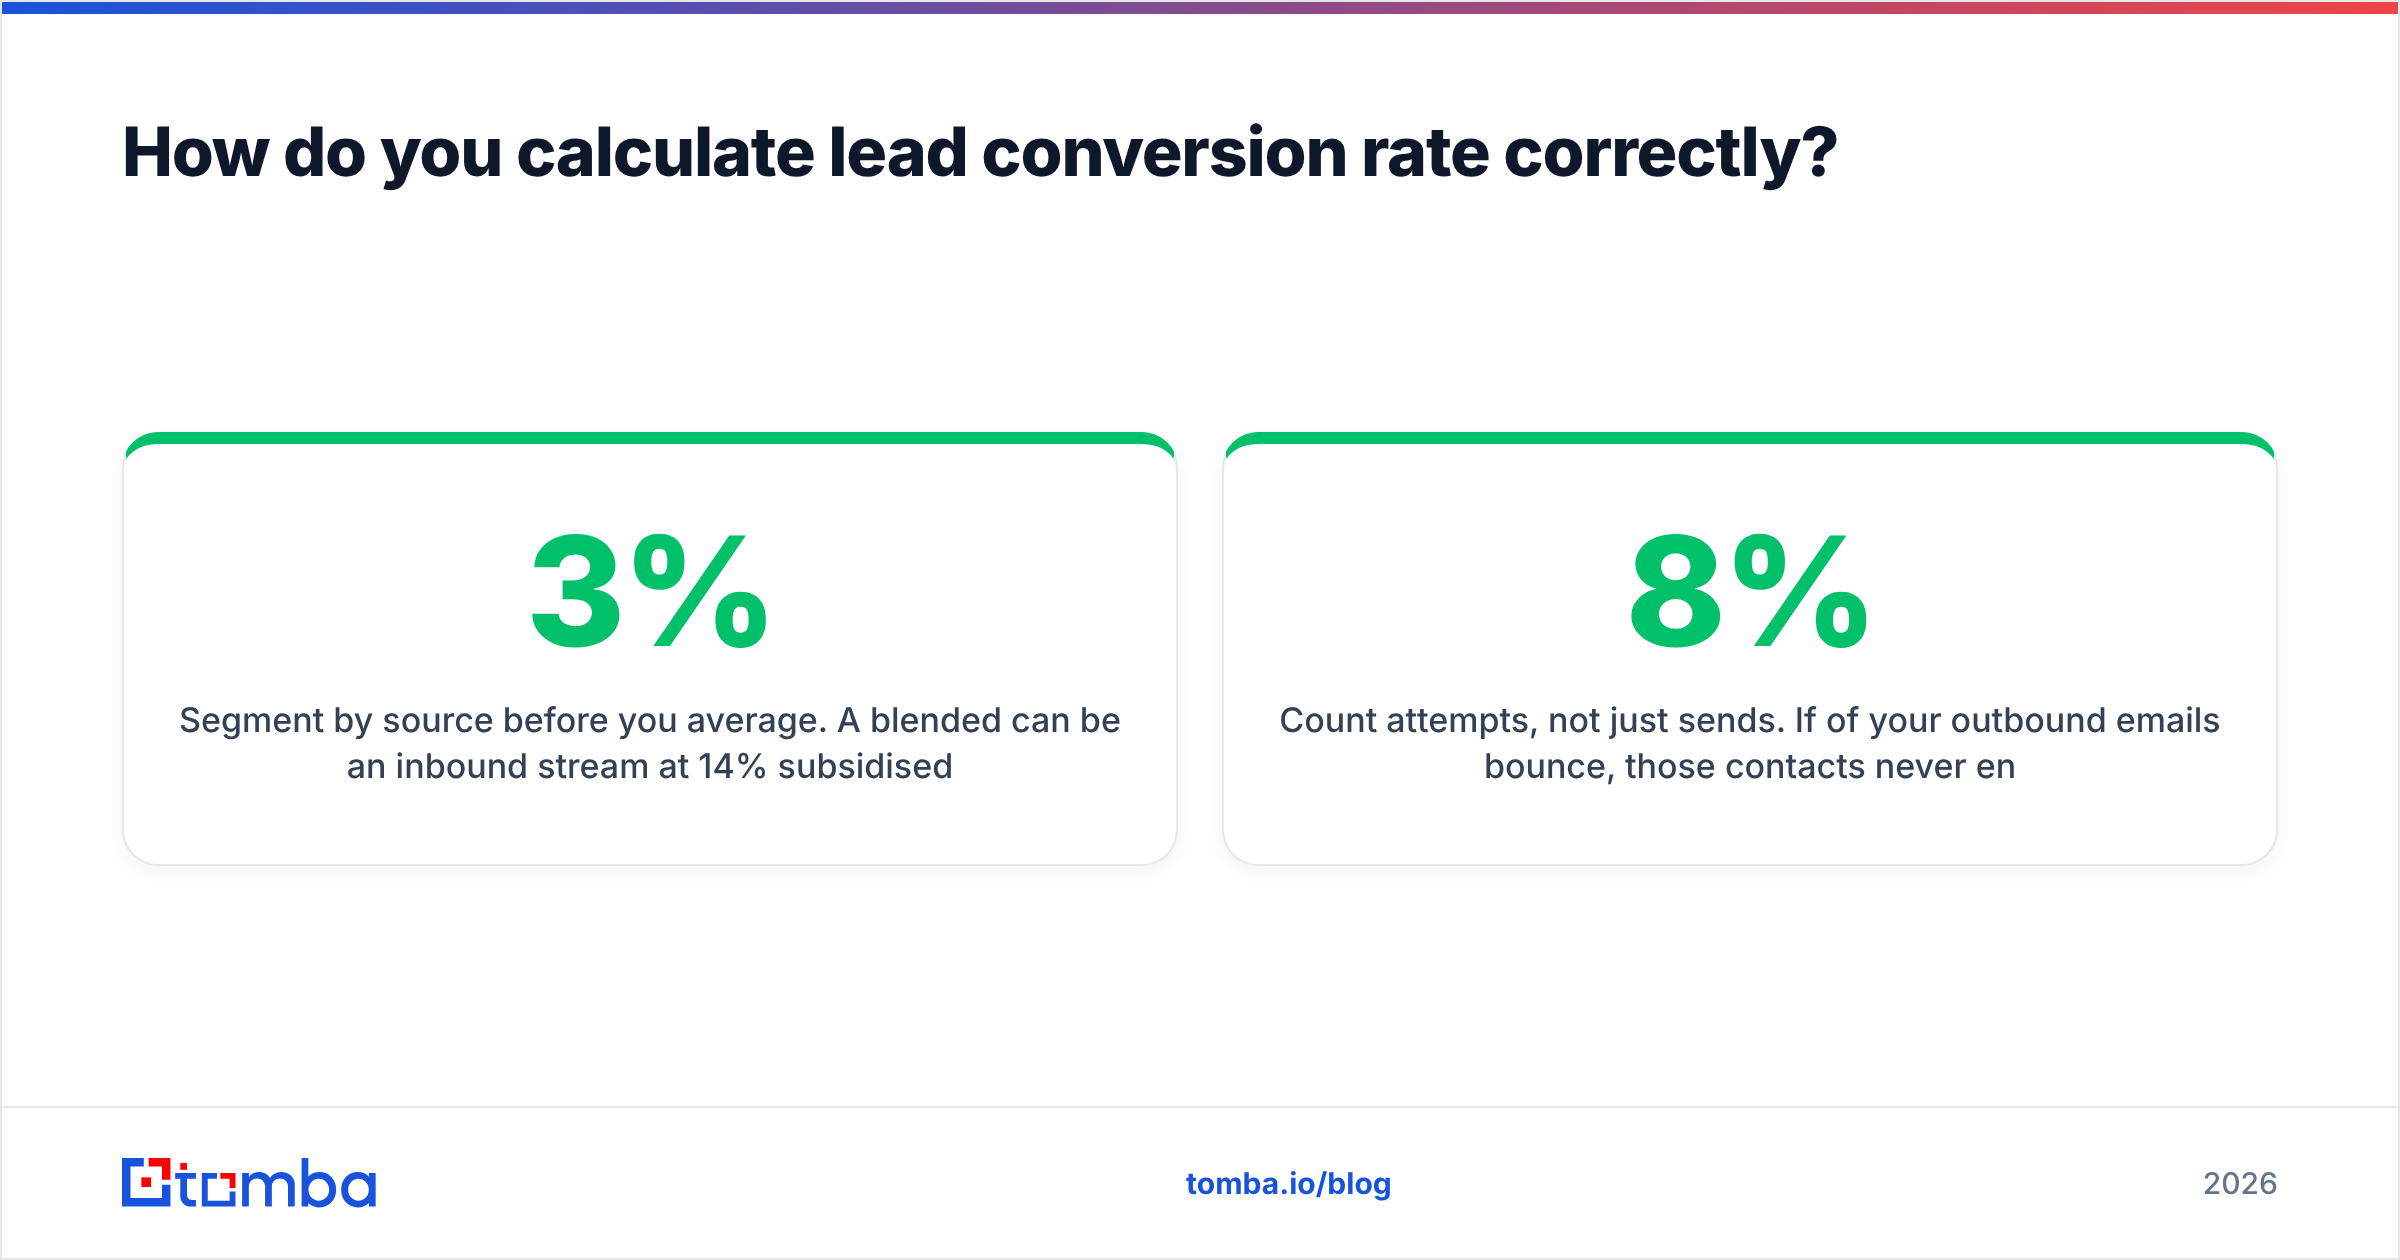
- Segment by source before you average. A blended 3% can be an inbound stream at 14% subsidised by a cold stream at 0.4%. The average hides both the thing to scale and the thing to kill.
- Count attempts, not just sends. If 8% of your outbound emails bounce, those contacts never entered the funnel in any meaningful sense, yet they sit in your denominator dragging the rate down and, worse, dragging your sender reputation down with them.
That last point deserves emphasis, because it is where the analytics and the deliverability problems meet. A bounced send is not a neutral non-event. Mailbox providers read it as a signal that you do not know who you are writing to, and they apply that judgement to your next campaign too.
What is a good lead conversion rate in 2026?#
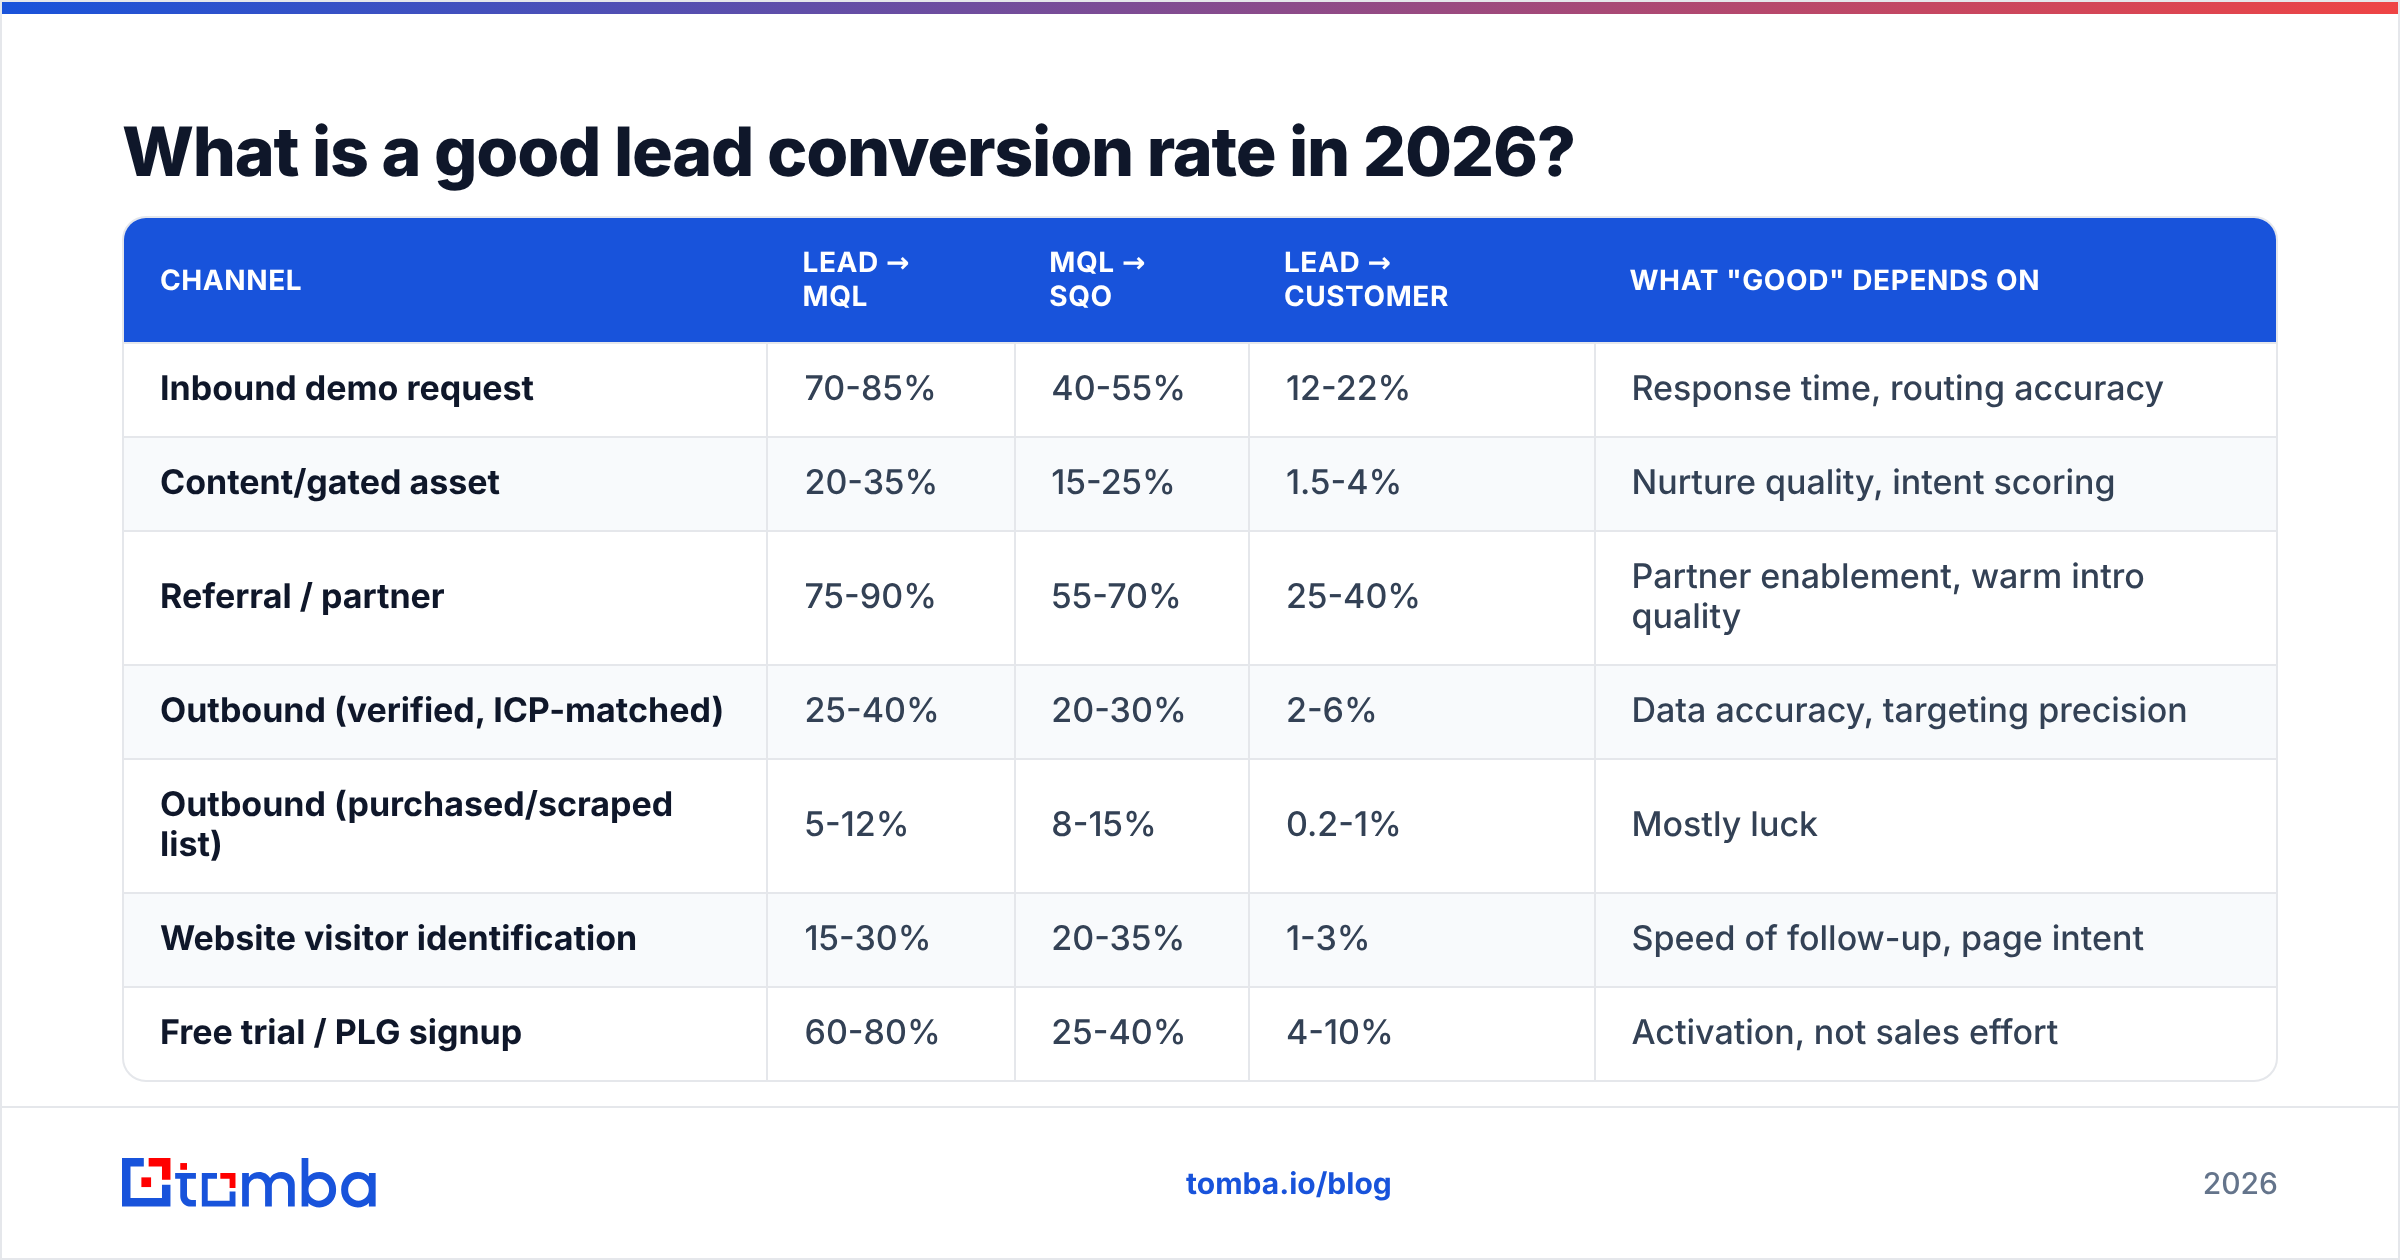
There is no single answer, but there are defensible ranges by channel. The table below reflects what most mid-market B2B teams see. Treat it as a sanity check, not a target.
| Channel | Lead → MQL | MQL → SQO | Lead → Customer | What "good" depends on |
|---|---|---|---|---|
| Inbound demo request | 70-85% | 40-55% | 12-22% | Response time, routing accuracy |
| Content/gated asset | 20-35% | 15-25% | 1.5-4% | Nurture quality, intent scoring |
| Referral / partner | 75-90% | 55-70% | 25-40% | Partner enablement, warm intro quality |
| Outbound (verified, ICP-matched) | 25-40% | 20-30% | 2-6% | Data accuracy, targeting precision |
| Outbound (purchased/scraped list) | 5-12% | 8-15% | 0.2-1% | Mostly luck |
| Website visitor identification | 15-30% | 20-35% | 1-3% | Speed of follow-up, page intent |
| Free trial / PLG signup | 60-80% | 25-40% | 4-10% | Activation, not sales effort |
Two things stand out. First, referrals convert roughly ten times better than cold outbound, which is why teams that can generate them stop optimising cold outbound. Second, the gap between verified outbound and scraped outbound is not marginal — it is an order of magnitude. The mechanism is boring: verified lists reach inboxes, scraped lists reach spam folders and dead mailboxes.
If you want broader industry context, HubSpot's research on sales and marketing benchmarks and Salesforce's State of Sales report both publish annual data worth reading alongside your own numbers.
Why do most leads never convert?#
Here are the five causes that account for the majority of lost lead conversion, ranked by how much damage they do relative to how hard they are to fix.
- The contact data is wrong. Between 20% and 30% of B2B contact records decay per year through job changes, domain migrations, and restructures. A list you bought in January is measurably worse in June. Wrong email, wrong title, wrong company — the sequence never had a chance.
- First response is too slow. Response time is the most consistently underrated lever in the entire funnel. A lead answered in five minutes is dramatically more likely to qualify than the same lead answered the next morning, because you are competing with the three other tabs they had open.
- Qualification happens too late. Reps spend cycles on leads that were never going to buy because nobody defined disqualification criteria. Disqualifying fast is a conversion tactic, not a defeat — it raises the rate on the leads that remain and frees capacity.
- Routing is broken. Round-robin assignment ignores territory, language, vertical expertise, and current workload. A lead handed to the wrong rep converts worse than the same lead handed to the right one, even with identical effort.
- The offer does not match the stage. Pushing a demo at someone who downloaded a definitional blog post converts at close to zero. Stage-appropriate next steps — a benchmark report, a teardown, a 12-minute call — outperform a generic "book a meeting" by a wide margin.
Notice that only the fifth item is a messaging problem. Most teams spend most of their optimisation time there anyway, because rewriting copy is more pleasant than auditing a database.
Does data quality really change lead conversion more than copy?#
Yes, and the arithmetic is not close.
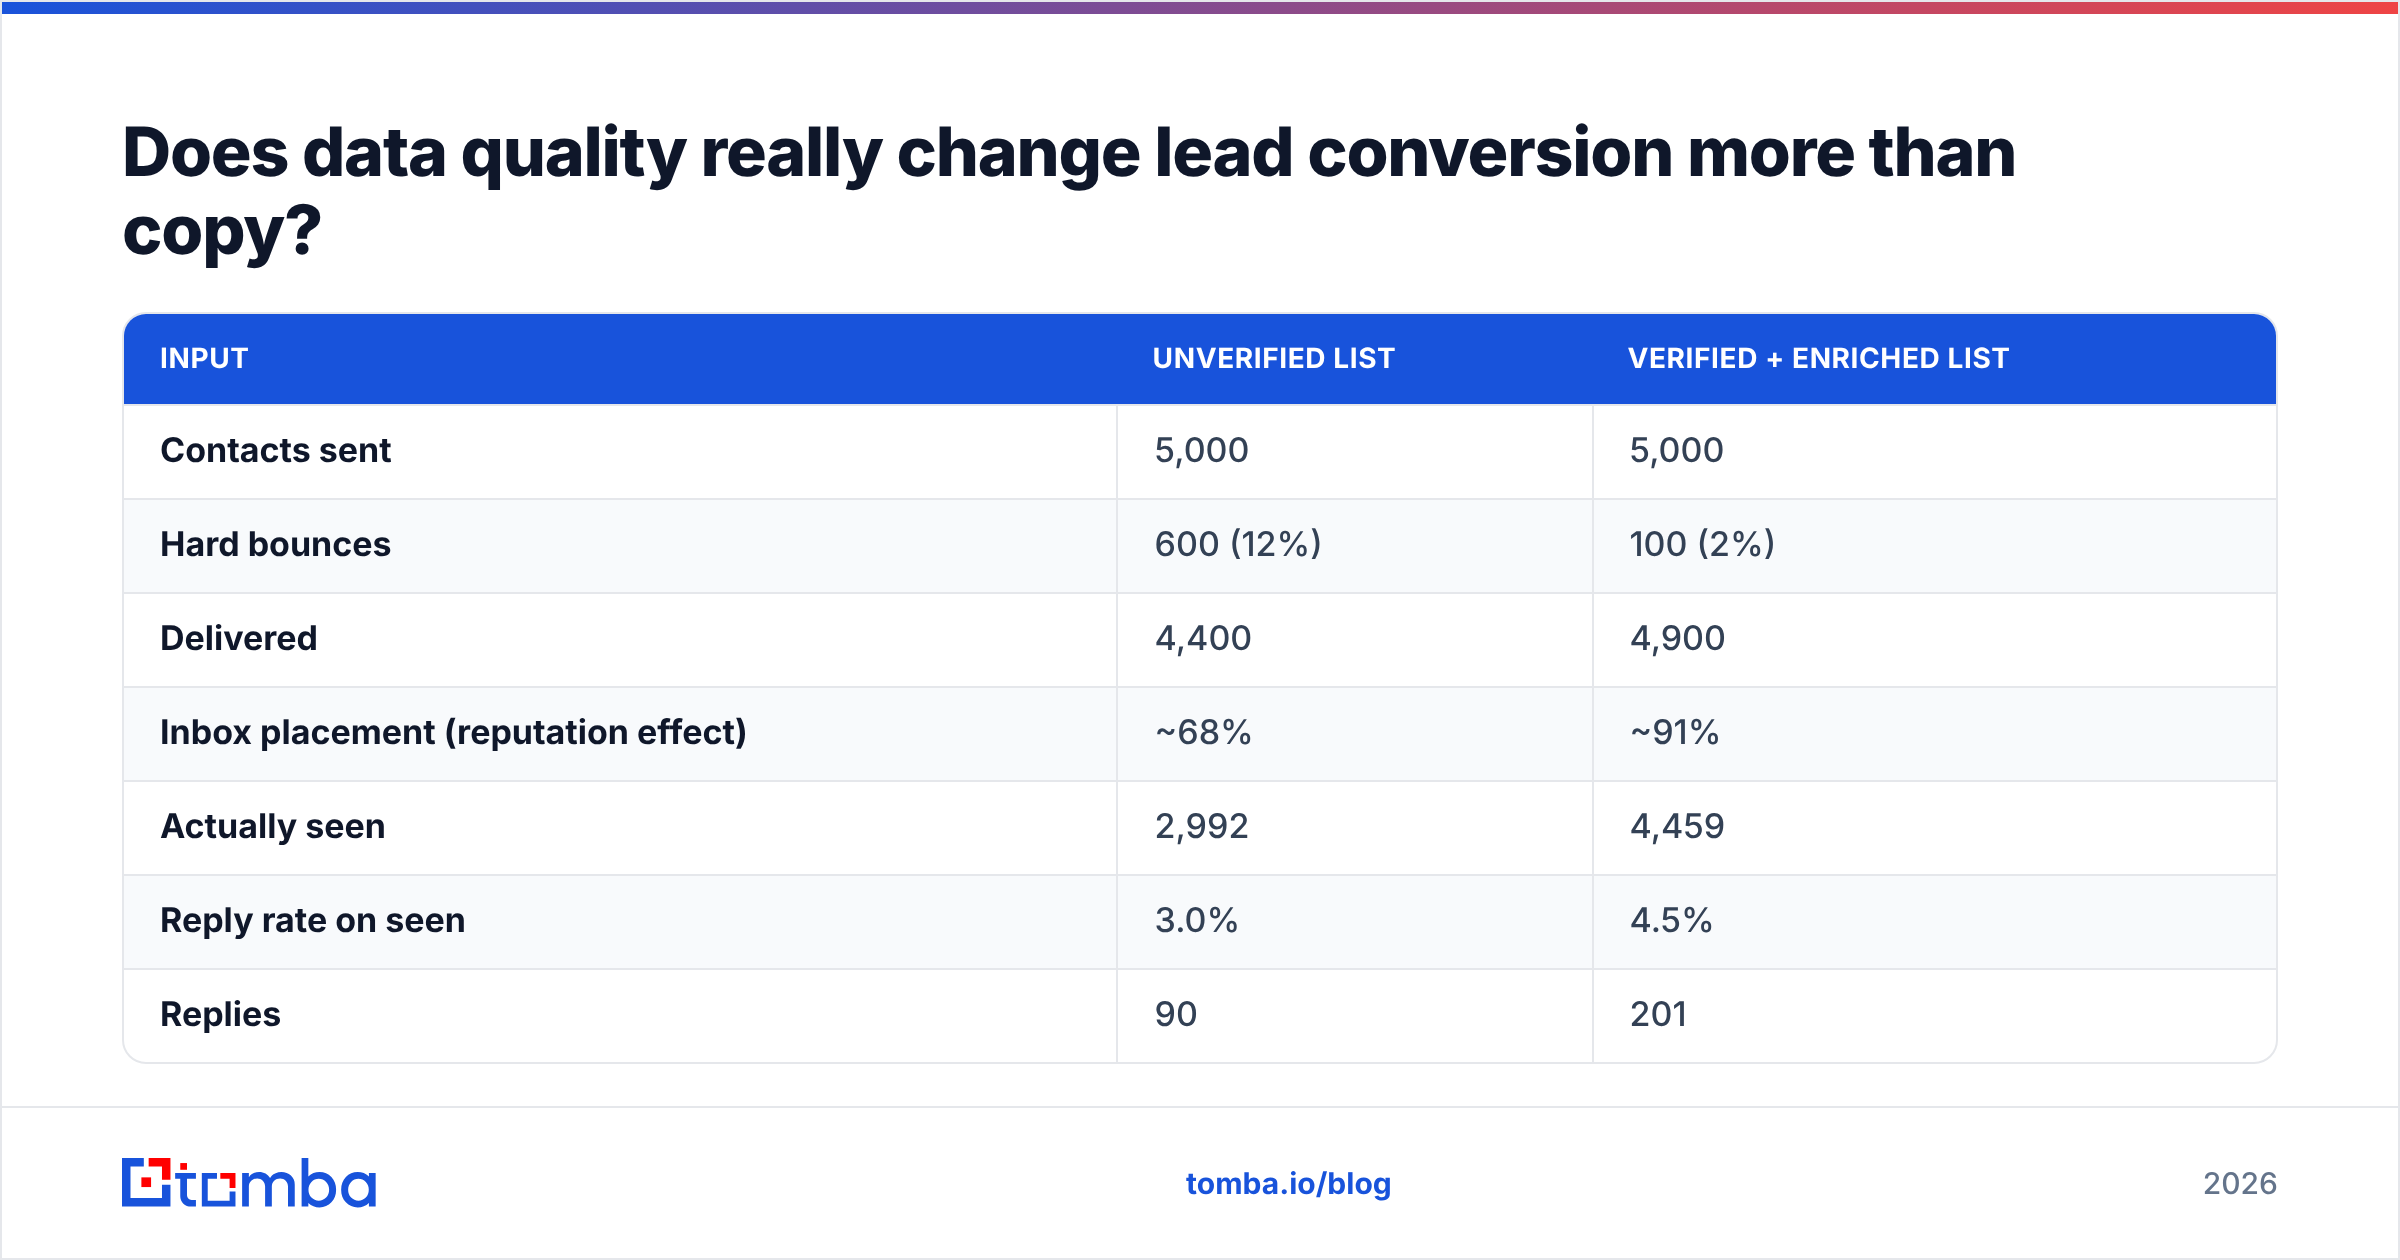
Take a 5,000-contact outbound campaign. Scenario A uses an unverified list with a 12% bounce rate and roughly 30% stale or mismatched titles. Scenario B uses the same source run through verification and enrichment first.
| Input | Unverified list | Verified + enriched list |
|---|---|---|
| Contacts sent | 5,000 | 5,000 |
| Hard bounces | 600 (12%) | 100 (2%) |
| Delivered | 4,400 | 4,900 |
| Inbox placement (reputation effect) | ~68% | ~91% |
| Actually seen | 2,992 | 4,459 |
| Reply rate on seen | 3.0% | 4.5% |
| Replies | 90 | 201 |
| Meetings booked (35% of replies) | 31 | 70 |
Same copy. Same offer. Same sender. The second campaign produces roughly 2.2x the meetings because more messages arrived and the ones that arrived were addressed to people who still hold the job you think they hold. No subject-line test produces a 2x lift. Data hygiene routinely does.
This is the cheapest work available to most revenue teams, and it is why running your list through an email verifier before a send is not an optional polish step. The same logic applies to enrichment: knowing headcount, tech stack, and funding stage lets you segment into three tight sequences instead of one broad one, and tight segments convert better at every stage.
How do you build a lead conversion system that holds up?#
Treat it as an assembly line with inspection points, not a set of tactics.
Step 1 — Define the stages in writing. One page. Entry criteria, exit criteria, owner, and SLA for each stage. If sales and marketing cannot both sign it, you do not have a funnel, you have two funnels pretending.
Step 2 — Put a data gate between capture and outreach. Nothing enters a sequence unverified. Nothing. Bulk-verify on import, re-verify anything older than 90 days, and route catch-all domains to a separate track rather than dumping them in with the rest. Running lists through bulk verify at import turns this into a scheduled job instead of a recurring argument.
Step 3 — Enrich before you segment. Firmographics and technographics turn a flat list into three or four coherent audiences. Use data enrichment to fill company size, industry, and role seniority, then write one sequence per segment. Three focused sequences beat one clever one.
Step 4 — Compress first response to minutes. Automate assignment, alert the owner in Slack, and give inbound leads a booking link in the auto-reply. Speed is a structural advantage that no competitor can copy quickly because it requires operational discipline rather than budget.
Step 5 — Score on fit and intent separately. A high-fit, low-intent lead goes to nurture. A low-fit, high-intent lead goes to self-serve. A high-fit, high-intent lead goes to a rep today. Collapsing both dimensions into a single 0-100 score destroys the information you needed.
Step 6 — Review a stage-by-stage report monthly. Look for the junction where the rate dropped most against last quarter, fix only that, and measure again. Fixing everything at once means learning nothing.
Which tools actually move lead conversion?#
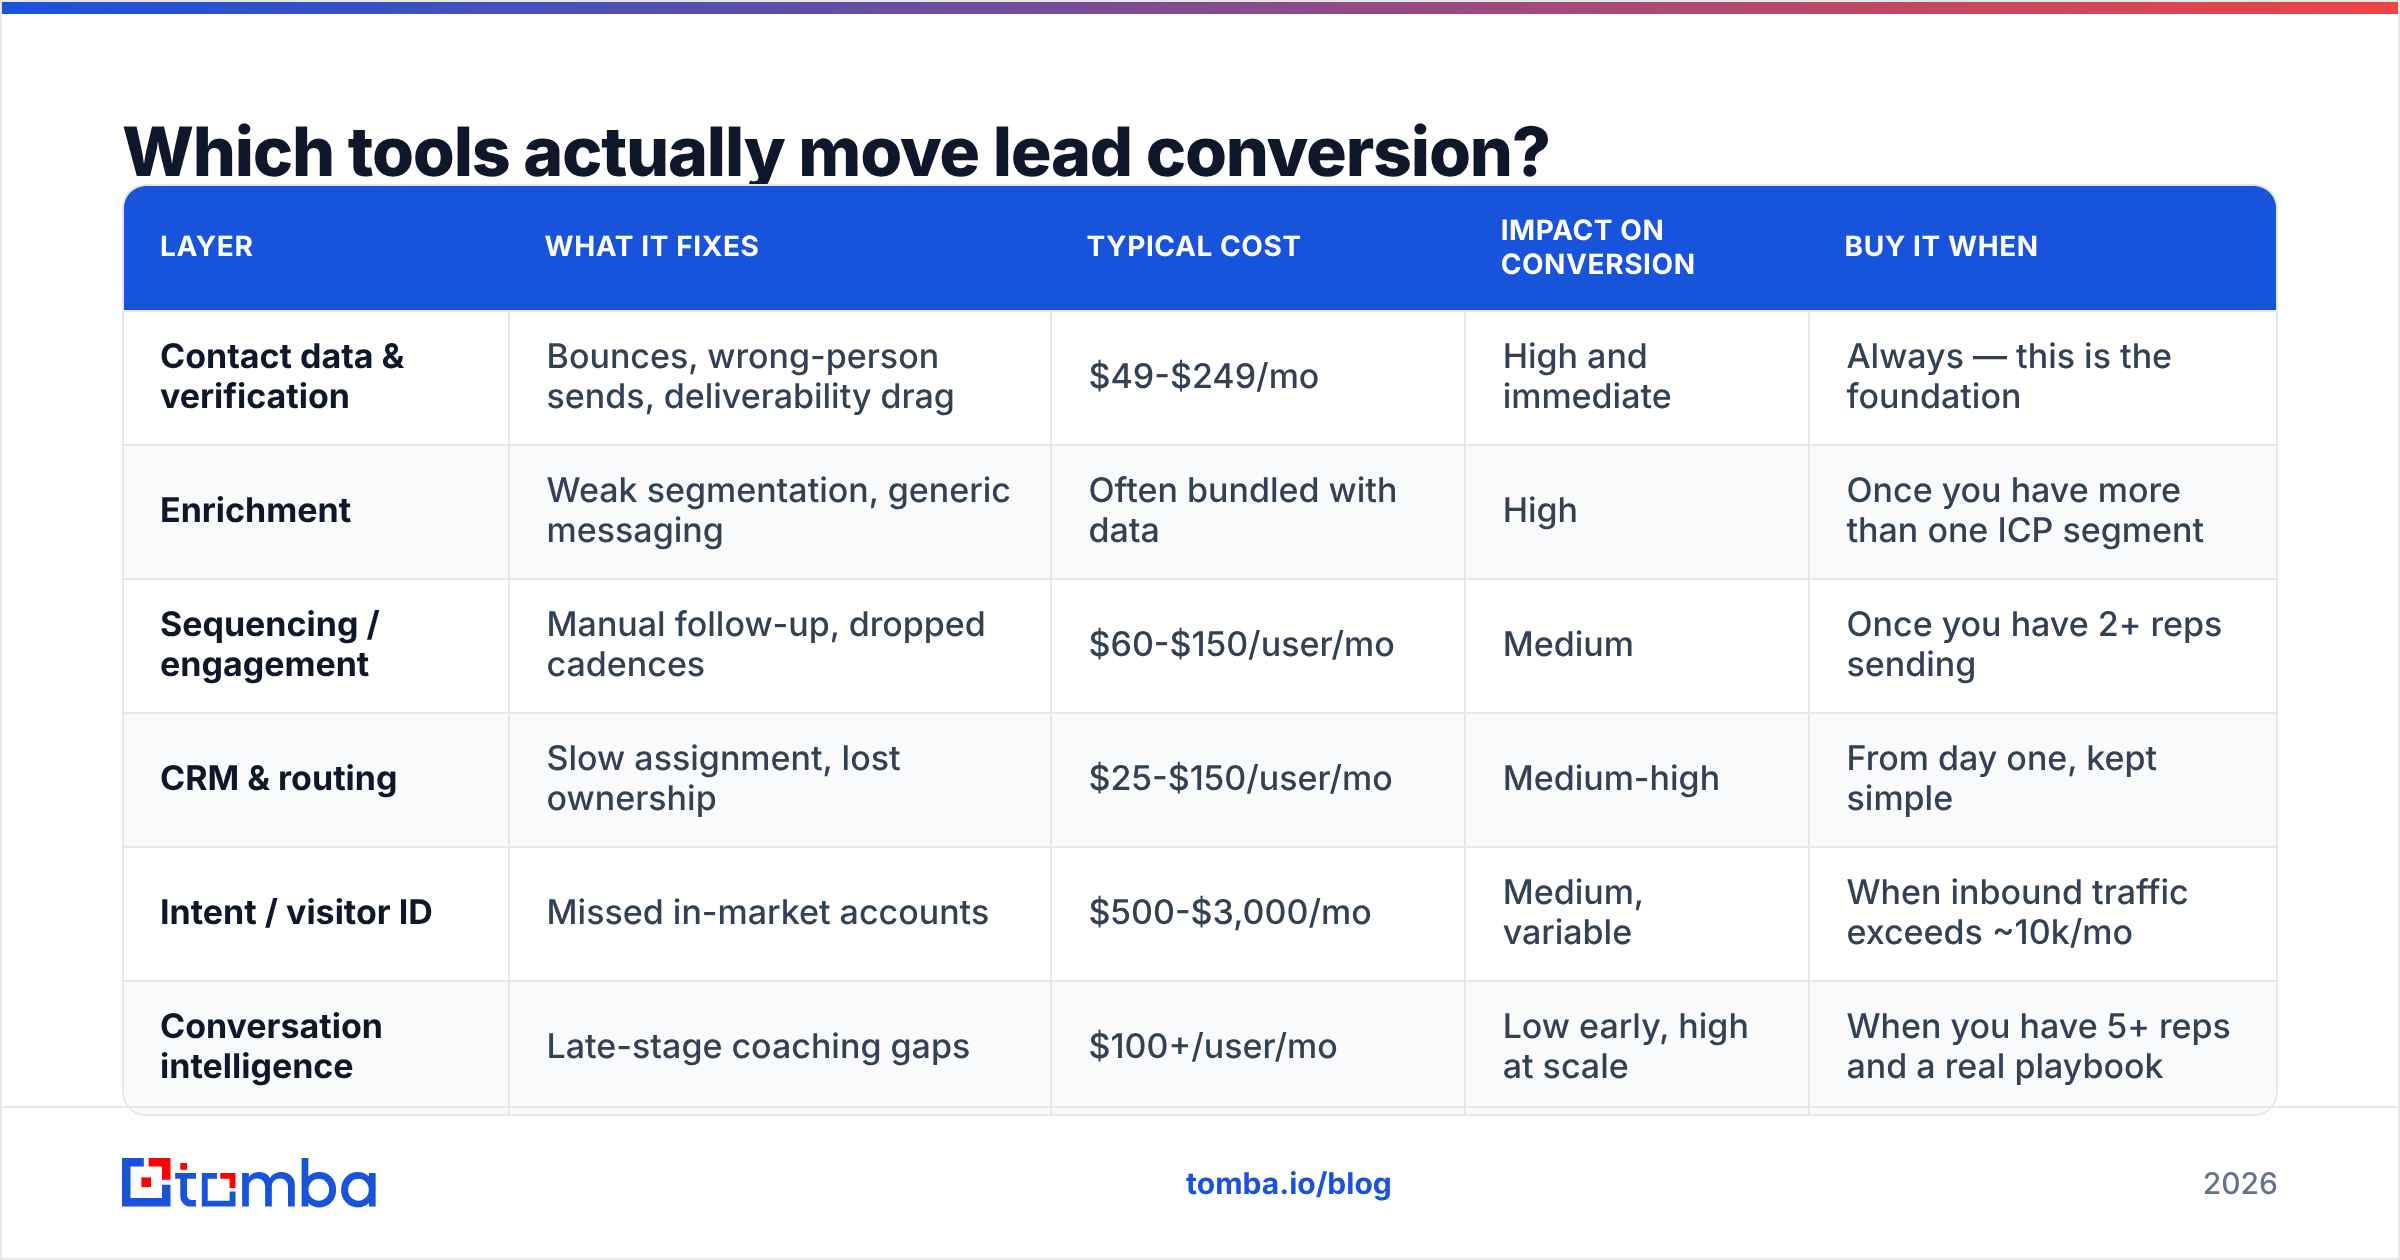
Categories matter more than brands here. Most teams over-buy in the engagement layer and under-buy in the data layer, which is exactly backwards relative to where the leaks are.
| Layer | What it fixes | Typical cost | Impact on conversion | Buy it when |
|---|---|---|---|---|
| Contact data & verification | Bounces, wrong-person sends, deliverability drag | $49-$249/mo | High and immediate | Always — this is the foundation |
| Enrichment | Weak segmentation, generic messaging | Often bundled with data | High | Once you have more than one ICP segment |
| Sequencing / engagement | Manual follow-up, dropped cadences | $60-$150/user/mo | Medium | Once you have 2+ reps sending |
| CRM & routing | Slow assignment, lost ownership | $25-$150/user/mo | Medium-high | From day one, kept simple |
| Intent / visitor ID | Missed in-market accounts | $500-$3,000/mo | Medium, variable | When inbound traffic exceeds ~10k/mo |
| Conversation intelligence | Late-stage coaching gaps | $100+/user/mo | Low early, high at scale | When you have 5+ reps and a real playbook |
If you are comparing specific vendors inside any of these categories, verified buyer reviews on G2 are more useful than vendor comparison pages, including this one — look at the mid-market filter specifically, since enterprise reviews describe a different product experience.
On the data layer, Tomba pricing starts with a free tier at 25 searches per month, then Starter at $49/mo, Growth at $99/mo, and Pro at $249/mo. For a two-to-five person outbound team, the Growth tier generally covers list building and verification for a full quarter of campaigns, which is less than one month of a single engagement-platform seat.
How should you report lead conversion to leadership?#
Report three things and refuse to report a fourth.
- Stage-to-stage rates by source, cohorted by entry month. This is the diagnostic view. It shows where to act.
- Velocity between stages in days. A rising conversion rate with a lengthening cycle is often a sign of over-qualification, not improvement.
- Cost per SQO by source. This is the allocation view. It tells you which channel gets next quarter's budget.
The fourth thing — a single blended conversion percentage tracked over time — should be deleted from the dashboard. It moves for reasons unrelated to performance, it invites the wrong questions, and it has ended more good programmes than any competitor ever has.
One practical note on attribution: if two sources touch the same lead, do not fight about credit in a meeting. Use the same model every month, write it down, and spend the saved argument time on the response-time SLA instead.
Where should you start this week?#
Pull your last outbound campaign. Count the bounces. If the rate is above 3%, your lead conversion problem is not a messaging problem and no amount of rewriting will fix it. Verify the list, enrich the survivors, split them into two segments, and rerun the same copy. Then compare.
Tomba's Email Finder is built for exactly that first step — finding professional email addresses by domain, name, or company, with verification built into the same workflow so the list you hand to your sequencing tool is one you can actually send to. The free tier gives you 25 searches to test it against a list you already know the answers for. Start there, measure the bounce delta, and let the number decide whether the data layer was your bottleneck.
Related guides#
// get started
Find, verify and enrich your first contacts today
Start on the free plan with 25 searches a month, then scale when your team is ready.
Free plan · No credit card required · GDPR & CCPA
Get the Tomba newsletter
Product and data updates
// about the author