Lead Conversion Rate: How to Measure and Improve It in 2026
Most teams calculate lead conversion rate wrong, then optimize the wrong stage. Here is the formula, the benchmarks by channel, and the five fixes that actually move the number.
TL;DR
- Lead conversion rate = (leads that reach the next defined stage ÷ total leads entering that stage) × 100. The stage boundary matters more than the formula.
- A single blended number is close to useless. Split it by stage, by channel, and by segment or you will optimize the wrong thing.
- Realistic 2026 B2B benchmarks: 25-40% MQL→SQL, 15-30% SQL→opportunity, 15-25% opportunity→closed-won. Blended visitor-to-customer sits near 1-3% for most SaaS.
- The two cheapest levers are almost always data quality (bad contact data silently kills 20-30% of outbound leads) and speed-to-lead (responding inside five minutes can multiply qualification odds).
- Fix the leakiest stage first. Improving a 12% stage to 18% beats squeezing a 40% stage to 42% every time.
What is lead conversion rate, exactly?#
Lead conversion rate is the percentage of leads that move from one defined stage to the next within a set time window.
The formula is trivial:
Lead conversion rate = (Leads converted ÷ Total leads) × 100The hard part is the denominator. "Total leads" means something different to every team in the building. Marketing counts form fills. Sales counts people who answered the phone. RevOps counts CRM records with a lifecycle stage. When those three numbers disagree by 40%, arguing about the conversion rate is pointless.
Think of it like a restaurant measuring its "table conversion rate." Do you count everyone who walked past the window, everyone who looked at the menu outside, everyone who sat down, or everyone who ordered? Each denominator produces a wildly different percentage, and each one tells you about a different problem. Walk-past-to-menu-reader is a signage problem. Seated-to-ordered is a menu or server problem. You cannot fix either one with a single blended number.
So before you calculate anything, write down three things:
- The entry event — what specific action or attribute puts a record in the denominator (form submitted, demo requested, enriched and verified contact added to a sequence).
- The conversion event — what puts a record in the numerator (stage change in CRM, meeting booked and held, contract signed).
- The attribution window — 30, 60, or 90 days. Without it, your rate creeps upward forever as old leads trickle in and your month-over-month comparisons become meaningless.
Which lead conversion rates should you actually track?#
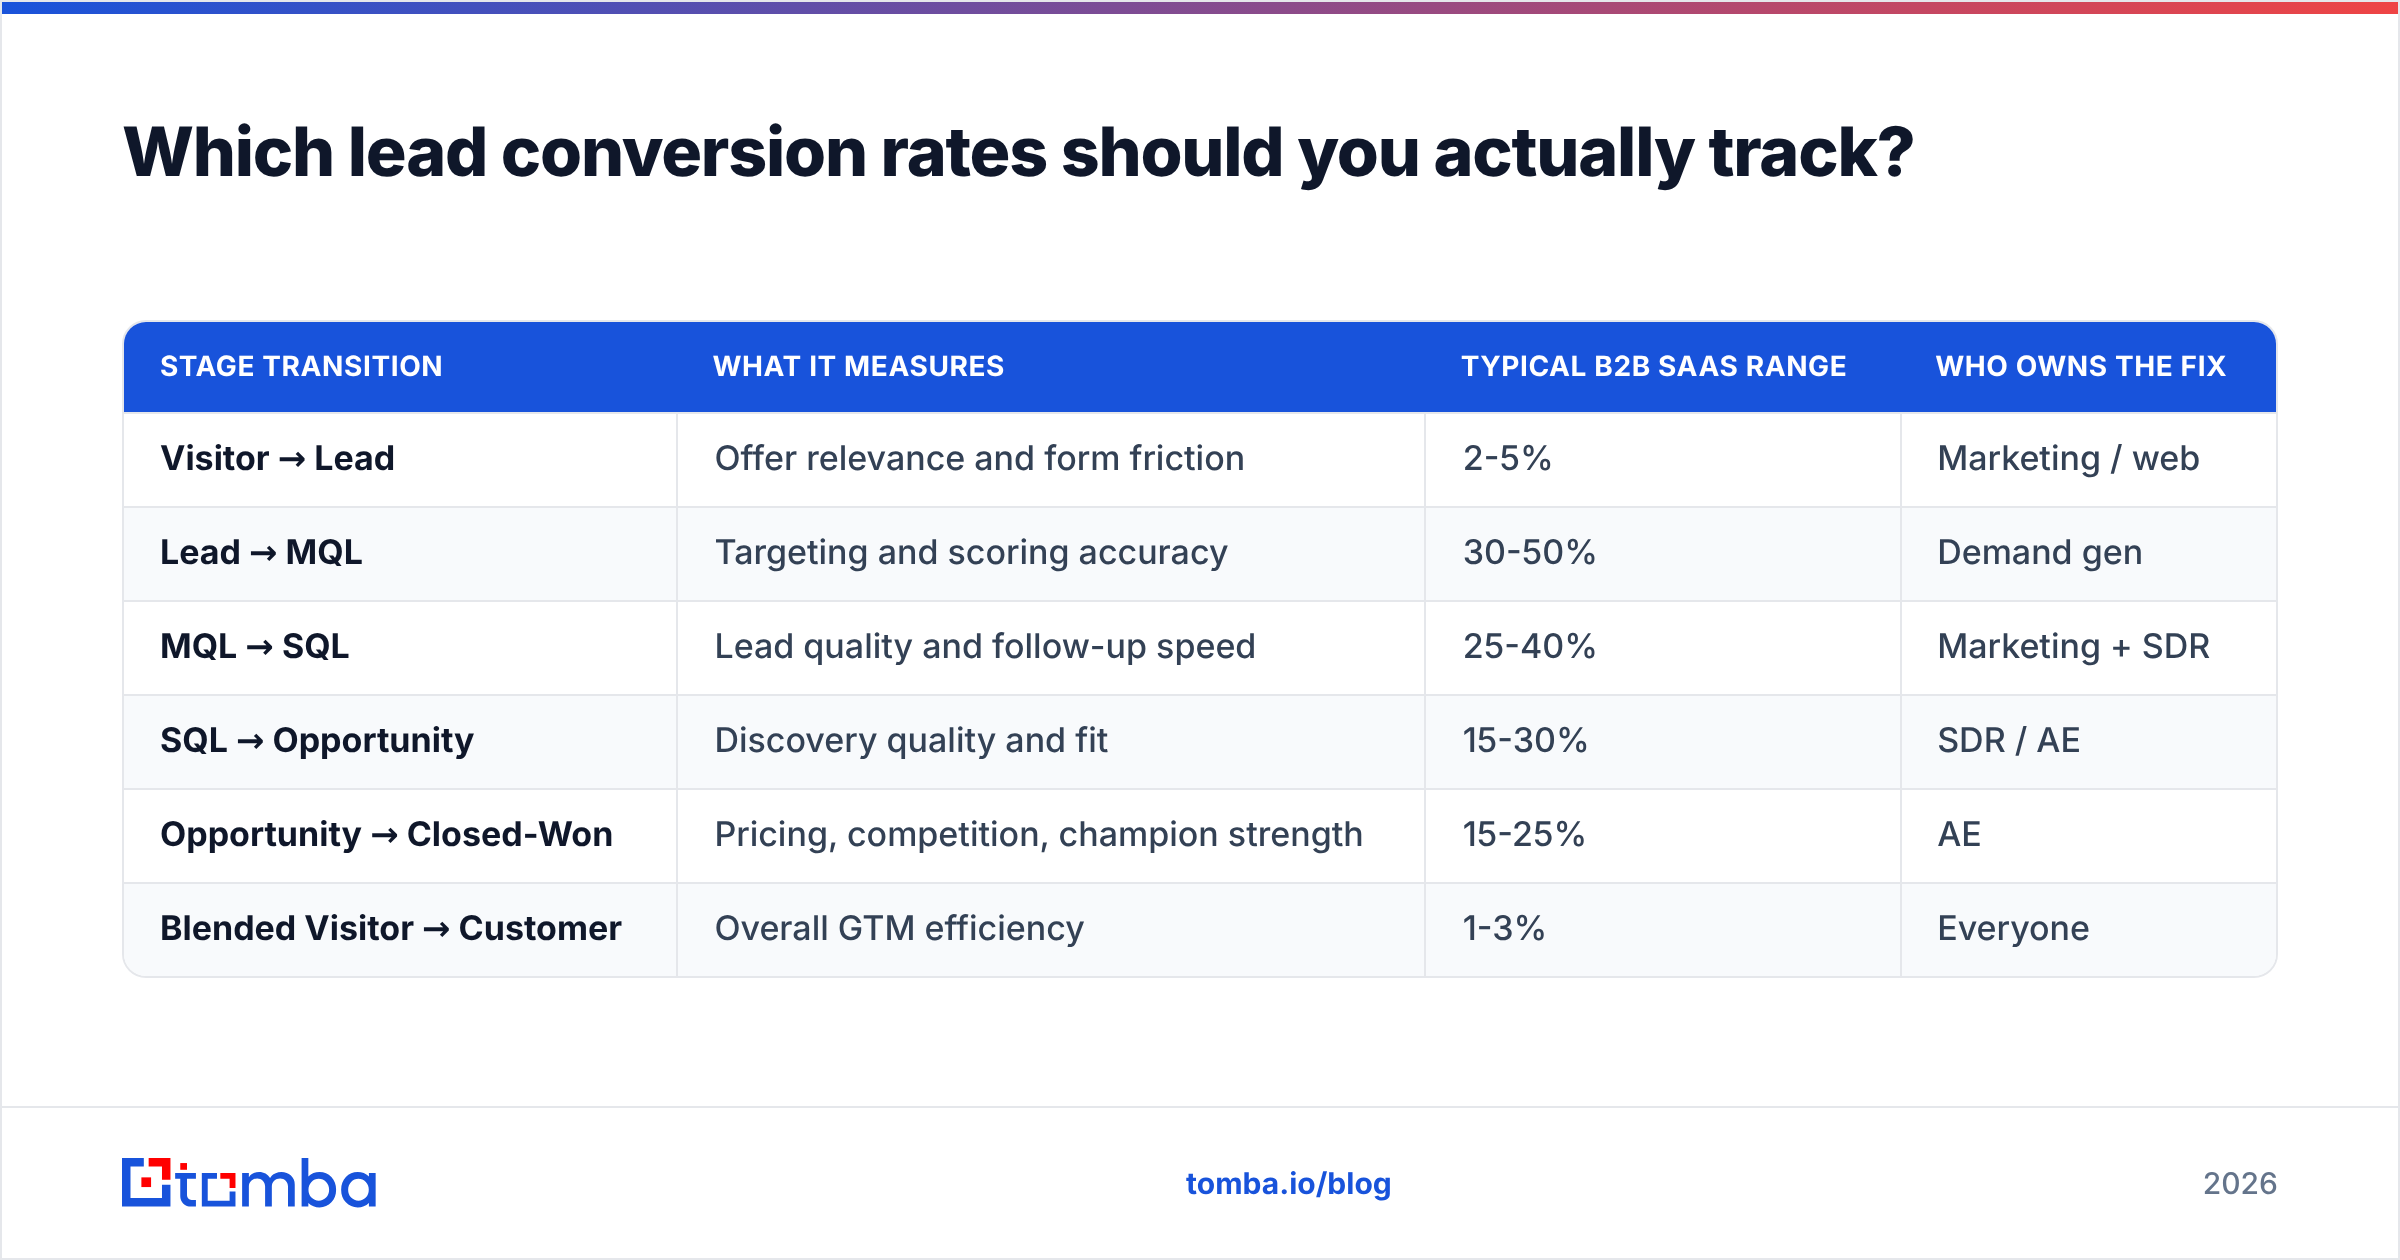
Track the funnel as a chain of stage-to-stage rates, not one headline number. Here is the standard B2B chain and what each rate is actually telling you.
| Stage transition | What it measures | Typical B2B SaaS range | Who owns the fix |
|---|---|---|---|
| Visitor → Lead | Offer relevance and form friction | 2-5% | Marketing / web |
| Lead → MQL | Targeting and scoring accuracy | 30-50% | Demand gen |
| MQL → SQL | Lead quality and follow-up speed | 25-40% | Marketing + SDR |
| SQL → Opportunity | Discovery quality and fit | 15-30% | SDR / AE |
| Opportunity → Closed-Won | Pricing, competition, champion strength | 15-25% | AE |
| Blended Visitor → Customer | Overall GTM efficiency | 1-3% | Everyone |
Two notes on reading that table. First, these are ranges across mid-market B2B SaaS, not laws of physics — PLG motions, enterprise ACVs above $100k, and transactional SMB sales all sit outside them. Second, a rate being "in range" does not mean it is healthy for you. The only benchmark that matters long-term is your own trailing six-month median, segmented by channel.
Channel segmentation is where most of the insight lives. A blended 22% MQL→SQL rate can easily hide a 45% rate from referrals and a 6% rate from a paid content syndication vendor you are still paying for. Industry analysts at Gartner have made this point for years: aggregate funnel metrics tend to mask the exact channel-level variance you need to act on.
Why is your lead conversion rate lower than it should be?#
Nine times out of ten it is one of these five causes, roughly in order of how often they show up and how cheap they are to fix.
- Bad contact data. You cannot convert a lead you cannot reach. Bounced emails, dead direct dials, and stale job titles remove leads from the funnel before a human ever touches them — and they do it invisibly, because the CRM still shows the record as "worked." B2B data decays fast; a meaningful share of a year-old list is wrong by the time you use it.
- Slow follow-up. The classic lead response research — popularized in the Harvard Business Review study on online sales leads — found that contacting a lead within an hour makes meaningful qualification dramatically more likely than waiting 24 hours. The curve is steep at the front. Minutes matter more than days.
- Scoring that measures interest, not fit. If your model rewards ebook downloads, you will fill the SQL stage with students, competitors, and consultants. Weight firmographic fit and buying-committee signals above content consumption.
- Stage definitions nobody enforces. When AEs can push an unqualified SQL into "opportunity" to look busy, your opportunity→won rate craters and you will misdiagnose it as a closing problem.
- Offer-to-audience mismatch. A "book a demo" CTA served to someone in problem-awareness stage converts at a fraction of a "see a 3-minute teardown" CTA. This is a messaging fix, not a process fix.
Most teams jump straight to number five because it is the fun one. Start with one and two. They are mechanical, measurable, and usually worth more percentage points.
How do you fix the data-quality leak first?#
Verify and enrich before the lead ever enters a sequence, not after it bounces.
The mechanics are straightforward. For inbound leads, enrich the record at form-submit time so routing and scoring both have firmographics to work with. For outbound, verify every address before it hits your sending infrastructure — bounces above roughly 2-3% start damaging sender reputation, which then depresses deliverability for your good leads too. That is the part teams miss: a dirty list does not just waste the bad records, it degrades the results of the clean ones.
A practical pre-send checklist:
- Deduplicate the list against your CRM so you do not cold-email an existing customer or an open opportunity.
- Verify every address with an email verifier and drop anything that returns invalid.
- Handle catch-all domains separately — they neither confirm nor deny. Run them through a catch-all verifier rather than treating them as valid or discarding them wholesale.
- Enrich missing fields (title, headcount, tech stack) so your scoring model has something real to score with data enrichment.
- Re-verify on a schedule — quarterly for active lists, before every campaign for anything older than 90 days.
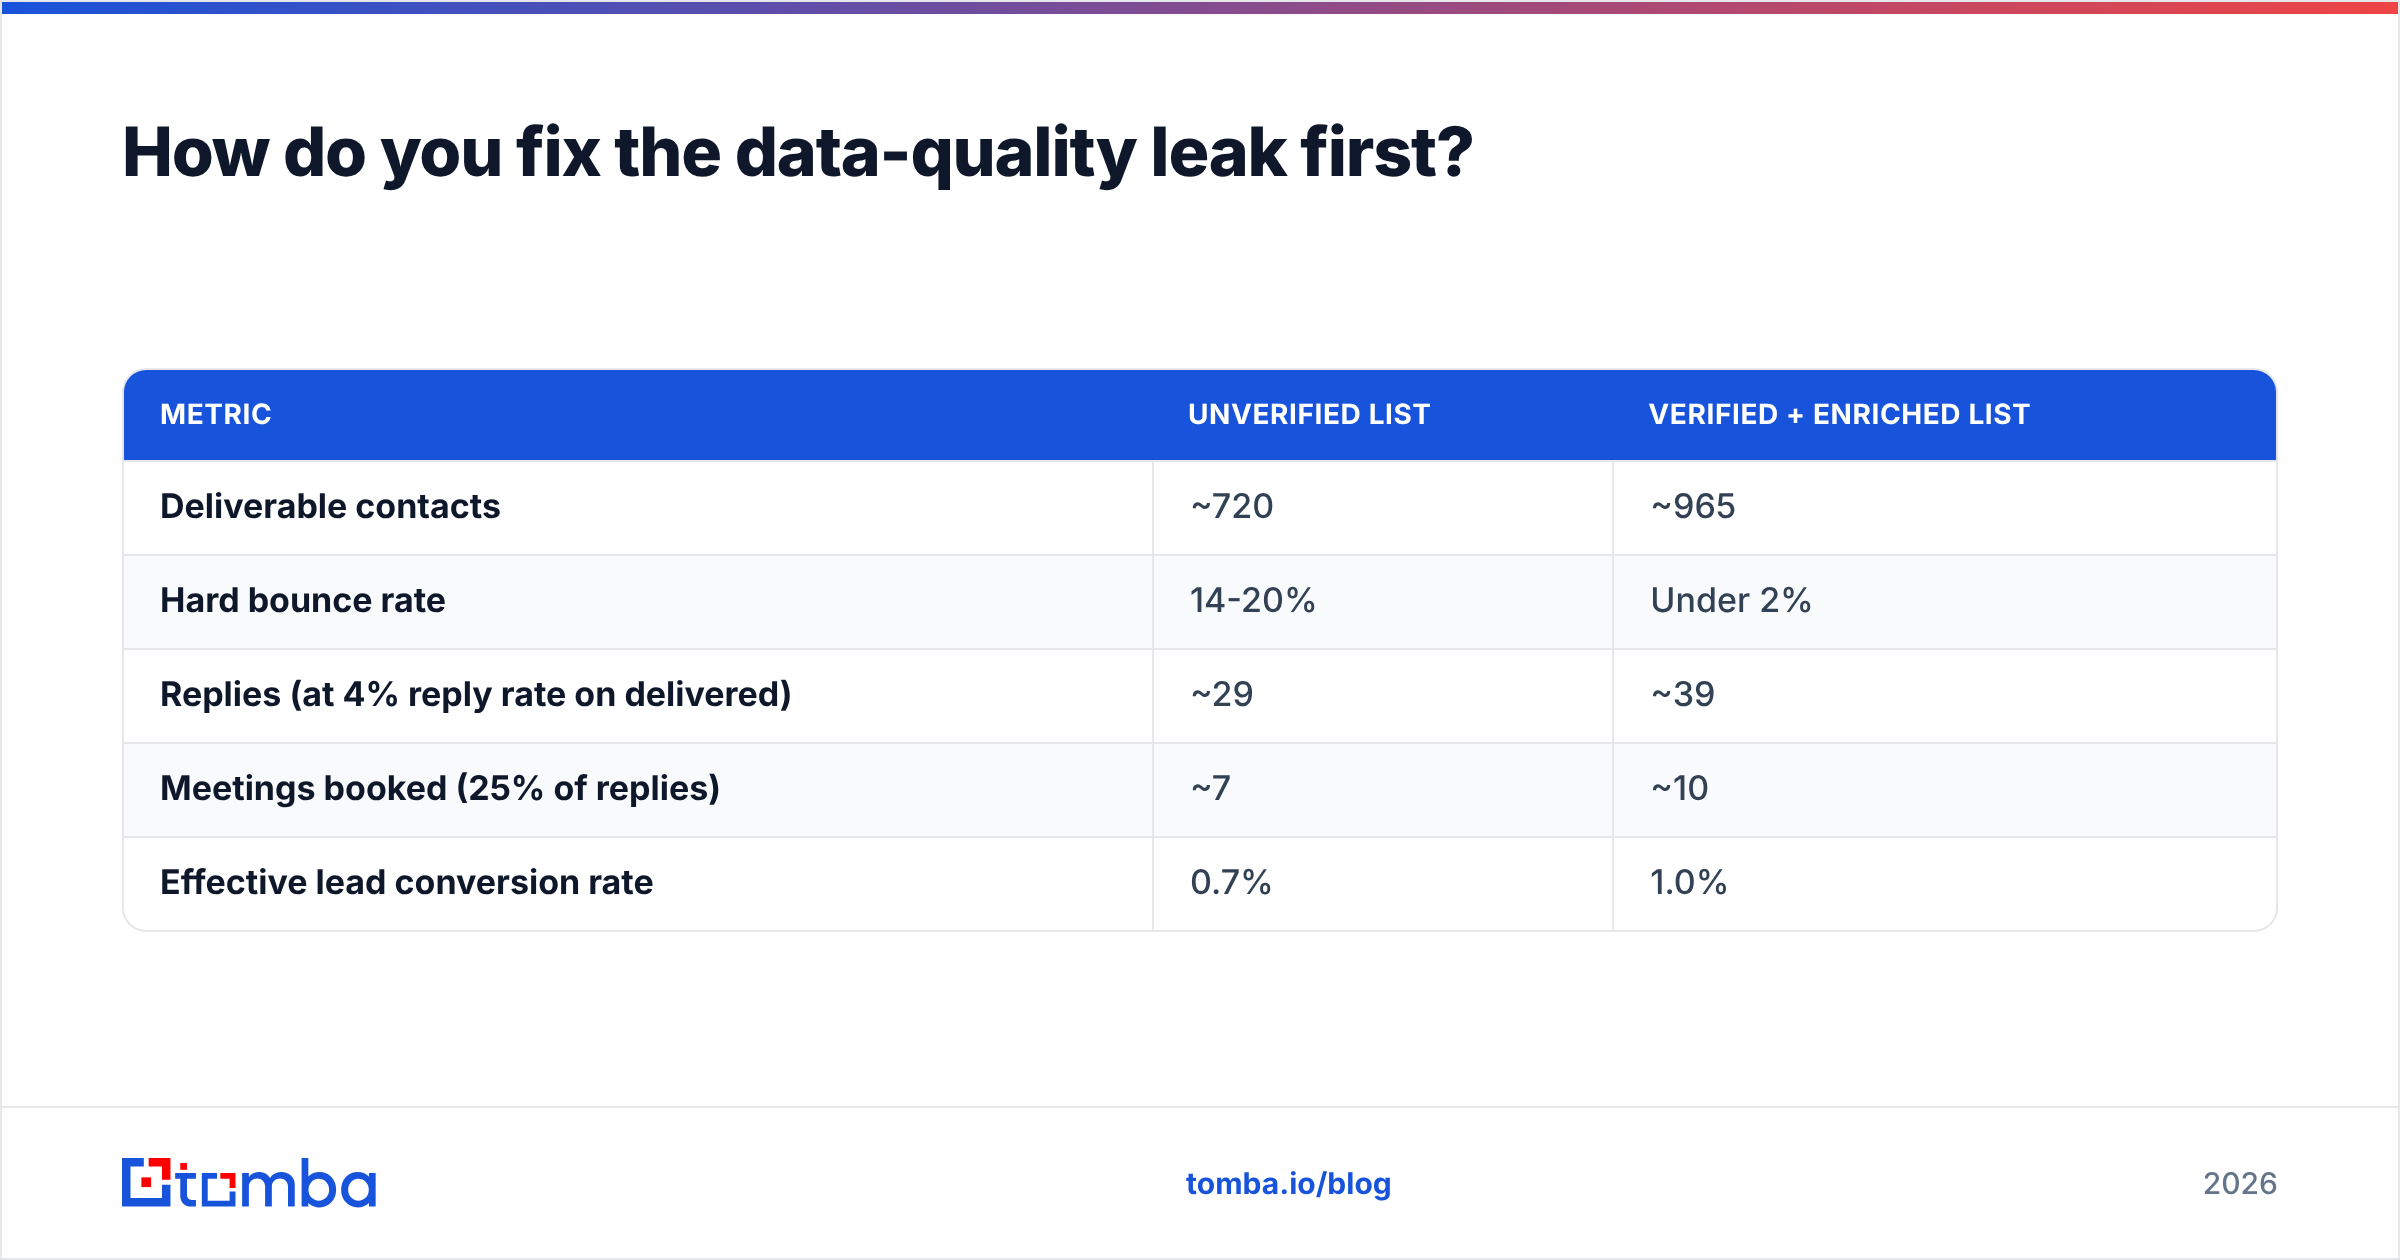
Here is how the same 1,000-lead outbound list behaves with and without a verification step. The numbers are illustrative, but the shape is what you will see in practice:
| Metric | Unverified list | Verified + enriched list |
|---|---|---|
| Deliverable contacts | ~720 | ~965 |
| Hard bounce rate | 14-20% | Under 2% |
| Replies (at 4% reply rate on delivered) | ~29 | ~39 |
| Meetings booked (25% of replies) | ~7 | ~10 |
| Effective lead conversion rate | 0.7% | 1.0% |
That is a ~40% lift in booked meetings from a preprocessing step that costs a fraction of a cent per record — no new copy, no new channel, no new headcount. It is the least glamorous optimization in B2B and reliably one of the highest-return.
How do you improve speed-to-lead without adding headcount?#
Automate routing and the first touch; reserve humans for the second.
Measure your current median speed-to-lead before doing anything else. Not the average — the median, and then the 90th percentile. Averages hide the weekend leads that sat for 62 hours. If your p90 is above four hours, routing is your problem, not effort.
Three fixes, cheapest first:
- Round-robin routing with fallback. If the assigned rep does not touch the lead in 15 minutes, it reassigns. Every major CRM supports this; most teams have never turned it on.
- Instant acknowledgment with real scheduling. An auto-reply that contains a calendar link converts materially better than one that says "we'll be in touch." Let the motivated buyer self-serve the meeting.
- Pre-touch enrichment. When the rep opens the record, the company size, funding stage, and a direct line should already be there. Twenty minutes of manual research per lead is twenty minutes not spent calling. Pulling a verified phone finder number alongside the email at intake removes that tax entirely.

What does a good lead conversion rate look like by channel?#
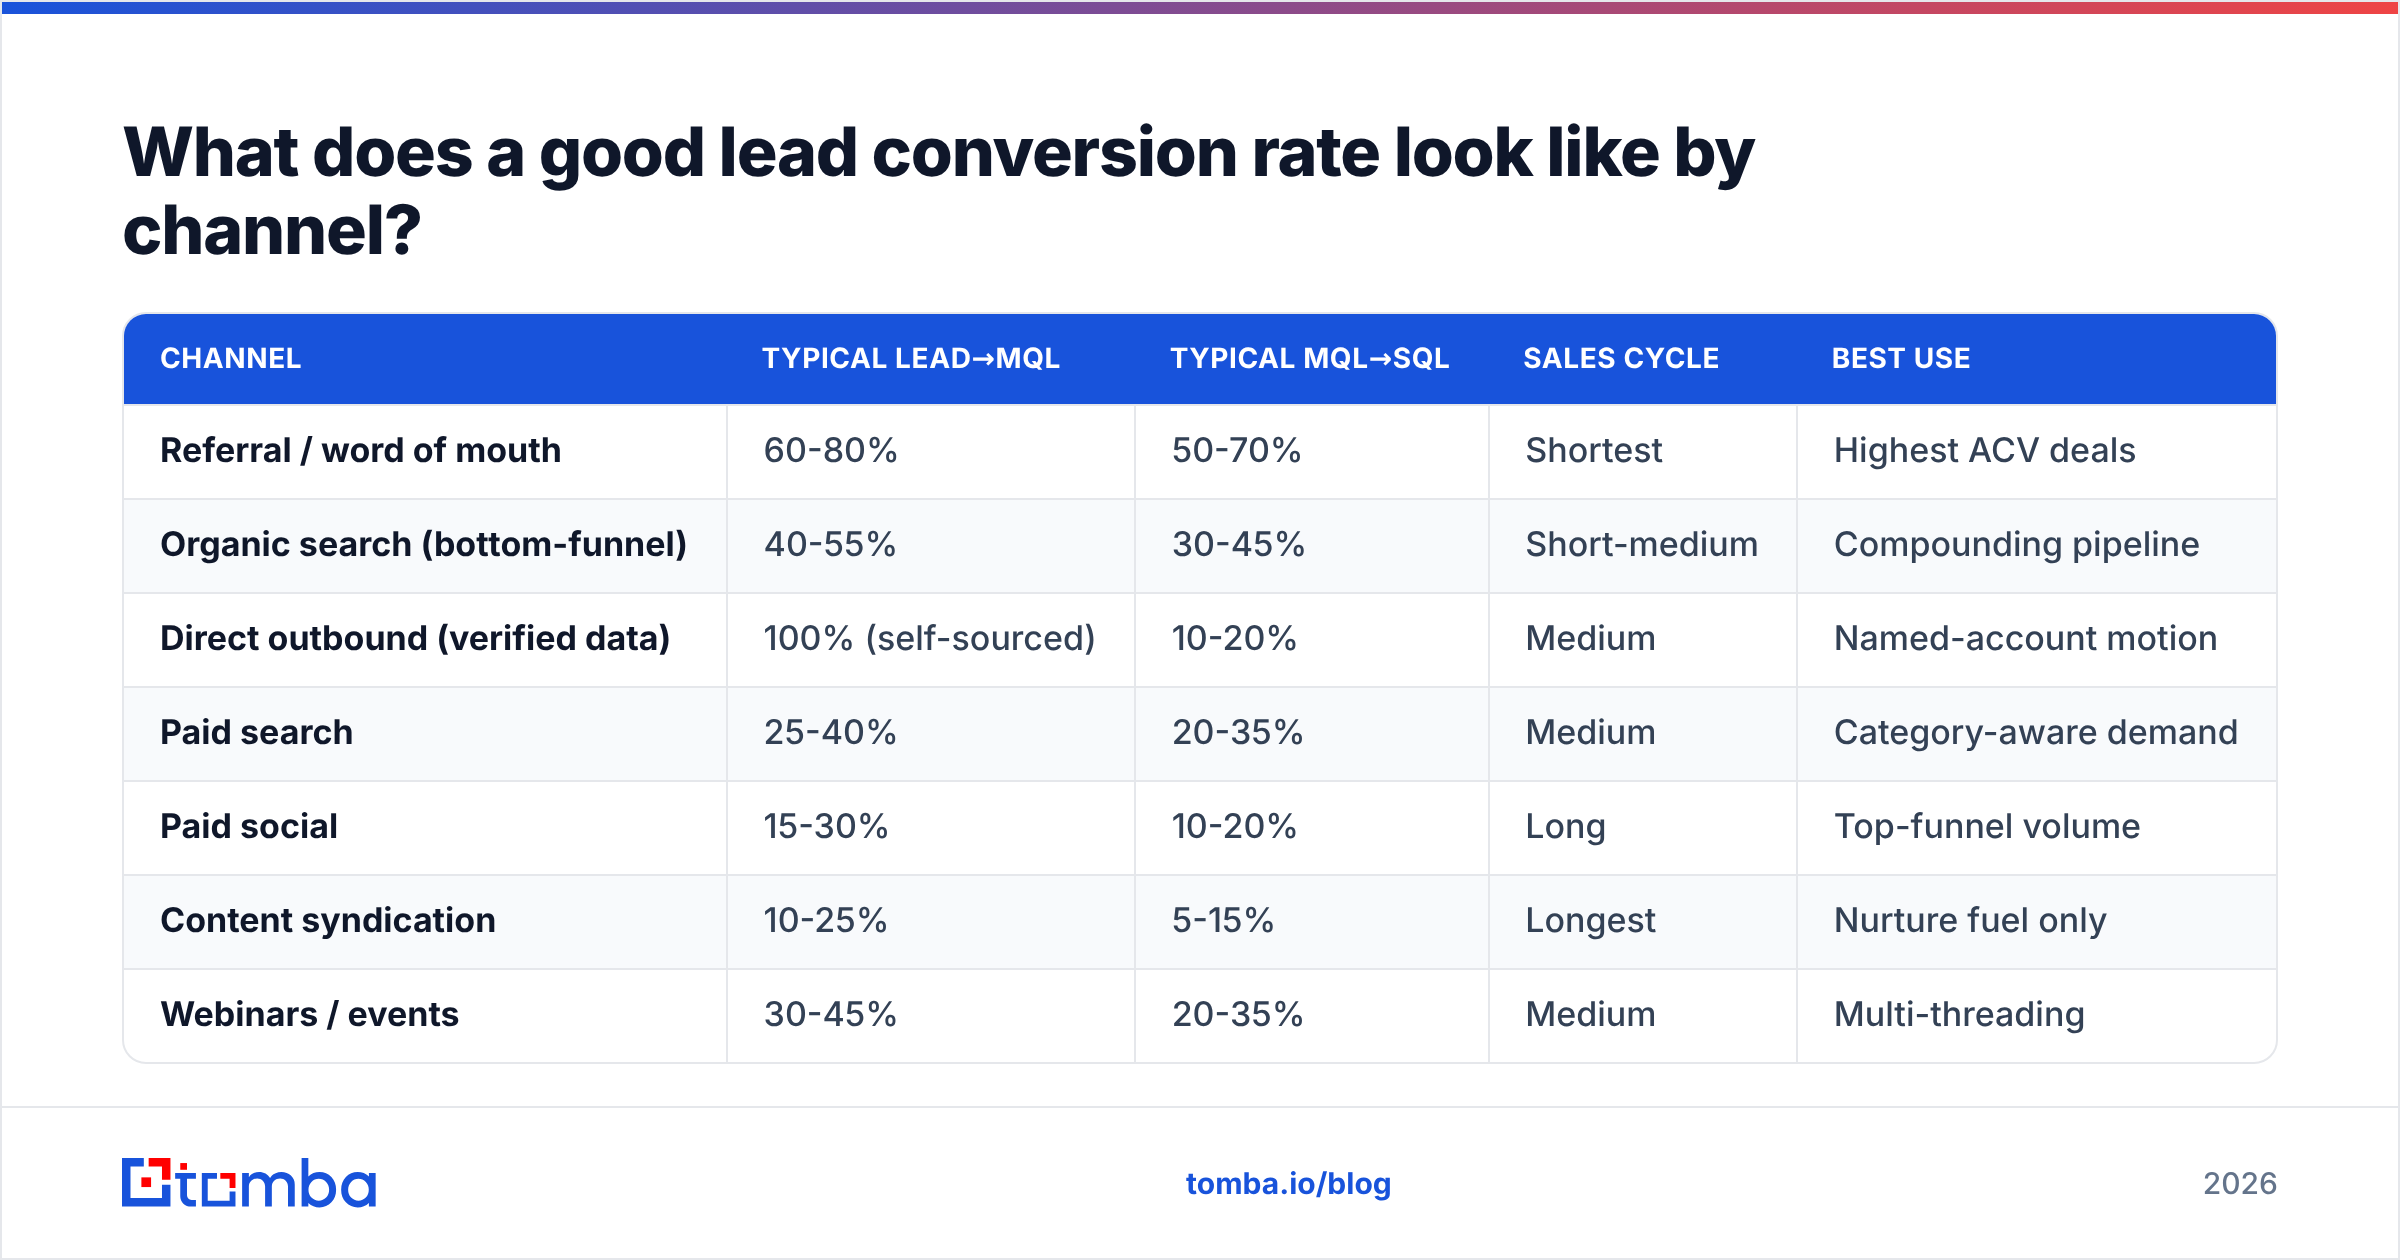
Channel determines expectation far more than industry does. Judge each source against itself.
| Channel | Typical Lead→MQL | Typical MQL→SQL | Sales cycle | Best use |
|---|---|---|---|---|
| Referral / word of mouth | 60-80% | 50-70% | Shortest | Highest ACV deals |
| Organic search (bottom-funnel) | 40-55% | 30-45% | Short-medium | Compounding pipeline |
| Direct outbound (verified data) | 100% (self-sourced) | 10-20% | Medium | Named-account motion |
| Paid search | 25-40% | 20-35% | Medium | Category-aware demand |
| Paid social | 15-30% | 10-20% | Long | Top-funnel volume |
| Content syndication | 10-25% | 5-15% | Longest | Nurture fuel only |
| Webinars / events | 30-45% | 20-35% | Medium | Multi-threading |
Outbound is the odd one out: every contact is technically an MQL because you chose it, so the meaningful measure starts at reply-to-meeting. Which is exactly why outbound lives or dies on list quality — your targeting is your qualification step. Independent review data on G2 shows the same pattern across lead-capture and data tooling: teams that gate list building on verification report cleaner downstream funnel numbers than teams that gate on volume.
For buying-data comparisons, it is worth noting that not every provider serves the same motion. Prospecting platforms like BookYourData lean toward pre-built, pay-as-you-go list purchase — useful when you want volume in a defined ICP fast. Search-and-verify tools like Tomba lean toward building targeted lists account-by-account from a domain search or a name-plus-company lookup. Both are legitimate; the right pick depends on whether your bottleneck is coverage or precision.
How do you build a lead conversion reporting cadence that people use?#
Report stage-to-stage rates weekly, cohorted by entry month, segmented by channel. Three rules keep it honest:
Cohort, do not snapshot. A snapshot of "this month's conversion rate" mixes leads created yesterday with leads created in March. Group leads by the month they entered, then watch each cohort mature. It is slower to read and dramatically more truthful.
Show absolute counts next to percentages. A stage that improved from 20% to 35% on a base of 17 leads is noise. Force the denominator into the same view and most false alarms disappear.
Name an owner per transition. Every rate in your funnel table needs one person accountable. Unowned metrics get discussed for two quarters and then quietly dropped from the deck.
One more discipline worth adopting: pick a single "north star" transition each quarter and leave the rest alone. If MQL→SQL is your leak, the entire quarter's experiments — scoring weights, routing rules, SDR scripts, data enrichment — point at that one transition. Teams that optimize six stages at once learn nothing from any of them, because every result is confounded by four other changes.
What tools change the number fastest?#
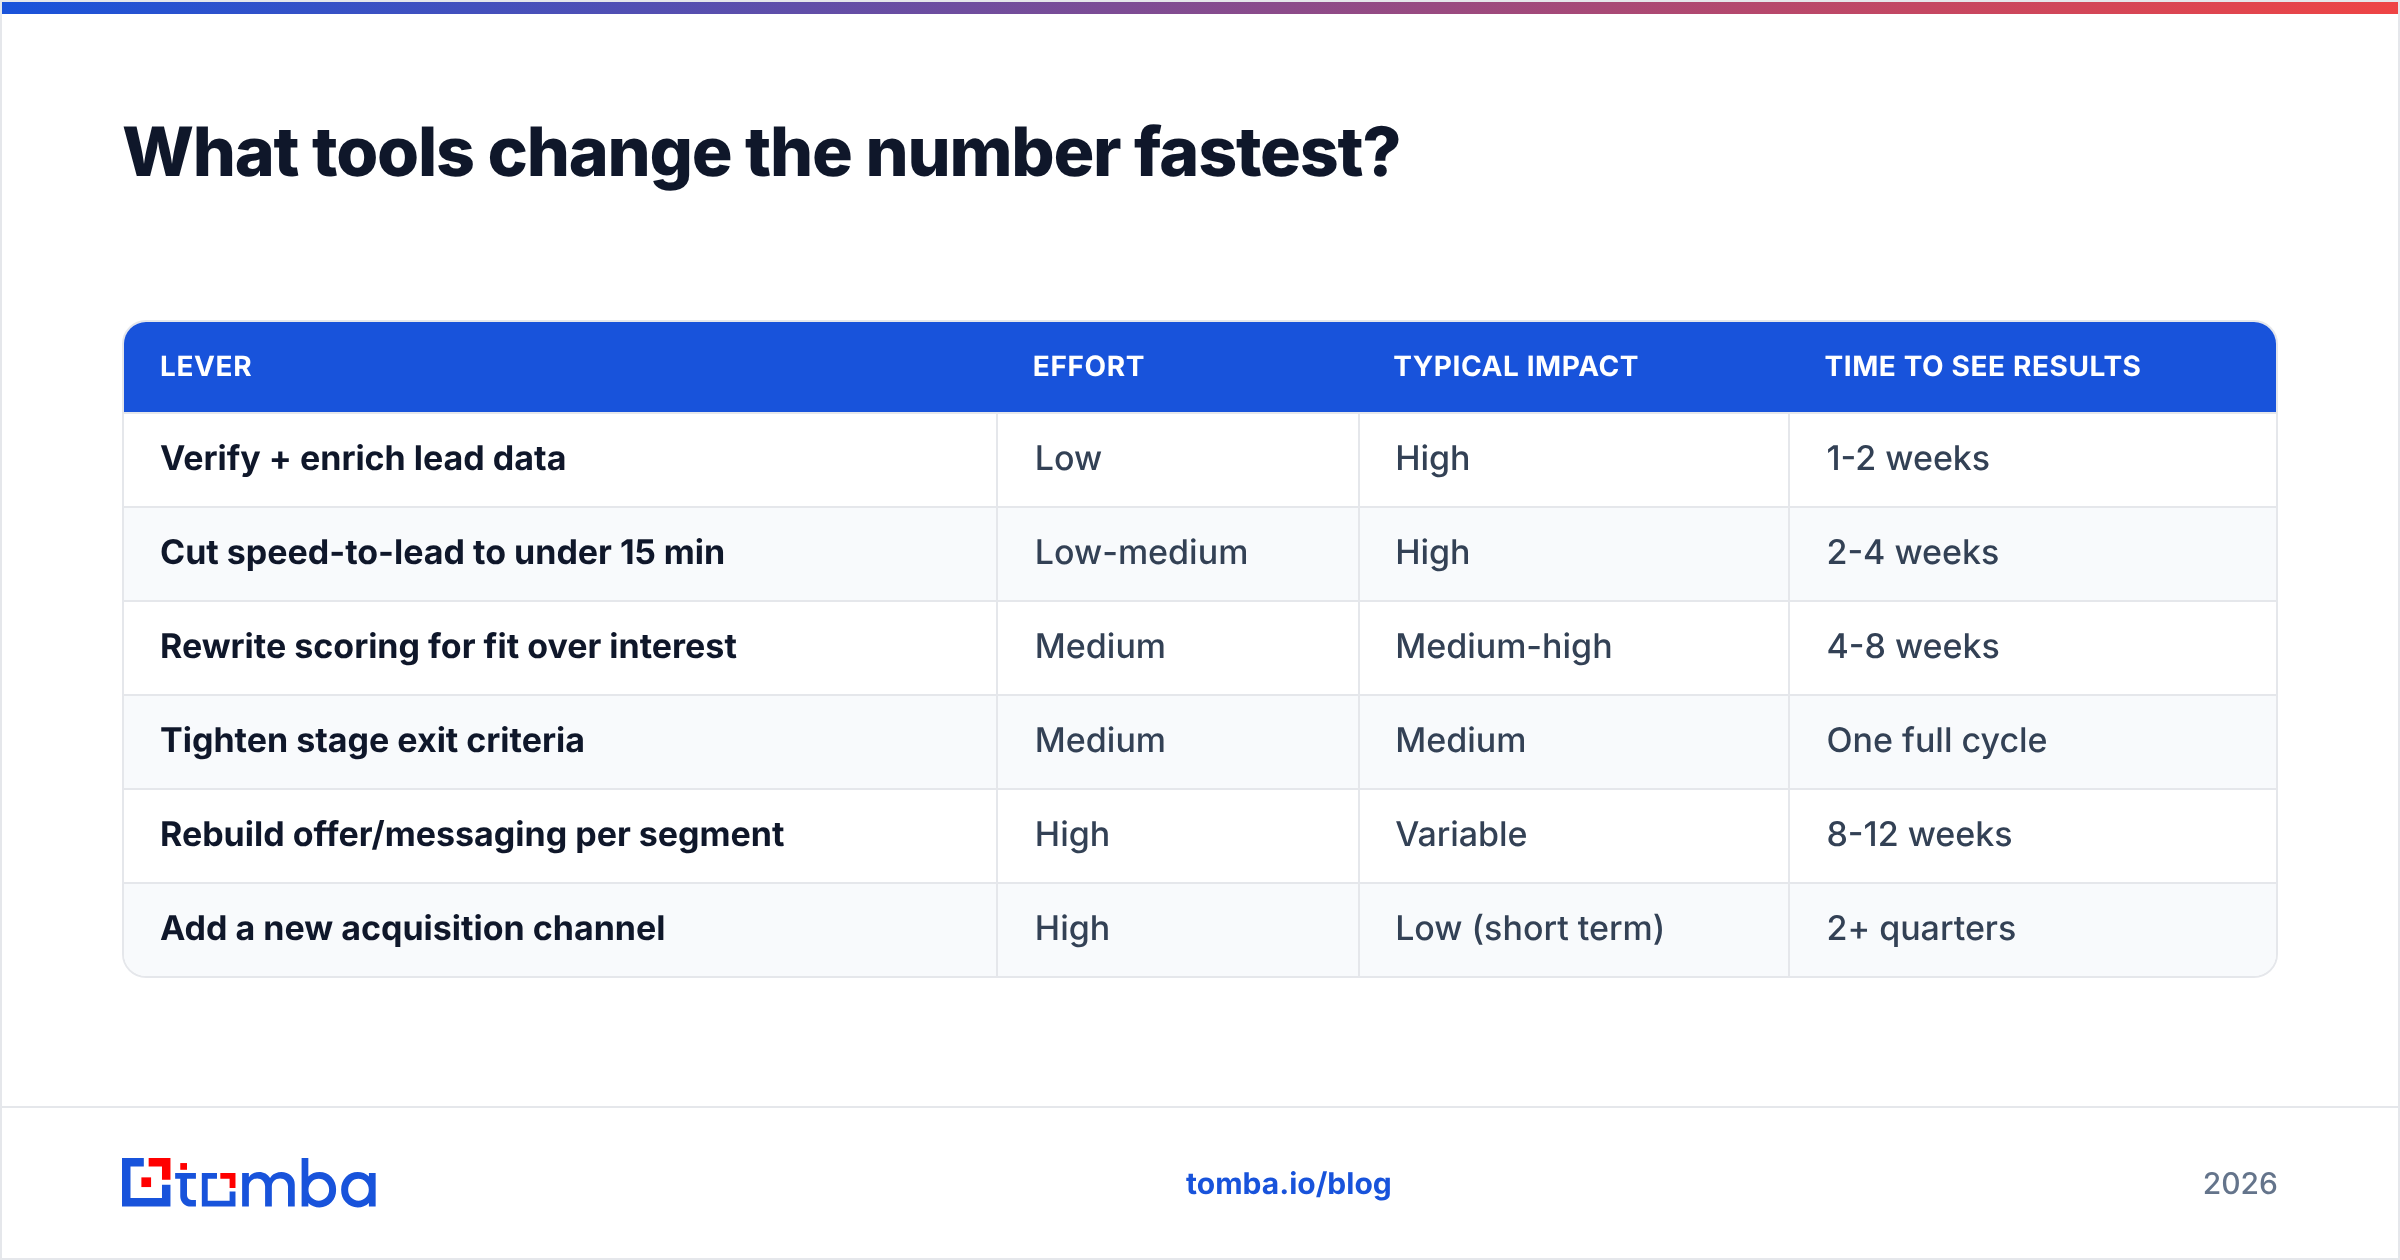
Ranked by effort-to-impact for a typical 5-20 person revenue team:
| Lever | Effort | Typical impact | Time to see results |
|---|---|---|---|
| Verify + enrich lead data | Low | High | 1-2 weeks |
| Cut speed-to-lead to under 15 min | Low-medium | High | 2-4 weeks |
| Rewrite scoring for fit over interest | Medium | Medium-high | 4-8 weeks |
| Tighten stage exit criteria | Medium | Medium | One full cycle |
| Rebuild offer/messaging per segment | High | Variable | 8-12 weeks |
| Add a new acquisition channel | High | Low (short term) | 2+ quarters |
The pattern holds across nearly every team we see: the top two rows are cheap, fast, and boring, and they are where the points are. The bottom two are expensive, slow, and much more interesting to talk about in a QBR. Do the boring ones first.
If you want a concrete starting point, run your last 500 unworked leads through a verification pass and measure what percentage comes back invalid or catch-all. Whatever that number is, it is currently a straight subtraction from your lead conversion rate — and it is the easiest thing on this page to fix.
Where should you start this week?#
Pick your leakiest stage, instrument it properly, and clean the data feeding it.
Concretely: export the last 90 days of leads, group by channel and entry month, calculate each stage transition with a fixed 60-day window, and circle the worst-performing transition on the biggest-volume channel. That single cell is your quarter. Everything else can wait.
Clean data is the prerequisite for all of it — you cannot measure a funnel accurately when a fifth of the records were never reachable in the first place. Start there: use the Tomba Email Finder to build verified, enriched lead lists from a domain or a name, so every record entering your funnel is one a rep can actually reach. The free tier covers 25 searches a month to test the workflow on a real list, and paid Tomba plans start at $49/mo when you are ready to run it at volume. Fix the denominator, and the conversion rate takes care of itself.
Related guides#
// get started
Find, verify and enrich your first contacts today
Start on the free plan with 25 searches a month, then scale when your team is ready.
Free plan · No credit card required · GDPR & CCPA
Get the Tomba newsletter
Product and data updates
// about the author