Lead Conversion Rate Benchmarks: 2026 Data by Channel
Most teams compare their funnel to a number they found on a slide deck. Here are realistic lead conversion rate benchmarks by channel, stage, and deal size — plus how to tell a weak funnel from bad data.
TL;DR
- There is no single "good" lead conversion rate. A 2% visitor-to-lead rate on organic traffic and a 2% reply-to-meeting rate on cold outbound are completely different animals, and averaging them destroys the signal.
- Across B2B, the ranges that hold up most consistently: visitor → lead 1.5–4%, lead → MQL 20–35%, MQL → SQL 12–25%, SQL → closed-won 15–30%. End to end, most B2B teams land between 0.5% and 3% from raw lead to customer.
- Channel matters more than industry. Referral and partner leads convert 3–5x better than paid social at every stage, and they always will.
- Before you blame your SDRs, audit your data. A list with 20% invalid or role-based addresses mechanically caps your conversion rate no matter how good the messaging is.
- Benchmarks are a diagnostic, not a target. Compare yourself to your own trailing 90 days first, then to the channel median.
What actually counts as a lead conversion rate?#
A lead conversion rate is the percentage of records that move from one funnel stage to the next. That's it. The problem is that "lead" means something different in every company, so two teams reporting "our lead conversion rate is 12%" may be measuring things that share nothing but a label.
Think of it like restaurant covers. One place counts a "customer" when someone walks in the door; another counts only when someone sits and orders. Both report "conversion," both are honest, and the numbers are not comparable.
In practice you are measuring one of four different things:
- Visitor → lead — anonymous traffic that submits a form, books a demo, or starts a trial. This is a website and offer metric, not a sales metric.
- Lead → MQL — raw contacts that clear a scoring threshold. Depends entirely on how loose your marketing qualified lead definition is.
- MQL → SQL — leads that sales actually accepts and works. This is the single most diagnostic ratio in the whole funnel.
- SQL → closed-won — your true win rate, and the number your CFO cares about.
When someone quotes a benchmark without saying which of those four they mean, the number is decoration. When you build your own dashboard, label every stage explicitly and never report a blended "conversion rate" without the denominator next to it.

What are the average lead conversion rate benchmarks by channel?#
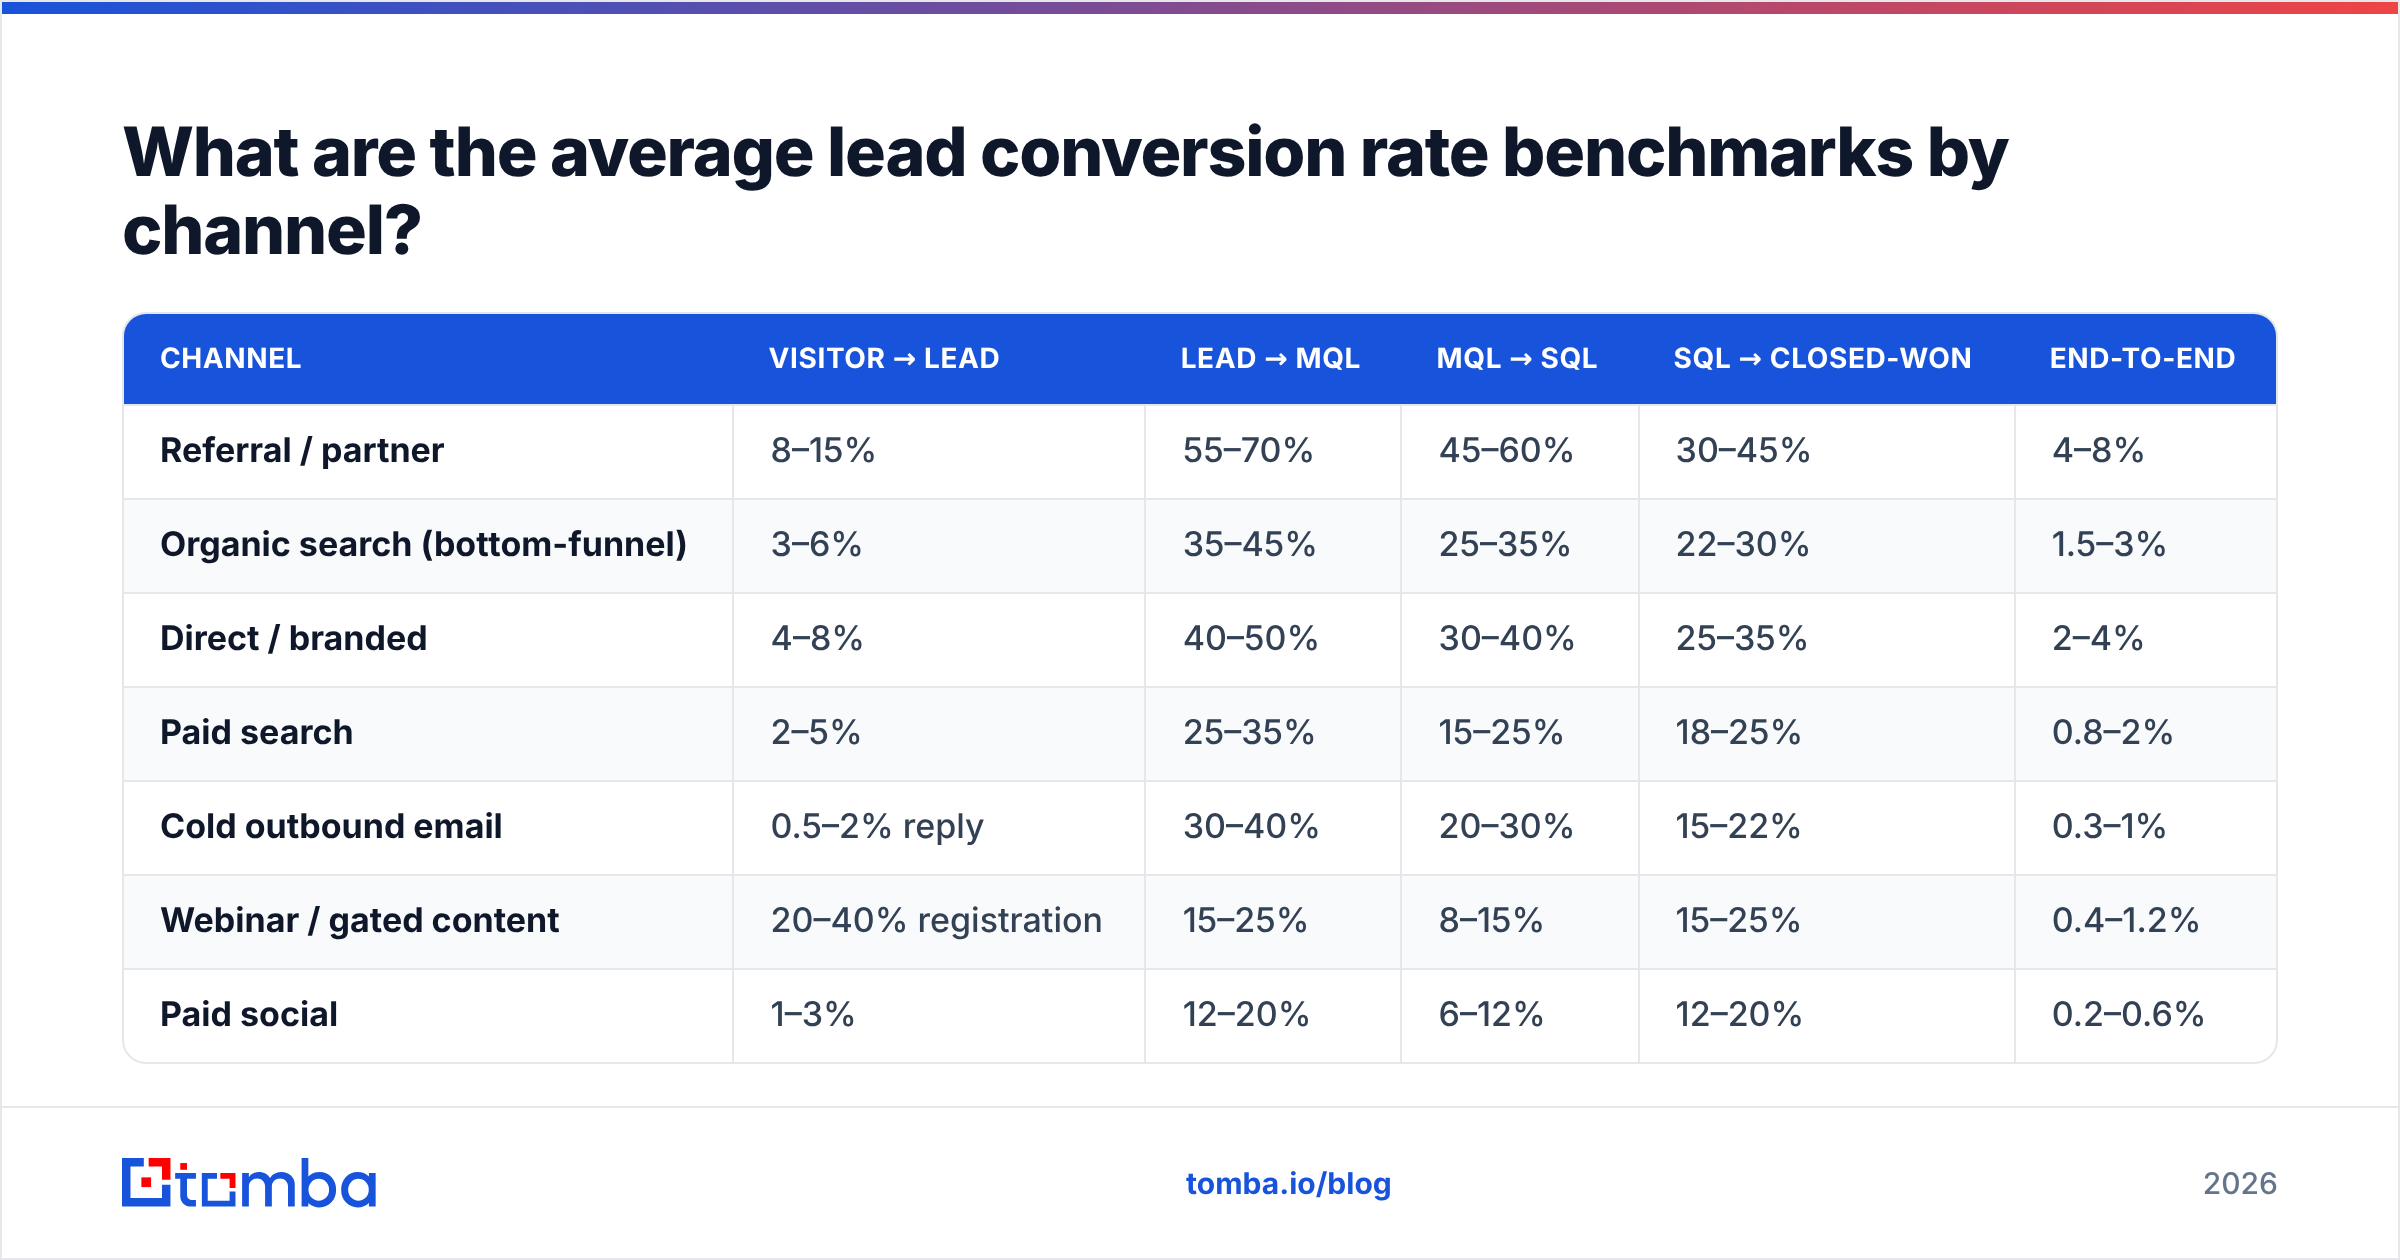
Channel is the strongest predictor of conversion, stronger than industry, company size, or price point. Intent is baked into the source: someone searching "email verification API pricing" is a different human from someone who clicked a LinkedIn ad while scrolling at lunch.
The table below reflects the ranges most commonly reported across B2B SaaS and services funnels in 2025–2026. Treat the midpoints as orientation, not law.
| Channel | Visitor → Lead | Lead → MQL | MQL → SQL | SQL → Closed-Won | End-to-end |
|---|---|---|---|---|---|
| Referral / partner | 8–15% | 55–70% | 45–60% | 30–45% | 4–8% |
| Organic search (bottom-funnel) | 3–6% | 35–45% | 25–35% | 22–30% | 1.5–3% |
| Direct / branded | 4–8% | 40–50% | 30–40% | 25–35% | 2–4% |
| Paid search | 2–5% | 25–35% | 15–25% | 18–25% | 0.8–2% |
| Cold outbound email | 0.5–2% reply | 30–40% | 20–30% | 15–22% | 0.3–1% |
| Webinar / gated content | 20–40% registration | 15–25% | 8–15% | 15–25% | 0.4–1.2% |
| Paid social | 1–3% | 12–20% | 6–12% | 12–20% | 0.2–0.6% |
Three things jump out.
Gated content looks great and converts badly. A 35% registration rate on a webinar flatters the top of the funnel and then collapses at MQL → SQL, because most registrants wanted the recording, not a vendor. If your board deck leads with "we generated 1,400 leads last quarter," check what share came from ungated-intent channels.
Cold outbound has a different denominator. You don't have "visitors," you have contacted prospects. A 1.2% contacted-to-meeting rate on a well-targeted list is healthy; the same 1.2% on a sloppy 50,000-record blast means you burned your domain for nothing. HubSpot's ongoing marketing statistics roundup is a reasonable sanity check on the top-of-funnel side of these ranges.
Referral is the ceiling. Nothing you do to a paid social campaign will move it into referral territory. If referral is 6% of your volume and 30% of your revenue, the growth lever is not "improve paid social conversion" — it's "manufacture more referrals."
How do benchmarks change by deal size and motion?#
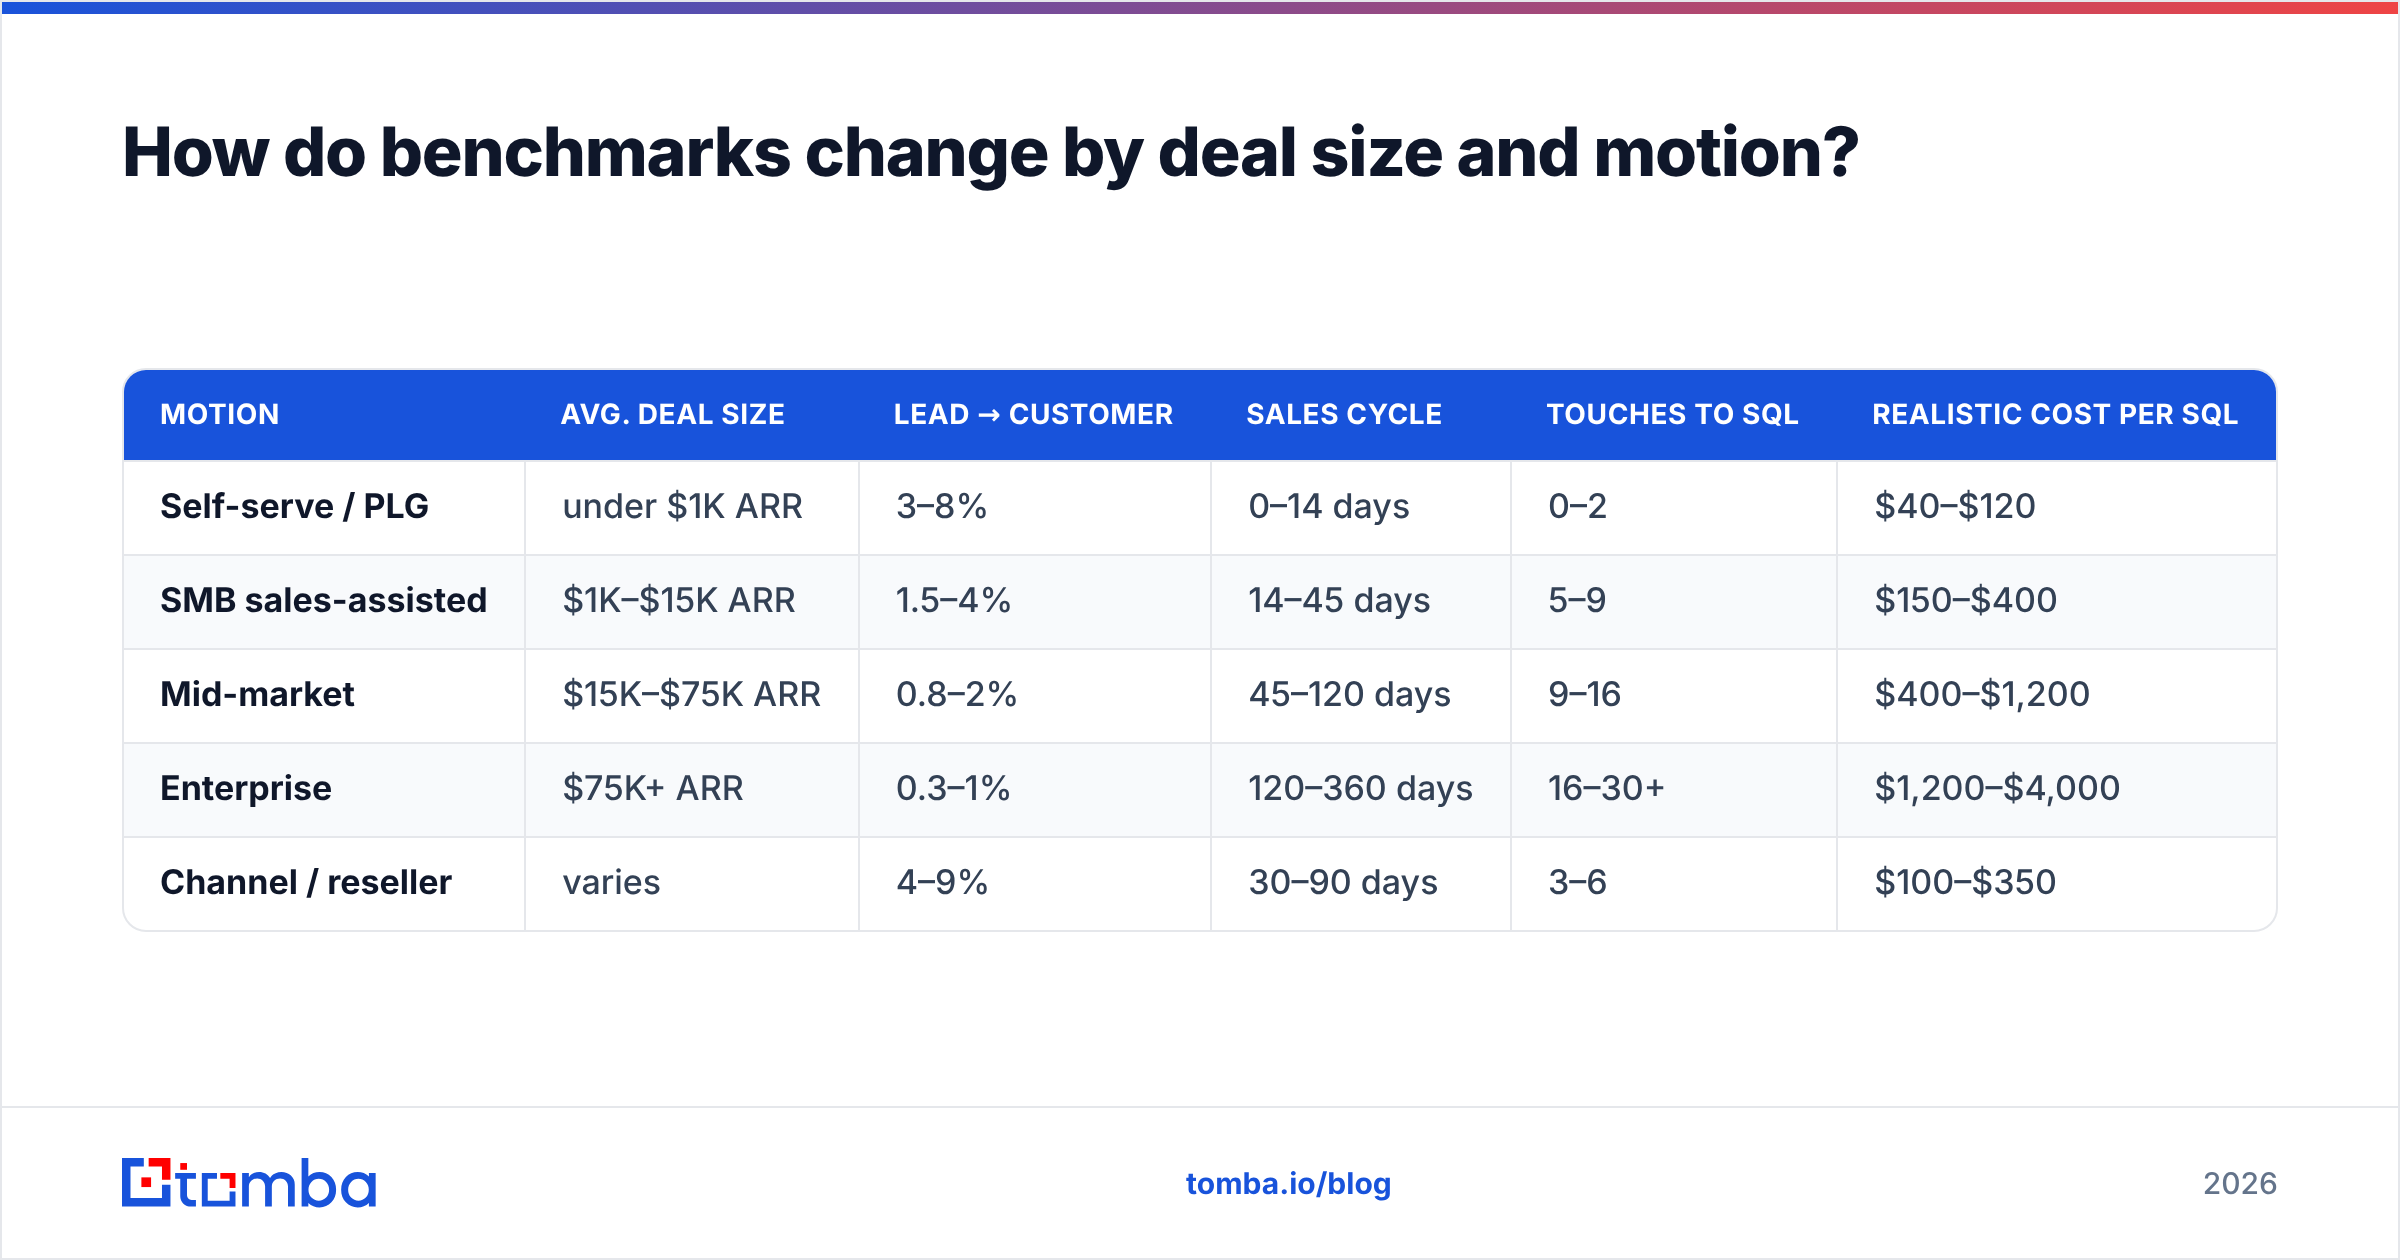
The second-biggest variable is what you're selling and for how much. A $49/month self-serve product and a $180,000 annual enterprise contract have inverted funnels: one converts a lot of leads cheaply and shallowly, the other converts very few leads at enormous value.
| Motion | Avg. deal size | Lead → customer | Sales cycle | Touches to SQL | Realistic cost per SQL |
|---|---|---|---|---|---|
| Self-serve / PLG | under $1K ARR | 3–8% | 0–14 days | 0–2 | $40–$120 |
| SMB sales-assisted | $1K–$15K ARR | 1.5–4% | 14–45 days | 5–9 | $150–$400 |
| Mid-market | $15K–$75K ARR | 0.8–2% | 45–120 days | 9–16 | $400–$1,200 |
| Enterprise | $75K+ ARR | 0.3–1% | 120–360 days | 16–30+ | $1,200–$4,000 |
| Channel / reseller | varies | 4–9% | 30–90 days | 3–6 | $100–$350 |
Notice the inversion: enterprise has the worst conversion rate on the table and often the best unit economics. Salesforce's State of Sales research has tracked the same pattern for years — cycle length and stakeholder count rise together, and conversion falls accordingly. Optimising an enterprise funnel for conversion rate is how you accidentally kill your largest deals.
The practical rule: compare yourself only to your own motion. If you run both PLG and enterprise, report them as two separate funnels. Blending them produces a number that describes neither.
Why is your conversion rate below the benchmark?#
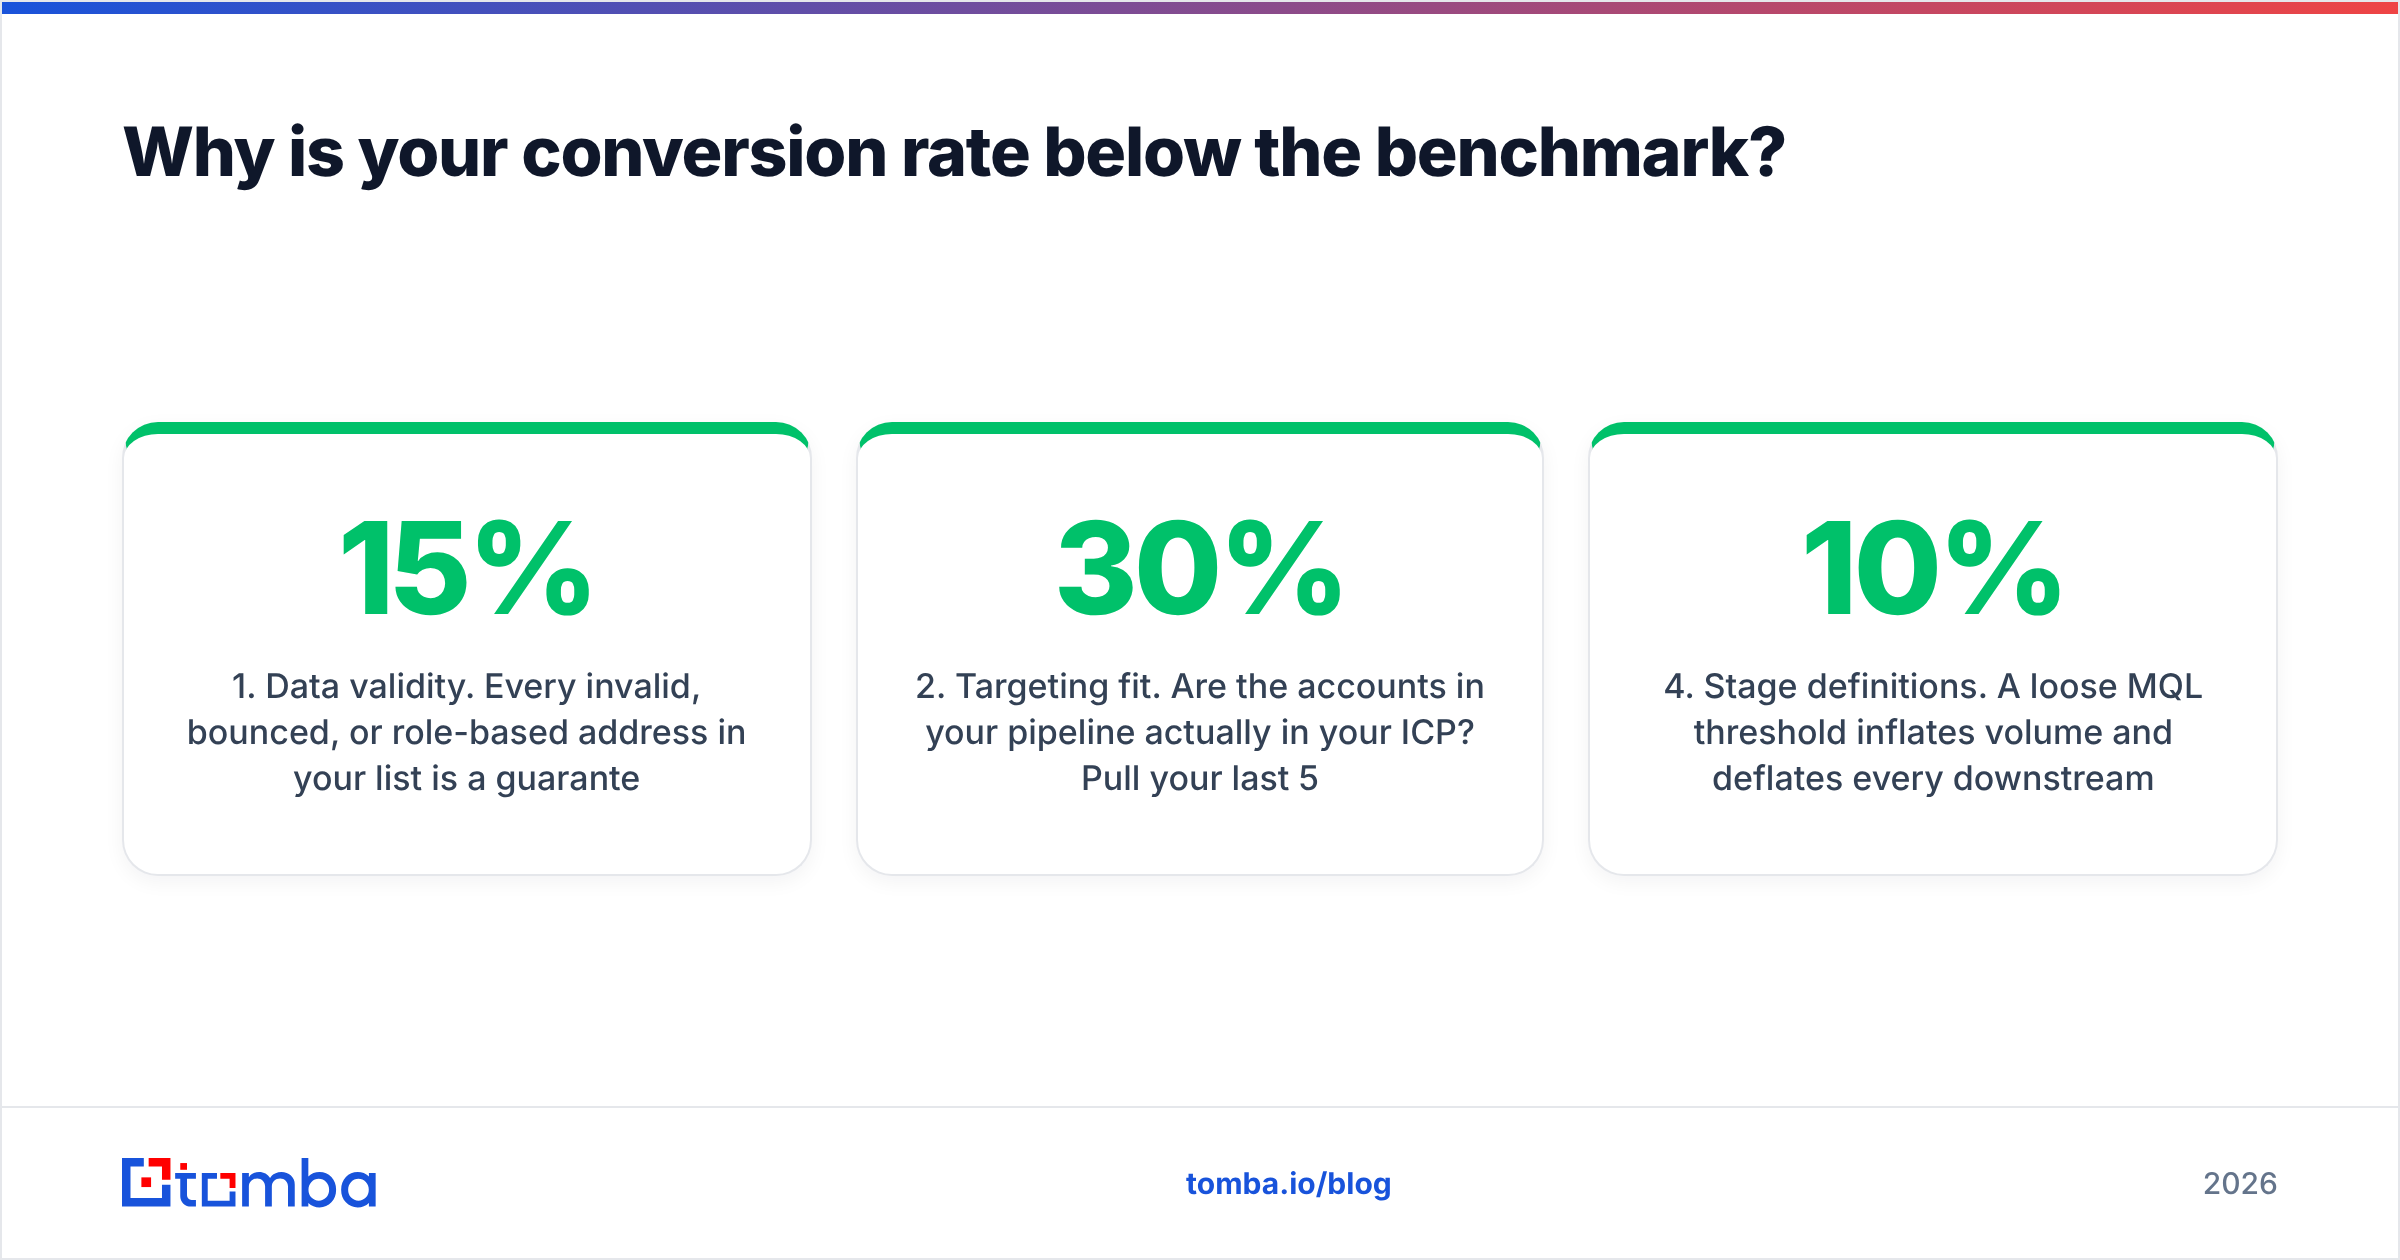
When a funnel underperforms, teams reach for messaging first because messaging is the most visible variable. It's usually fourth on the list. Work through these in order:
- Data validity. Every invalid, bounced, or role-based address in your list is a guaranteed non-conversion. A 15% bad-data rate on your inbound forms alone drags a 2.5% end-to-end rate down to 2.1% before anyone writes a word of copy. Run the list through an email verifier before it hits the sequence, not after.
- Targeting fit. Are the accounts in your pipeline actually in your ICP? Pull your last 50 closed-lost deals and tag the reason. If "not a fit" is over 30%, your conversion problem started at list-build, not at the call.
- Speed to lead. The response-time effect is brutally consistent: leads contacted within five minutes qualify at multiples of leads contacted the next day. If your median first-touch is measured in hours, that alone explains a large chunk of your MQL → SQL gap.
- Stage definitions. A loose MQL threshold inflates volume and deflates every downstream ratio. If your MQL → SQL is under 10%, the most likely cause is that you're calling too many things MQLs, not that sales is lazy.
- Routing and coverage. Leads sitting unassigned in a queue convert at roughly zero. Check for records with no owner, no activity in 14 days, or a next step in the past.
- Message and offer. Real, but last. Fix it after the five structural issues above, because copy tests on a broken funnel produce noise.
That order isn't arbitrary. The first five are mechanical constraints — they cap your ceiling regardless of execution quality. Copy only moves the number once the ceiling is high enough to matter.
Is bad data or bad targeting hurting you more?#
Both, but they fail differently, and the distinction changes what you fix.
Bad data is a hard cap. If 22% of your contacts are undeliverable, 22% of your effort produces literally nothing, your bounce rate climbs, and your sender reputation degrades — which then suppresses delivery to the 78% that were fine. It compounds. This is the failure mode that turns a mediocre quarter into a dead domain.
Bad targeting is a soft cap. The emails land, people read them, and nobody cares. Your reply rate sits at 0.4% and your meetings-booked number rounds to nothing. Painful, but it doesn't damage the infrastructure.
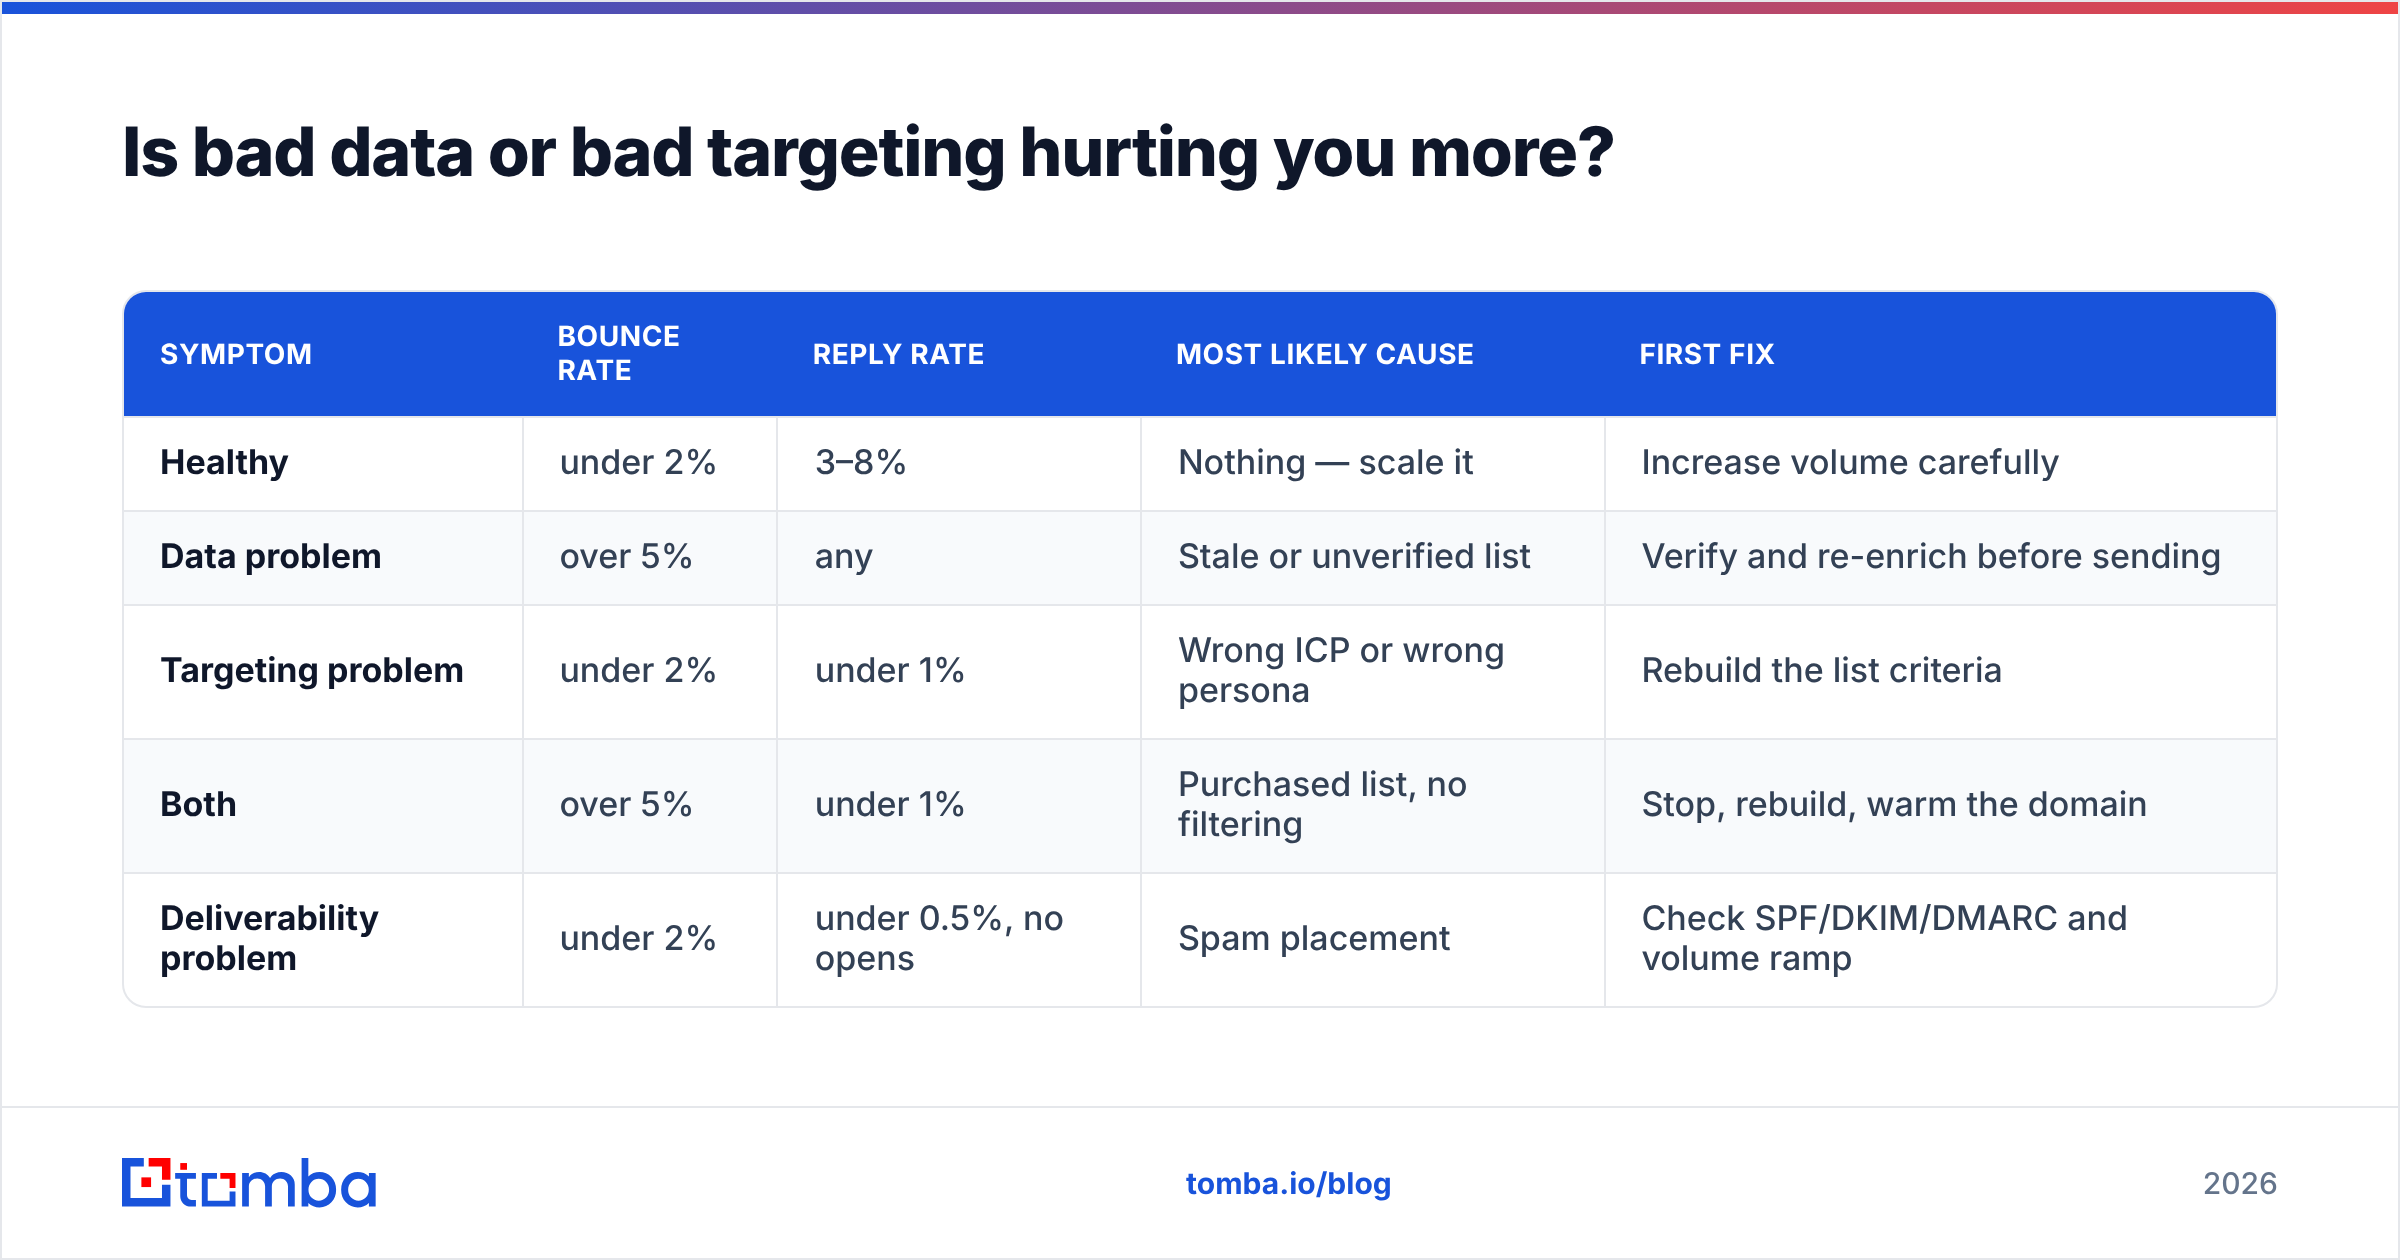
The diagnostic is simple: look at your bounce rate and your response rate side by side.
| Symptom | Bounce rate | Reply rate | Most likely cause | First fix |
|---|---|---|---|---|
| Healthy | under 2% | 3–8% | Nothing — scale it | Increase volume carefully |
| Data problem | over 5% | any | Stale or unverified list | Verify and re-enrich before sending |
| Targeting problem | under 2% | under 1% | Wrong ICP or wrong persona | Rebuild the list criteria |
| Both | over 5% | under 1% | Purchased list, no filtering | Stop, rebuild, warm the domain |
| Deliverability problem | under 2% | under 0.5%, no opens | Spam placement | Check SPF/DKIM/DMARC and volume ramp |
Most teams that "have a conversion problem" are in row four. They bought volume, skipped verification, and are now trying to solve a data problem with a copywriting solution.
How do you calculate stage conversion without fooling yourself?#
Three rules will get you 90% of the way to trustworthy numbers.
Rule 1: Use cohorts, not calendar months. Dividing this month's closed-won by this month's new leads is wrong whenever your sales cycle is longer than a month — which it is. Tag leads by creation month and follow that cohort forward. Your "October conversion rate" should only be final once October's cohort has aged past your 90th-percentile cycle length.
Rule 2: Report the denominator every time. "18% conversion" means nothing. "18% of MQLs created in Q2 became SQLs within 45 days" is a fact you can act on.
Rule 3: Segment before you average. A blended rate hides the one channel that's actually broken. Minimum viable segmentation: channel, motion, and region. The Wikipedia primer on conversion rate optimization is a decent refresher on why aggregation bias wrecks funnel analysis.
A workable formula set:
- Stage conversion = (records that reached stage N+1) ÷ (records that entered stage N in the cohort window)
- Velocity-adjusted conversion = same, but capped at your 90th-percentile stage duration so stalled records count as losses
- Effective conversion = stage conversion × (1 − invalid data rate), which is the number that tells you what data quality is costing you
That last one is the one nobody calculates and everyone should. If your MQL → SQL is 24% and 18% of your MQL records have unreachable contact data, your team is actually converting 29% of the reachable ones. Your problem is the list, not the pitch.
What should you fix in the next 90 days?#
- Days 1–14: measure honestly. Rebuild your funnel report as cohorts with explicit denominators, split by channel and motion. Expect the real numbers to be worse than the ones you've been reporting. That's fine — you're now measuring something true.
- Days 15–30: clean the inputs. Verify every active list, remove role-based and catch-all-risk addresses, and re-enrich records older than six months. Contact data decays somewhere around 2–3% per month through job changes alone, so a year-old list is meaningfully rotten. Data enrichment on your existing CRM records is usually higher-ROI than buying new ones.
- Days 31–60: tighten one stage. Pick the single worst stage against the channel benchmark and work only on that. Usually it's MQL → SQL, and usually the fix is a stricter MQL definition plus faster routing.
- Days 61–90: scale what held. Re-run the cohort report. If the fixed stage improved and the downstream stages didn't degrade, put budget behind that channel. If downstream degraded, you didn't improve quality — you just moved the bottleneck.
One honest caveat about benchmarks generally: published ranges skew toward companies willing to share data, which skews toward companies doing well. Your trailing 90 days is a better baseline than any table on the internet, including this one. Use external benchmarks to answer "is this stage catastrophically off?" — not "are we good?"
Start with the data layer#
Conversion rate benchmarks are mostly a diagnostic for data quality wearing a sales-performance costume. The teams that beat the medians aren't writing better subject lines; they're contacting the right people at reachable addresses, quickly, and measuring it in cohorts.
If your funnel math says the ceiling is the list, fix the list first. Tomba Email Finder builds verified, deliverable contact lists by domain, name, or company, so the records entering your funnel are reachable before they cost you a sequence slot. The free tier includes 25 searches a month, Starter runs $49/mo, and Growth is $99/mo — see Tomba pricing for the full breakdown. Verify before you send, then benchmark what's left.
Related guides#
// get started
Find, verify and enrich your first contacts today
Start on the free plan with 25 searches a month, then scale when your team is ready.
Free plan · No credit card required · GDPR & CCPA
Get the Tomba newsletter
Product and data updates
// about the author