Lead Conversion Rate Formula: How to Calculate It in 2026
Most teams calculate lead conversion rate wrong and end up optimizing the wrong stage. Here is the formula, the denominators that actually matter, and the benchmarks to judge yourself against.
TL;DR
- The lead conversion rate formula is
(Converted Leads ÷ Total Leads) × 100— but the word "converted" and the word "leads" both need a definition before the number means anything. - Measure conversion at every stage, not once end-to-end. A single blended number hides which stage is actually broken.
- Median B2B lead-to-customer conversion sits around 2–4%; MQL-to-SQL around 25–35%; SQL-to-opportunity around 50–60%. Your mix of inbound versus outbound moves all of these.
- Bad contact data silently deflates your rate. If 20% of your leads have invalid emails, your denominator is inflated and your team looks worse than it is.
- Track by cohort and by time-to-convert, not by calendar month, or long sales cycles will make good months look terrible.
What is the lead conversion rate formula?#
The formula is one line:
Lead Conversion Rate = (Number of Converted Leads ÷ Total Number of Leads) × 100
If 1,000 leads entered your funnel last quarter and 38 became paying customers, your lead conversion rate is 3.8%.
That is the easy part. The hard part is that "converted" and "leads" are both variables your company defines, and most companies define them inconsistently across teams. Marketing counts every form fill as a lead. Sales counts only the ones that took a meeting. Finance counts only closed-won revenue. Three people run the same formula and get 3.8%, 22%, and 1.1% — all technically correct, all describing different things.
Think of it like a batting average. The number is meaningless until everyone agrees on what counts as an at-bat. A walk is not an at-bat. A sacrifice fly is not an at-bat. Until you write down those rules, comparing two hitters is theater.
So before you calculate anything, write down two definitions:
- Numerator (converted): the specific stage transition you are measuring — MQL, SQL, opportunity, closed-won.
- Denominator (total leads): which records enter the count, and whether you filter out duplicates, junk domains, test submissions, and unreachable contacts.
Why does the denominator break most calculations?#
Because the denominator is where garbage accumulates.
A typical B2B lead list going into a quarterly report contains duplicates from the same person filling two forms, personal Gmail addresses from people who will never buy, competitors doing research, role accounts like info@, and a chunk of addresses that simply bounce. None of those can convert. All of them sit in your denominator and drag your rate down.
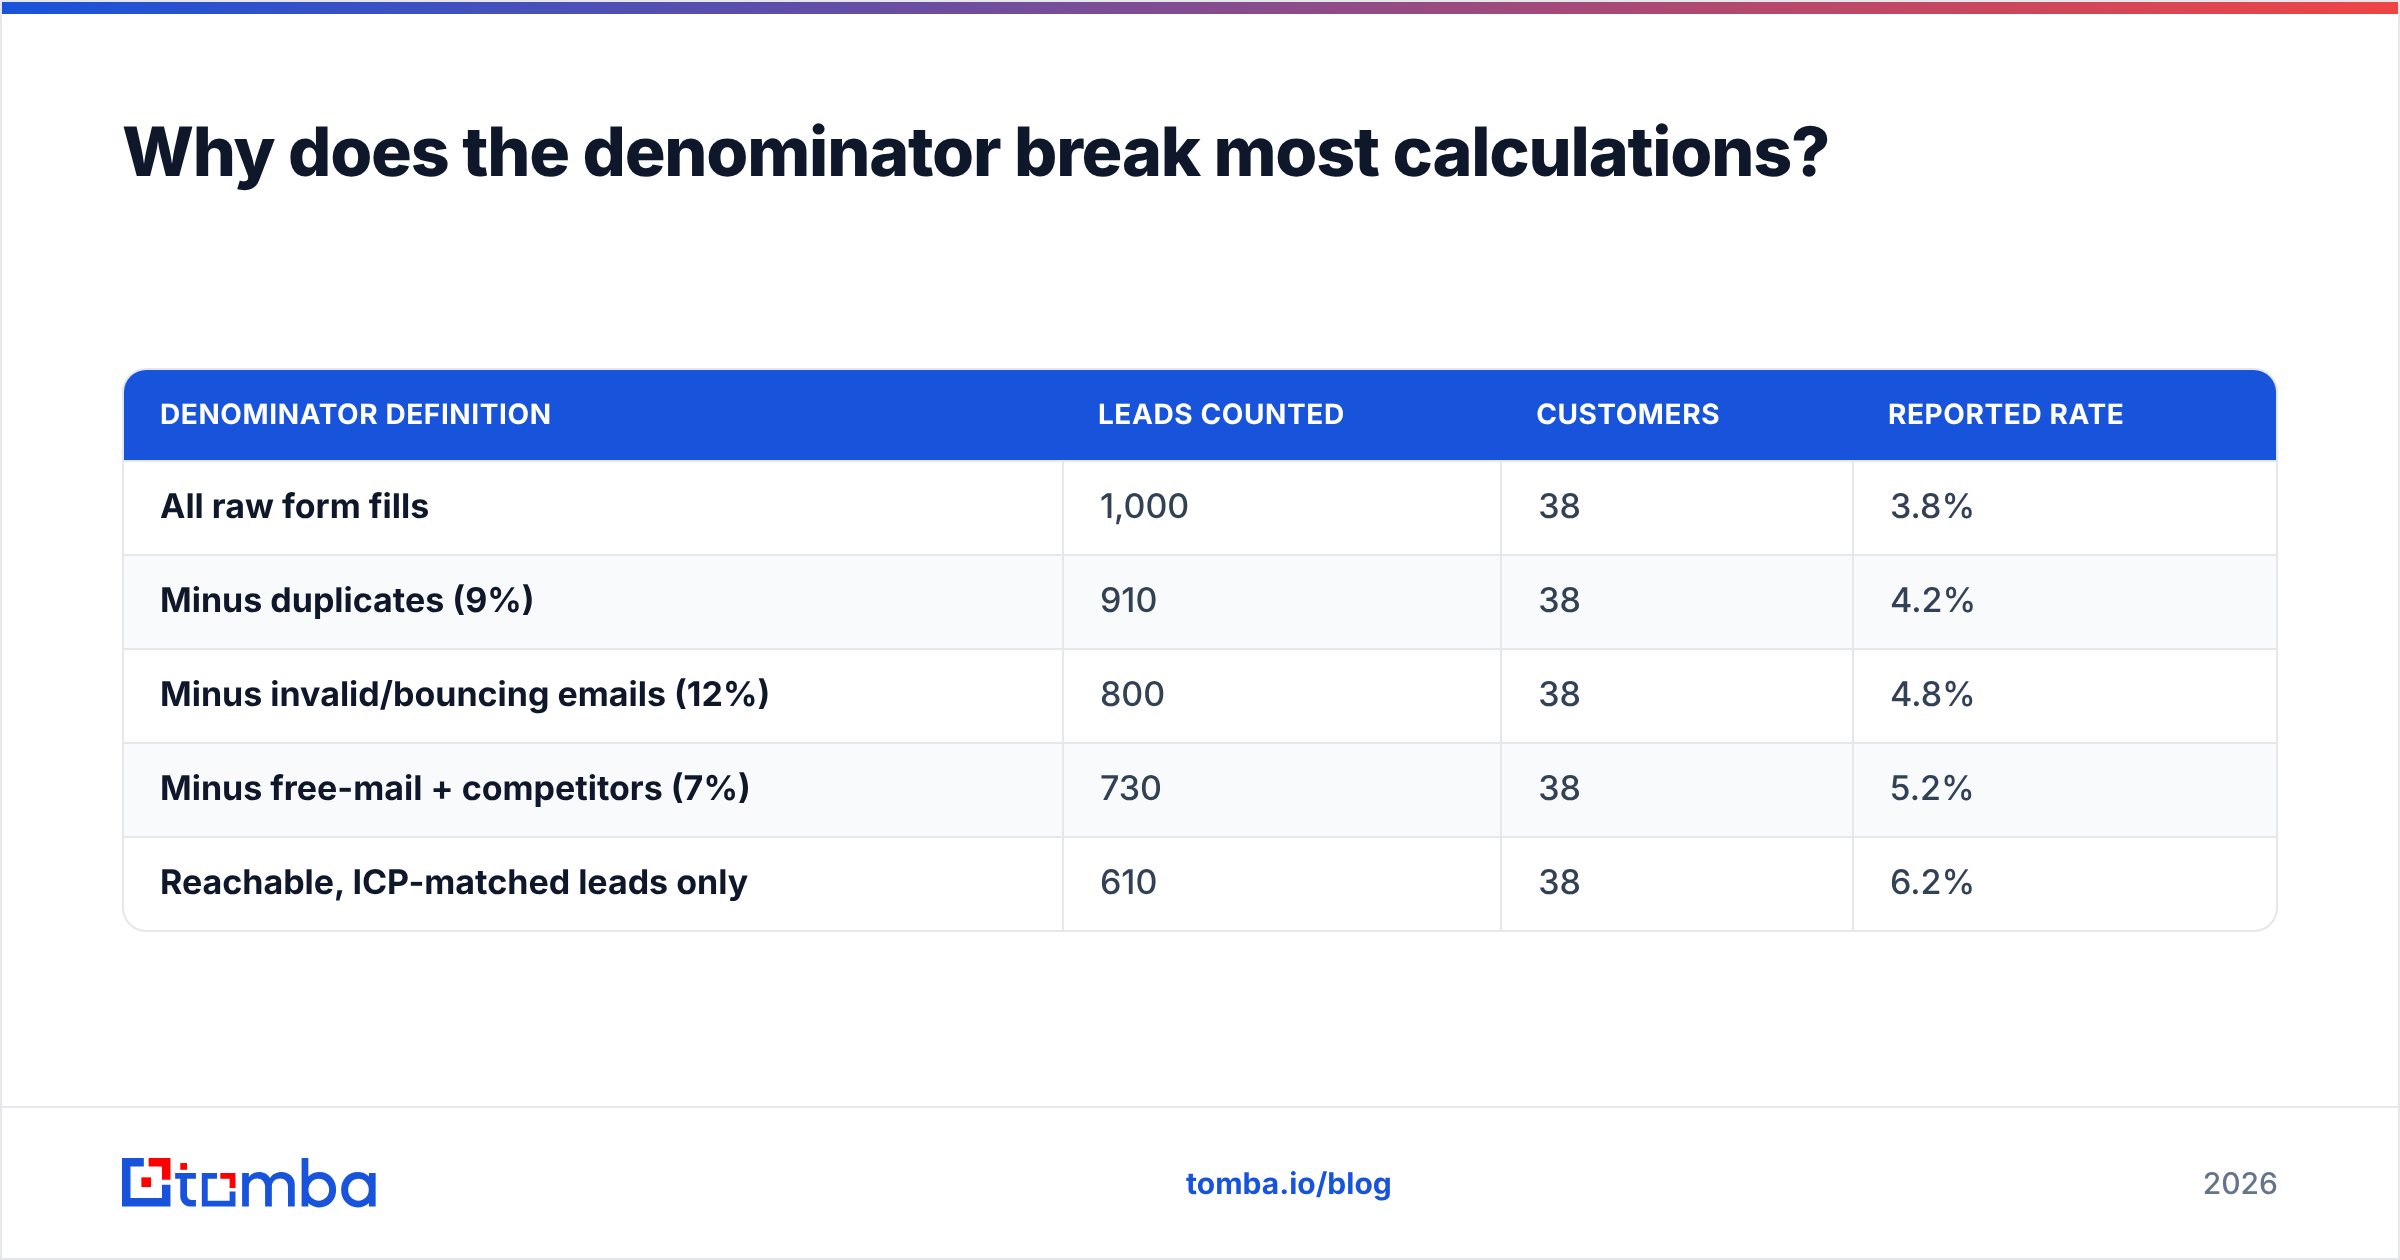
Here is what that looks like in practice. Two companies, same 1,000 raw leads, same 38 customers:
| Denominator definition | Leads counted | Customers | Reported rate |
|---|---|---|---|
| All raw form fills | 1,000 | 38 | 3.8% |
| Minus duplicates (9%) | 910 | 38 | 4.2% |
| Minus invalid/bouncing emails (12%) | 800 | 38 | 4.8% |
| Minus free-mail + competitors (7%) | 730 | 38 | 5.2% |
| Reachable, ICP-matched leads only | 610 | 38 | 6.2% |
The business performance is identical in every row. Only the hygiene of the denominator changed, and the reported rate nearly doubled. This is why two companies quoting conversion rates at a conference are usually not comparable.
The practical fix is to normalize before you calculate. Deduplicate, then run the list through an email verifier so unreachable addresses are flagged rather than counted as failed conversions. A lead that never received your email did not reject you — it never entered the funnel.

How do you calculate conversion rate at every funnel stage?#
Stop reporting one number. Report a chain.
An end-to-end rate tells you that something is wrong. A stage-by-stage chain tells you where. Use the same formula at each transition and divide by the count entering that stage — not by the top of the funnel.
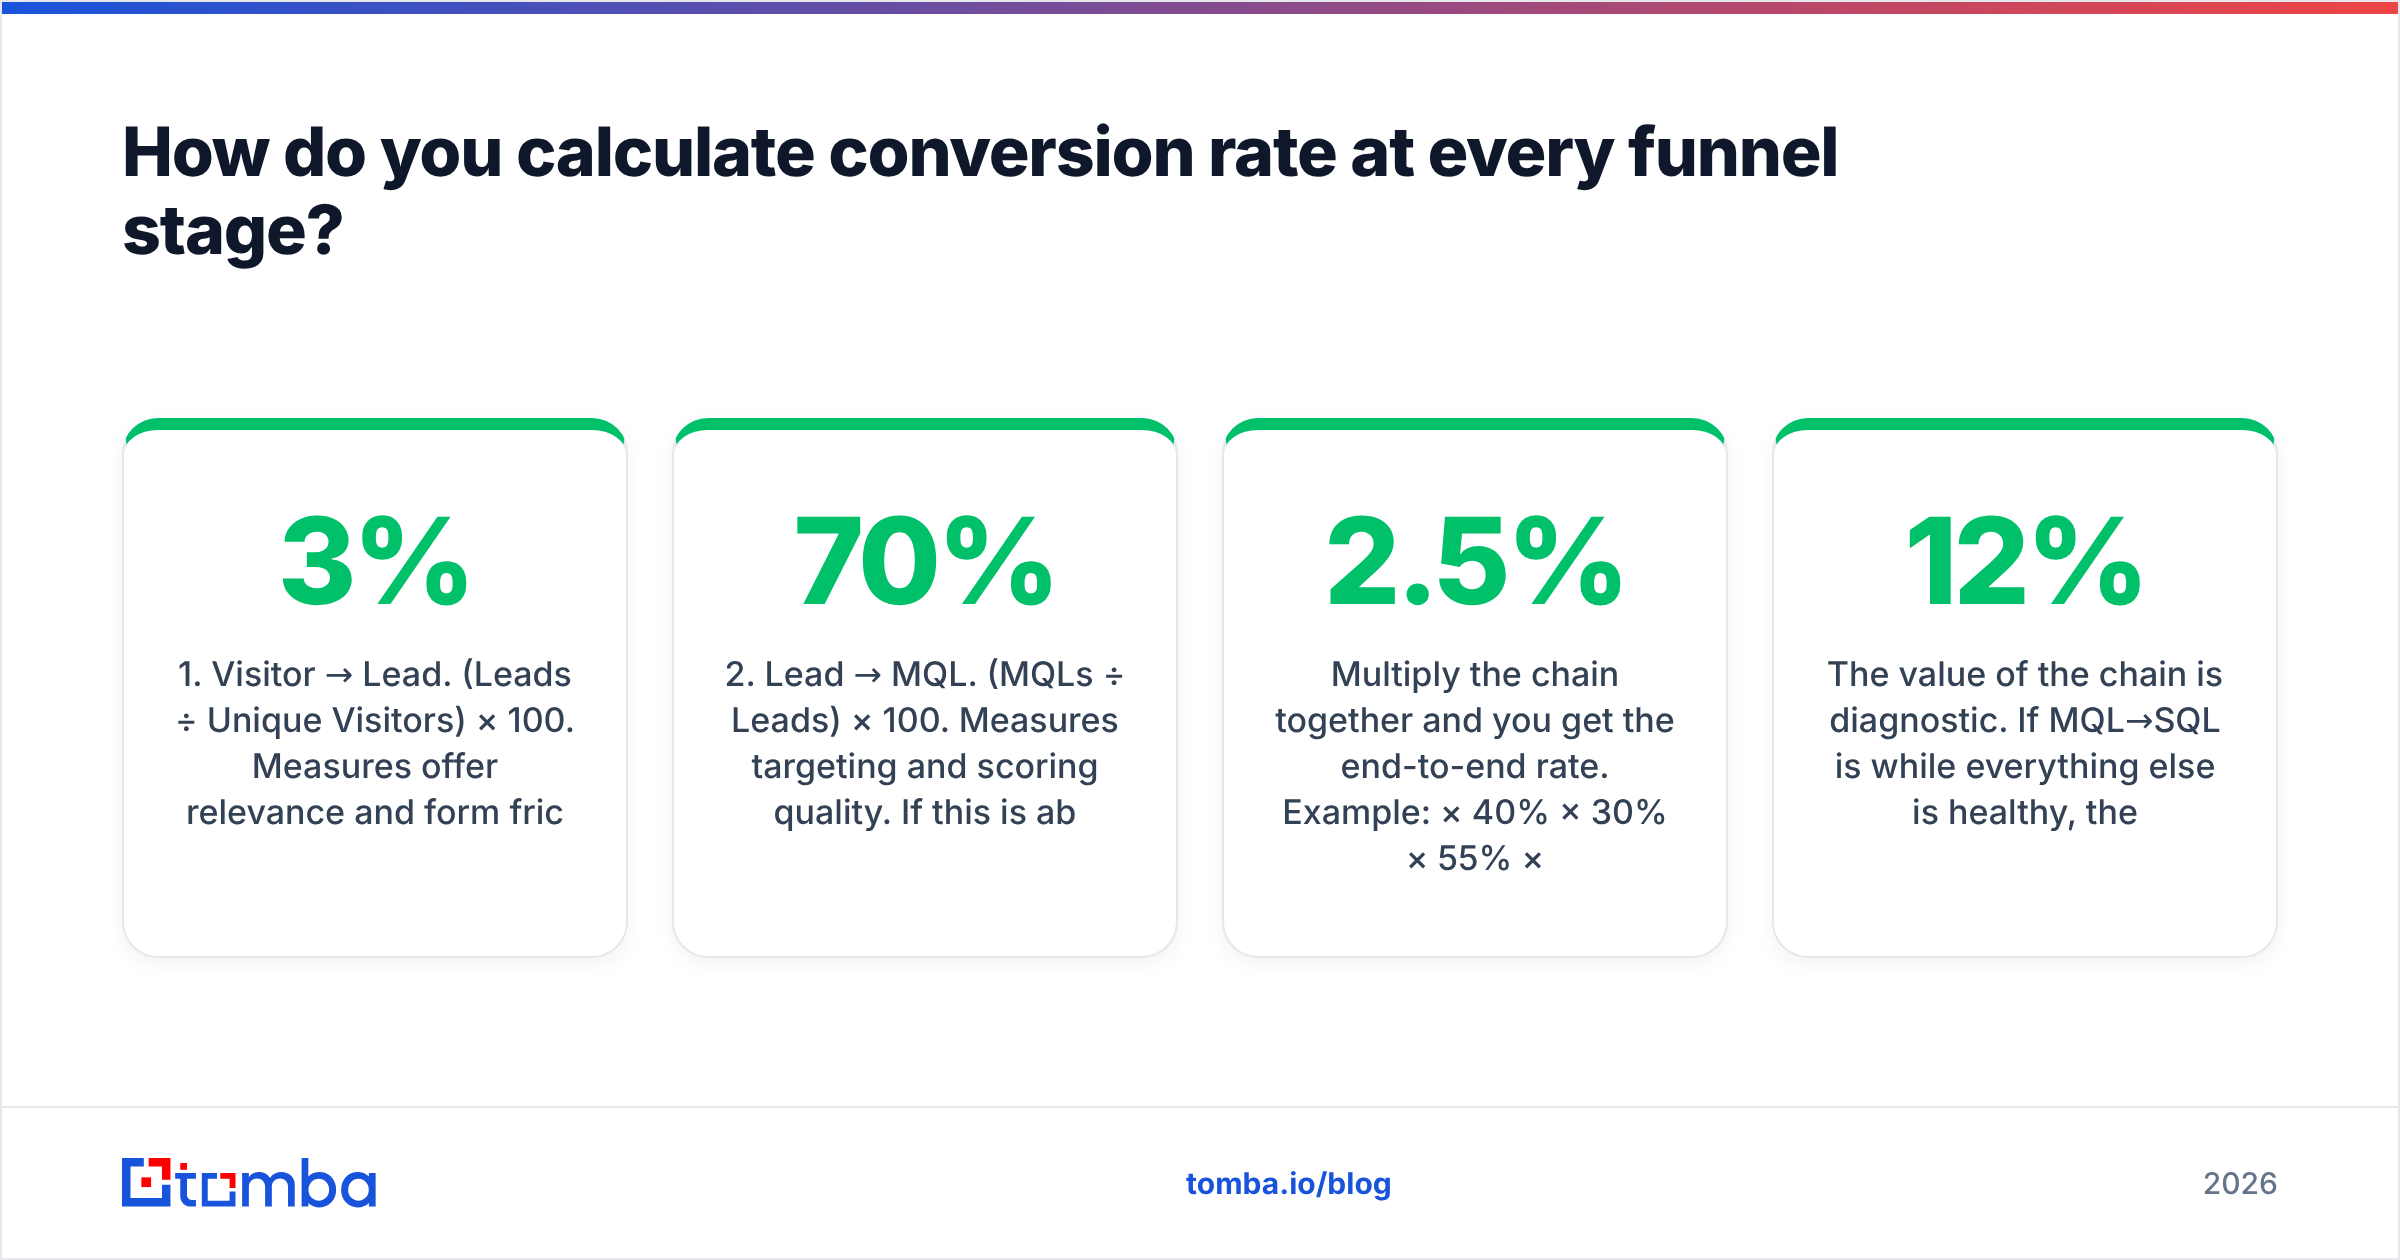
- Visitor → Lead.
(Leads ÷ Unique Visitors) × 100. Measures offer relevance and form friction. Typical B2B site: 1.5–3%. - Lead → MQL.
(MQLs ÷ Leads) × 100. Measures targeting and scoring quality. If this is above 70%, your MQL threshold is too loose. - MQL → SQL.
(SQLs ÷ MQLs) × 100. The marketing-sales handoff. This is where most misalignment shows up as an argument. - SQL → Opportunity.
(Opportunities ÷ SQLs) × 100. Measures discovery-call quality and whether reps are qualifying or hoping. - Opportunity → Closed-Won.
(Closed-Won ÷ Opportunities) × 100. Your win rate. Measures pricing, competition, and closing skill.
Multiply the chain together and you get the end-to-end rate. Example: 2.5% × 40% × 30% × 55% × 25% works out to roughly 0.04% visitor-to-customer — which sounds catastrophic until you remember that is normal for top-of-funnel web traffic.
The value of the chain is diagnostic. If MQL→SQL is 12% while everything else is healthy, the problem is lead quality or scoring, not your closers. If SQL→Opportunity is 20% while MQL→SQL is 45%, your reps are taking meetings with people who cannot buy.
What are good lead conversion rate benchmarks in 2026?#
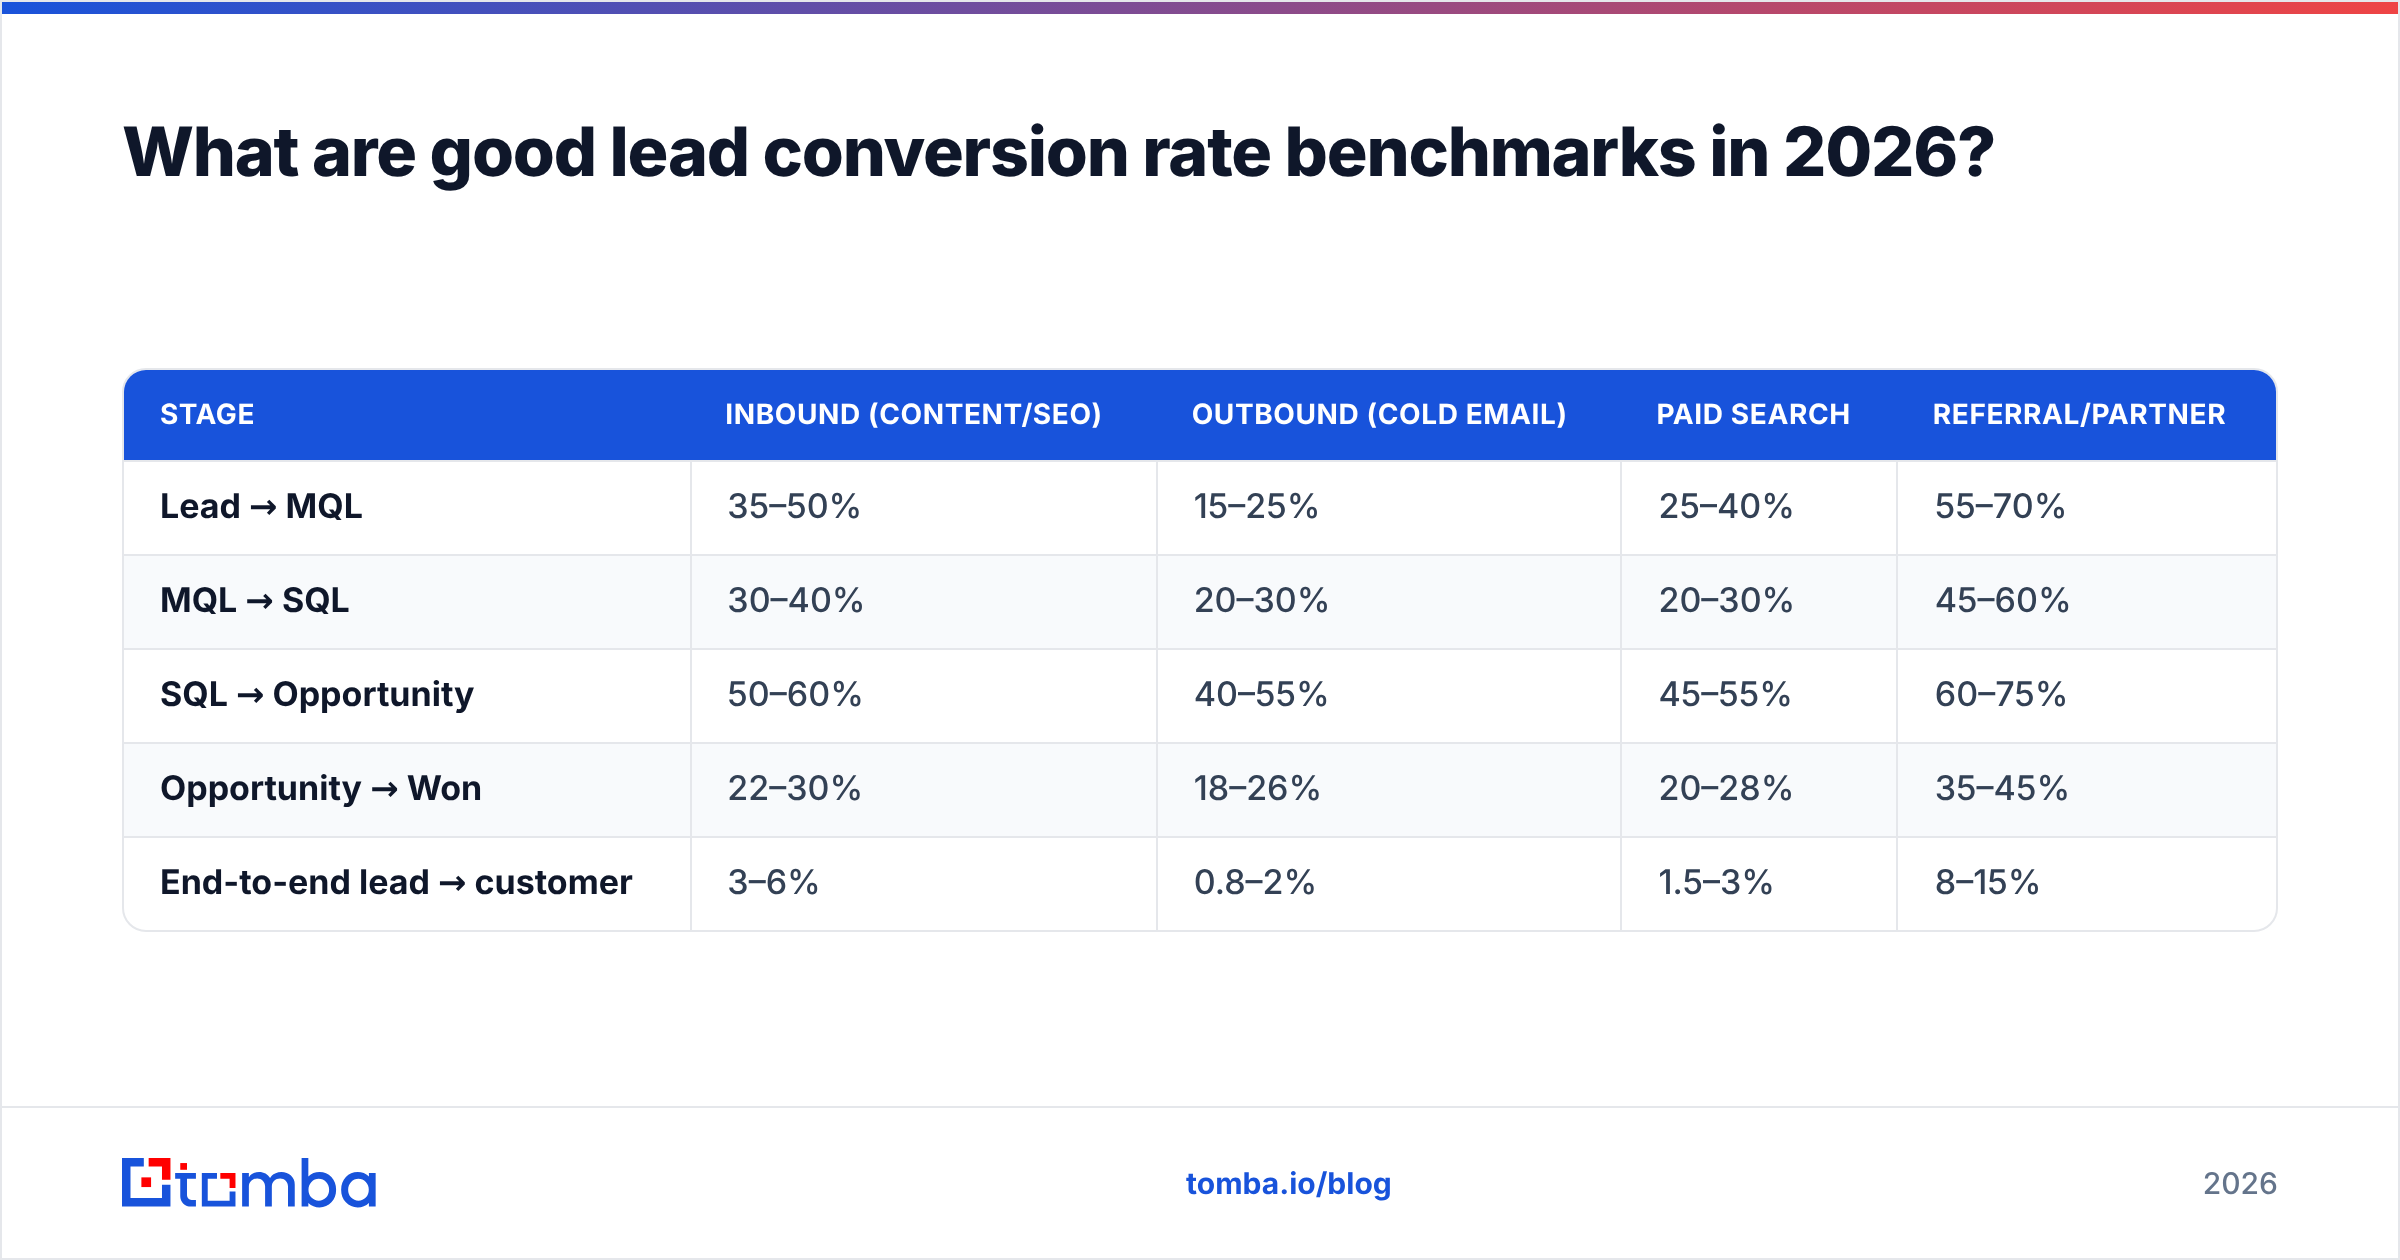
Benchmarks are guardrails, not targets. Your industry, deal size, and channel mix move these numbers more than your skill does.
| Stage | Inbound (content/SEO) | Outbound (cold email) | Paid search | Referral/partner |
|---|---|---|---|---|
| Lead → MQL | 35–50% | 15–25% | 25–40% | 55–70% |
| MQL → SQL | 30–40% | 20–30% | 20–30% | 45–60% |
| SQL → Opportunity | 50–60% | 40–55% | 45–55% | 60–75% |
| Opportunity → Won | 22–30% | 18–26% | 20–28% | 35–45% |
| End-to-end lead → customer | 3–6% | 0.8–2% | 1.5–3% | 8–15% |
Two things to take from that table. First, outbound conversion rates are structurally lower than inbound and always will be — you are interrupting people rather than being found by them. Comparing the two and concluding outbound "doesn't work" is a measurement error. Second, referral conversion is so much higher than every other channel that a 10% shift of effort toward partner sourcing often beats any funnel optimization you could run.
For deeper industry-specific cuts, HubSpot's annual State of Marketing research and vendor-category reviews on G2 are the least-bad public sources. Treat any benchmark quoted without a sample size and a definition of "lead" as marketing copy.
Does your CRM calculate this correctly by default?#
Usually not, and the reasons are boring but expensive.
Calendar-month attribution. Most CRM dashboards divide this month's closed deals by this month's new leads. If your sales cycle is 60 days, you are dividing October's wins by October's leads — two completely unrelated populations. In a fast-growing month, lead volume spikes and your conversion rate appears to crash. The fix is cohort reporting: track the January lead cohort through its full lifecycle, then report its rate once the cycle window closes.
Stage regression. Deals move backward. If an opportunity drops from "Proposal" to "Discovery," many reports count it in both stages or neither. Decide the rule and enforce it in the report, not in rep behavior.
Duplicate contact records. One person, three records, one deal. Your denominator counts three; your numerator counts one. Run deduplication against a canonical key — usually the verified work email — before reporting. A bulk email finder workflow that normalizes and verifies contacts on import prevents most of this at the source.
Excluded-but-counted leads. Test submissions, internal employees, and known competitors should be tagged and excluded from both numerator and denominator, not silently deleted. Deletion destroys the audit trail; exclusion preserves it.
If you run revenue operations, your job here is to own the definitions document and refuse to let anyone report a conversion number that doesn't cite it.
How does data quality change your lead conversion rate?#
More than any tactic you will run this quarter.
Work through the arithmetic. You send 2,000 cold emails. If 18% of the addresses are invalid, 360 never arrive. Those 360 sit in your denominator as non-converting leads. Your reported reply rate and downstream conversion rate both take a hit that has nothing to do with your messaging, your offer, or your reps.
Worse, high bounce rates damage sender reputation, which suppresses inbox placement for the valid addresses too. Now you are losing conversions on the good half of the list because of the bad half. The damage compounds across campaigns.
Three data-hygiene moves with measurable conversion impact:
- Verify before send, not after bounce. Verification catches invalid syntax, dead domains, and non-existent mailboxes before they cost you deliverability. Catch-all domains need a separate pass — a catch-all verifier distinguishes "accepts everything" from "actually deliverable."
- Enrich the record, don't just find the email. Title, company size, and tech stack let you segment the denominator by ICP fit. Measuring conversion on your ICP segment separately from everything else is often the single most clarifying report you can build. Contact enrichment makes that segmentation possible.
- Re-verify quarterly. B2B contact data decays roughly 2–3% per month through job changes. A list verified in January is meaningfully stale by July.
Which metrics should you track alongside conversion rate?#
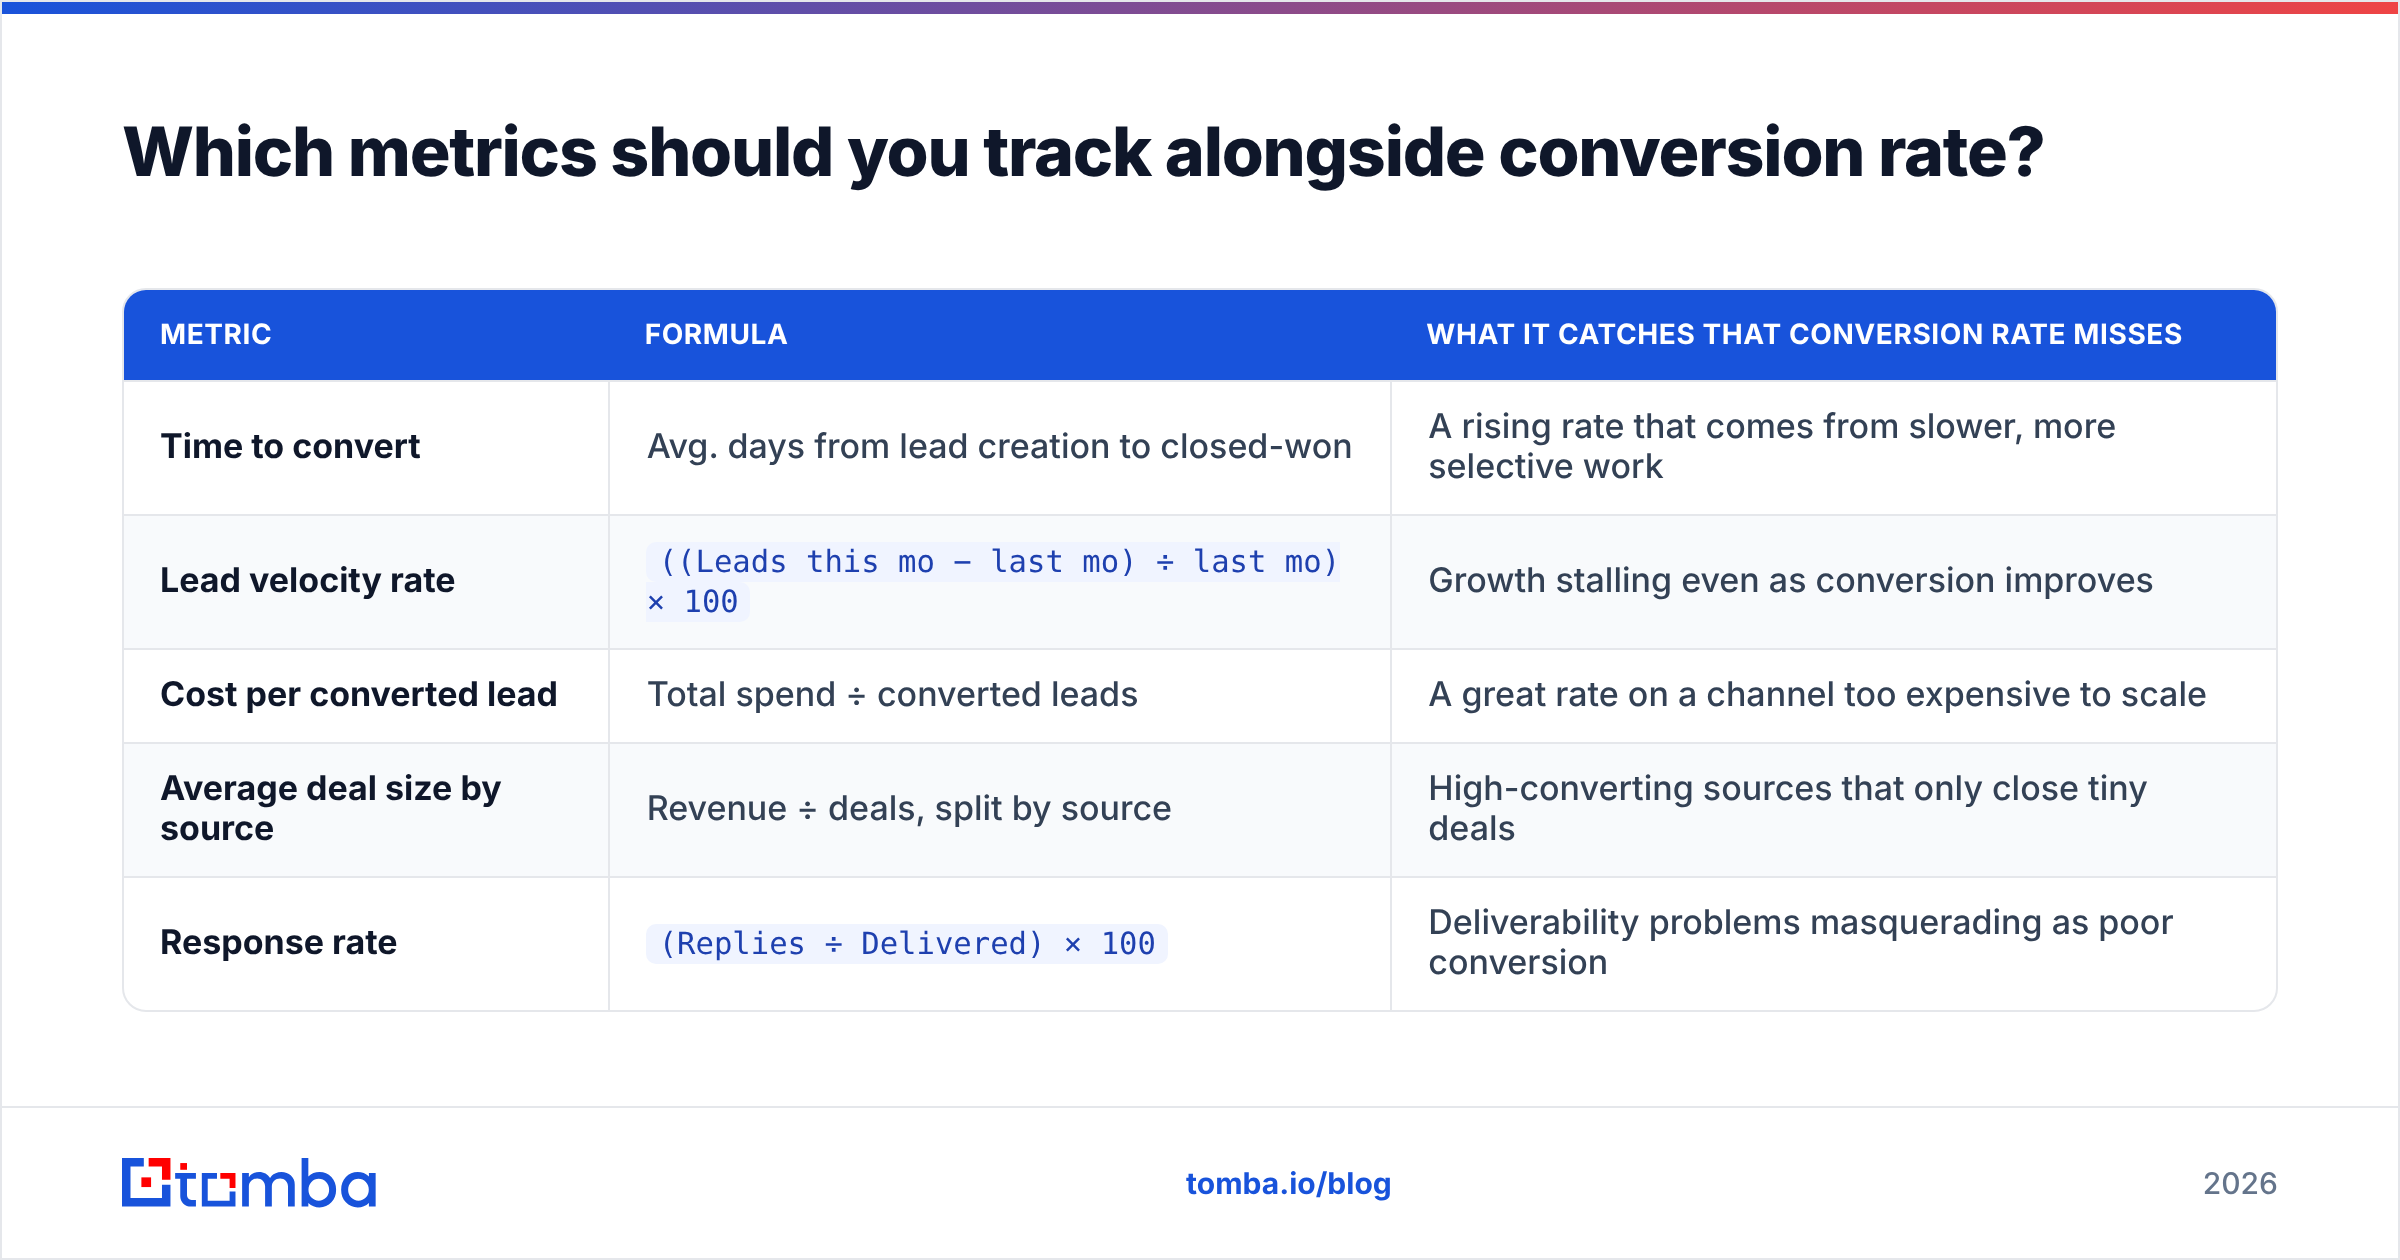
Conversion rate alone is easy to game. A rep can hit 40% MQL→SQL by rejecting every lead that isn't already a warm referral. Pair it with volume and velocity metrics so the incentive stays honest.
| Metric | Formula | What it catches that conversion rate misses |
|---|---|---|
| Time to convert | Avg. days from lead creation to closed-won | A rising rate that comes from slower, more selective work |
| Lead velocity rate | ((Leads this mo − last mo) ÷ last mo) × 100 |
Growth stalling even as conversion improves |
| Cost per converted lead | Total spend ÷ converted leads | A great rate on a channel too expensive to scale |
| Average deal size by source | Revenue ÷ deals, split by source | High-converting sources that only close tiny deals |
| Response rate | (Replies ÷ Delivered) × 100 |
Deliverability problems masquerading as poor conversion |
The pairing that matters most is conversion rate against average deal size by source. Plenty of teams discover their "best converting" channel produces deals worth a third of everything else, and their worst-converting channel carries the entire quarter.
How do you actually improve the number?#
In order of typical impact, not in order of how fun they are:
- Fix the denominator first. Deduplicate, verify, and exclude non-ICP records. This costs days, not quarters, and it makes every subsequent measurement trustworthy. Nothing else on this list works without it.
- Tighten the MQL definition. Raise the scoring threshold until sales stops complaining. Volume drops, conversion rate rises, and total closed-won usually holds steady or improves because reps spend their hours on real buyers.
- Cut speed-to-lead. Response within five minutes versus an hour changes qualification odds dramatically across most published studies. This is a routing and staffing problem, not a messaging problem.
- Segment reporting by source. Blended rates hide everything. The moment you split inbound from outbound from referral, the actual problem usually becomes obvious within one meeting.
- Instrument the handoff. Log why sales rejected each MQL, with a required picklist. After 200 rejections you will know precisely which scoring signal is lying to you.
- Re-verify before every major campaign. A stale list turns a good campaign into a deliverability incident.
Most teams jump to step 3 because it feels actionable, then wonder why their number barely moves. Steps 1 and 2 are unglamorous and account for the majority of the gain.
Where do tools fit into this?#
Your CRM (HubSpot and Salesforce both handle this natively) owns stage definitions and the report itself. A BI layer handles cohort attribution when the CRM's native reporting can't. And a data layer handles the part CRMs are weakest at: making sure the records in the denominator are real, reachable, and correctly attributed to a company.
That last piece is where conversion measurement most often falls apart, because it is invisible. A CRM will happily report on 1,000 contacts without telling you 180 of them cannot receive email.
Start with a denominator you can trust#
You cannot optimize a rate whose bottom half is fiction. Before your next pipeline review, run your lead list through verification and enrichment, tag the records that were never reachable, and recalculate. Most teams find their real conversion rate is meaningfully better than what they have been reporting — and that the stage they thought was broken is not the one that is.
Tomba's email finder builds and verifies that denominator for you: find work emails by name and domain, verify deliverability before send, and enrich records with company data so you can segment conversion by ICP fit instead of guessing. The free tier covers 25 searches a month, and paid plans start at $49/mo — see Tomba pricing for the full breakdown. Clean inputs first, then optimize the funnel.
Related guides#
Ready to find emails that actually work?
Join 150,000+ professionals who stopped guessing and started sending. Free credits on signup — no credit card required.
Get the Tomba newsletter
Practical outbound tactics and product updates — once every two weeks.
About the author