Lead Generation KPIs: The 14 Metrics That Predict Revenue
Most teams track lead volume and wonder why pipeline stalls. Here are the 14 lead generation KPIs that actually predict revenue, with benchmarks, formulas, and the vanity metrics to drop.
TL;DR
- Lead volume is the least predictive number on your dashboard. Track lead-to-SQL rate, cost per SQL, and speed-to-lead instead — those three move pipeline within a quarter.
- You need KPIs at four stages: source, qualification, conversion, and economics. Skipping the economics layer is why "record MQL month" and "flat revenue" show up in the same board deck.
- Benchmarks worth holding yourself to in 2026: 13% MQL→SQL, 6% SQL→close on outbound, under 5 minutes speed-to-lead, and a CAC payback under 18 months.
- Data quality is a KPI, not a chore. A 12% bounce rate silently inflates your cost per SQL by roughly a third, because you paid for contacts that never existed.
- Report on a two-tier dashboard: five headline KPIs for leadership, the diagnostic tier underneath for the people who have to fix things.
What are lead generation KPIs, actually?#
Lead generation KPIs are the measurements that tell you whether your demand engine is producing revenue or just producing activity. That distinction matters more than any specific metric list, because almost every dashboard failure comes down to the same mistake: measuring what is easy to count instead of what is expensive to be wrong about.
Think of it like a restaurant. Counting people who walk past the window is easy. Counting people who sit down, order, pay, and come back is hard. Most lead gen dashboards are still counting the sidewalk.
A usable KPI has four properties:
- It is tied to a downstream outcome. If the number goes up and revenue does not eventually follow, it is a diagnostic at best and a vanity metric at worst.
- Someone owns it. An unowned KPI gets explained away every single review.
- It moves within your planning cycle. A metric that takes nine months to respond cannot guide a quarterly plan.
- It has a defined denominator. "Conversion rate" means nothing until you say conversion from what, over what window.
That last one causes more arguments than anything else. Two teams reporting "22% conversion" are usually measuring entirely different things — one counts form fills to MQL, the other counts opportunity to close.
Which lead generation KPIs actually predict revenue?#
Here are the fourteen that earn dashboard space, grouped by the question they answer.
Volume and source health (the inputs)
- Qualified lead volume — not raw leads. Leads that pass your ICP filter. Raw volume tells you how loud your top of funnel is; qualified volume tells you how useful it is.
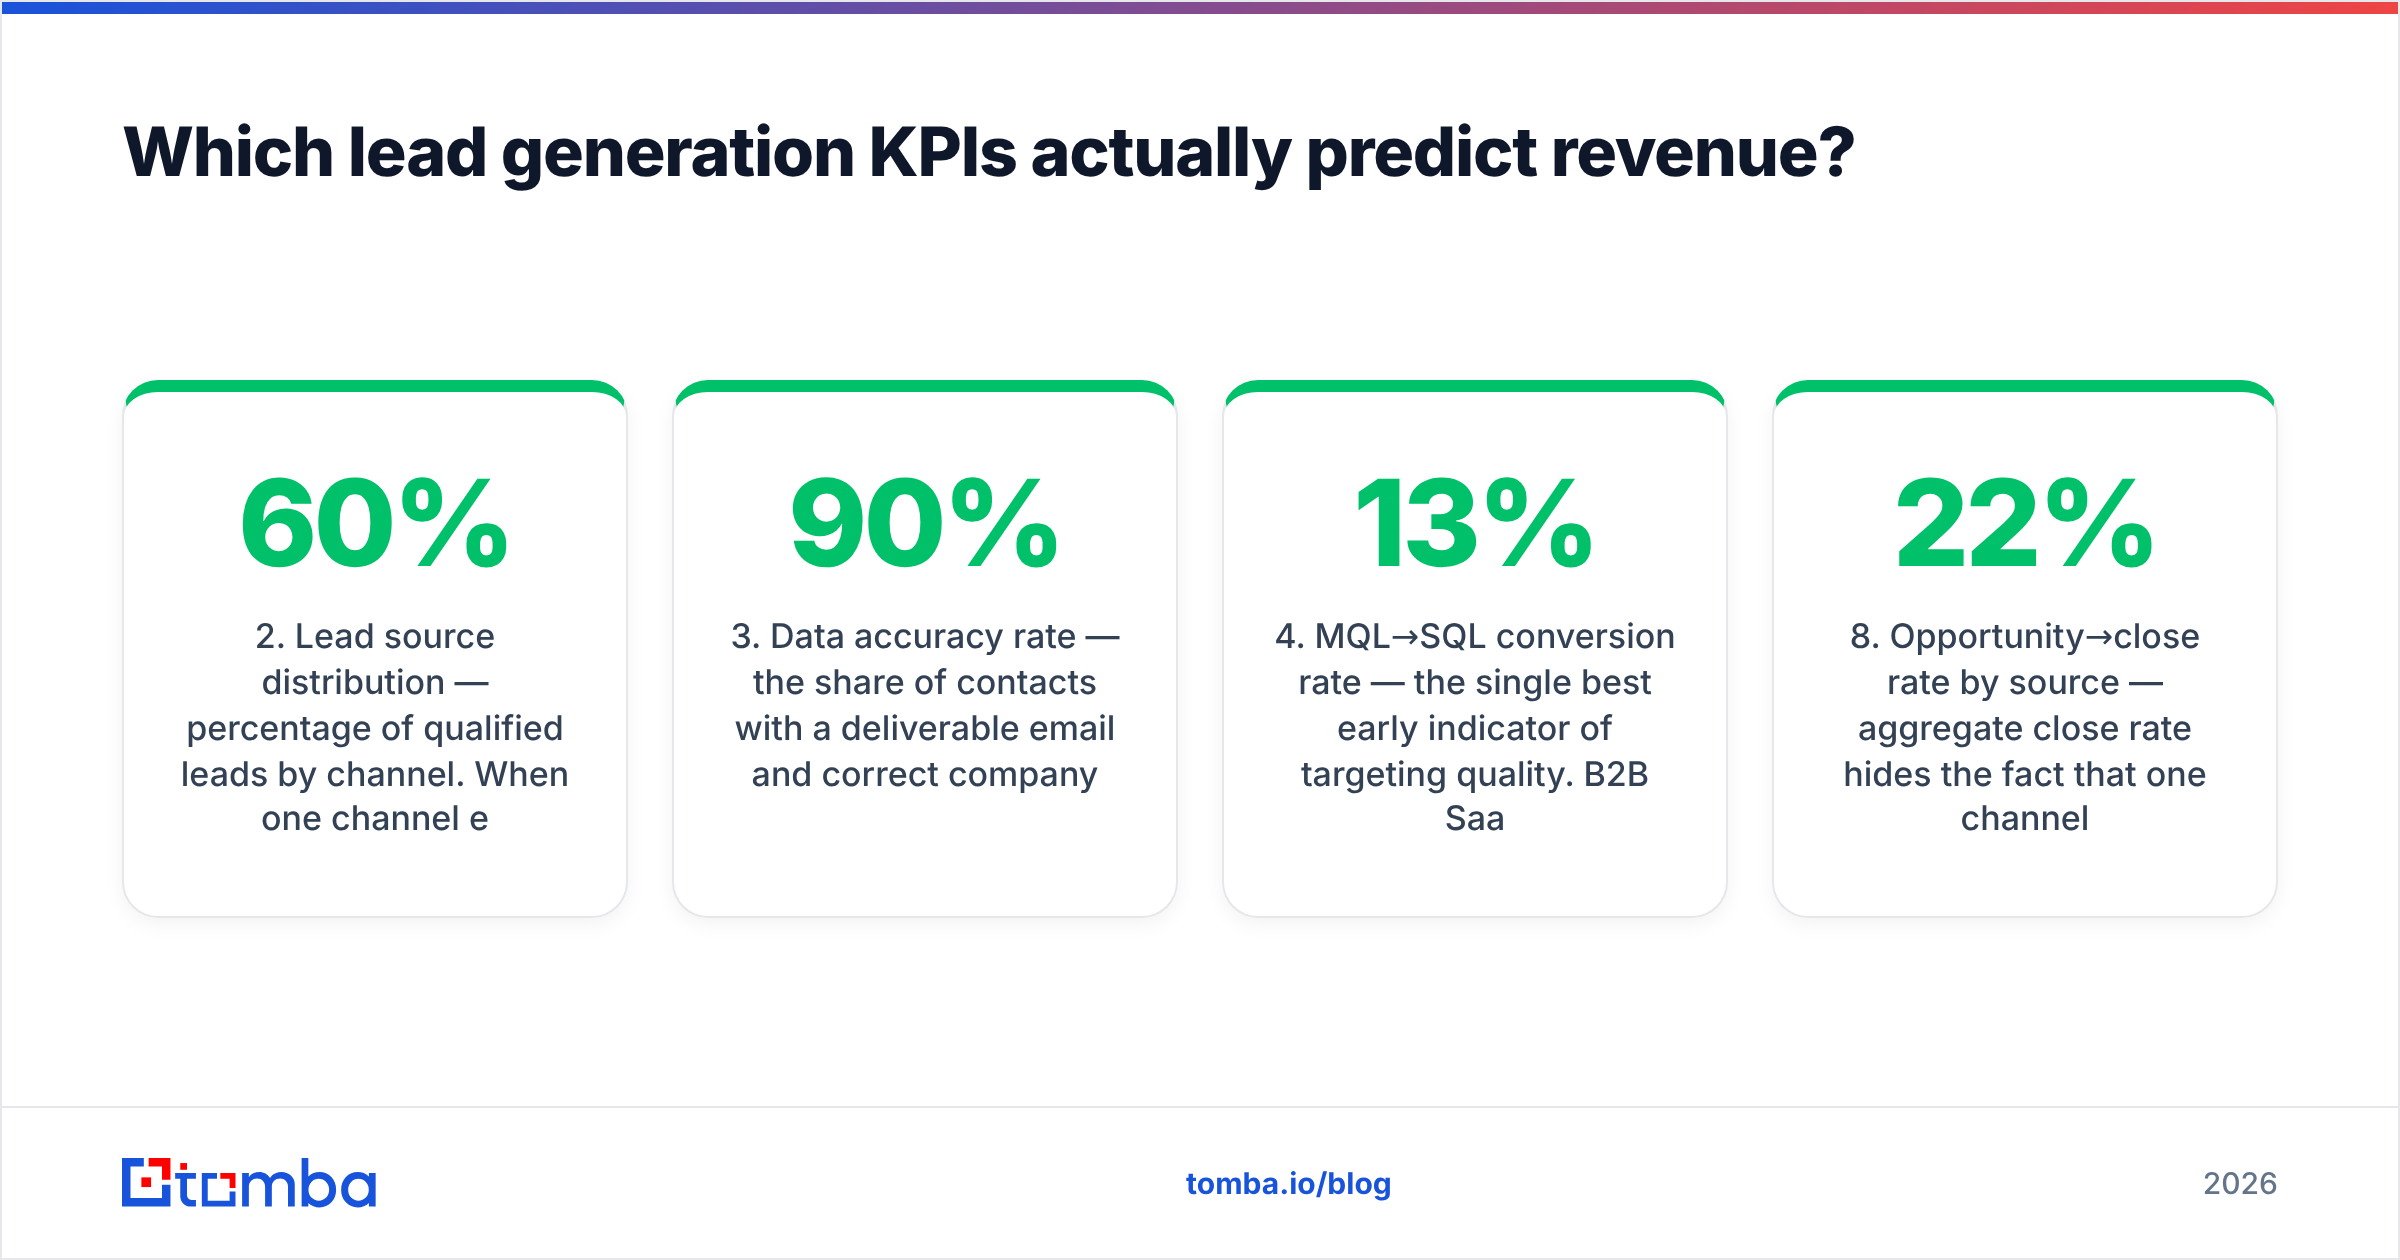
- Lead source distribution — percentage of qualified leads by channel. When one channel exceeds 60% of pipeline, you have a concentration risk, not a strategy.
- Data accuracy rate — the share of contacts with a deliverable email and correct company mapping. Below 90% and every downstream metric is distorted.
Qualification efficiency (the filter)
- MQL→SQL conversion rate — the single best early indicator of targeting quality. B2B SaaS medians sit near 13%.
- SQL→opportunity rate — measures whether your reps and your qualification criteria agree with each other.
- Lead disqualification reason mix — categorised, not free text. "Wrong company size" and "no budget" demand opposite fixes.
- Speed-to-lead — minutes between form submission and first human contact. The classic Harvard Business Review analysis found firms contacting leads within an hour were nearly seven times more likely to qualify them than those waiting even two hours.
Conversion and velocity (the throughput)
- Opportunity→close rate by source — aggregate close rate hides the fact that one channel converts at 22% and another at 3%.
- Sales cycle length by source — a channel with a 40% longer cycle can be worse than a lower-converting channel with faster turns.
- Pipeline coverage ratio — open pipeline divided by quota. Healthy is 3x to 4x; below 2.5x you are already behind.
- Email response rate — for outbound specifically, the earliest signal that your list and message are matched.
Unit economics (the verdict)
- Cost per qualified lead (CPQL) — total channel spend divided by qualified leads, not raw leads.
- Cost per SQL — the number that actually determines whether a channel scales.
- CAC payback period — months to recover fully loaded acquisition cost. Under 18 months is defensible; under 12 is strong.
How do these KPIs compare across funnel stages?#
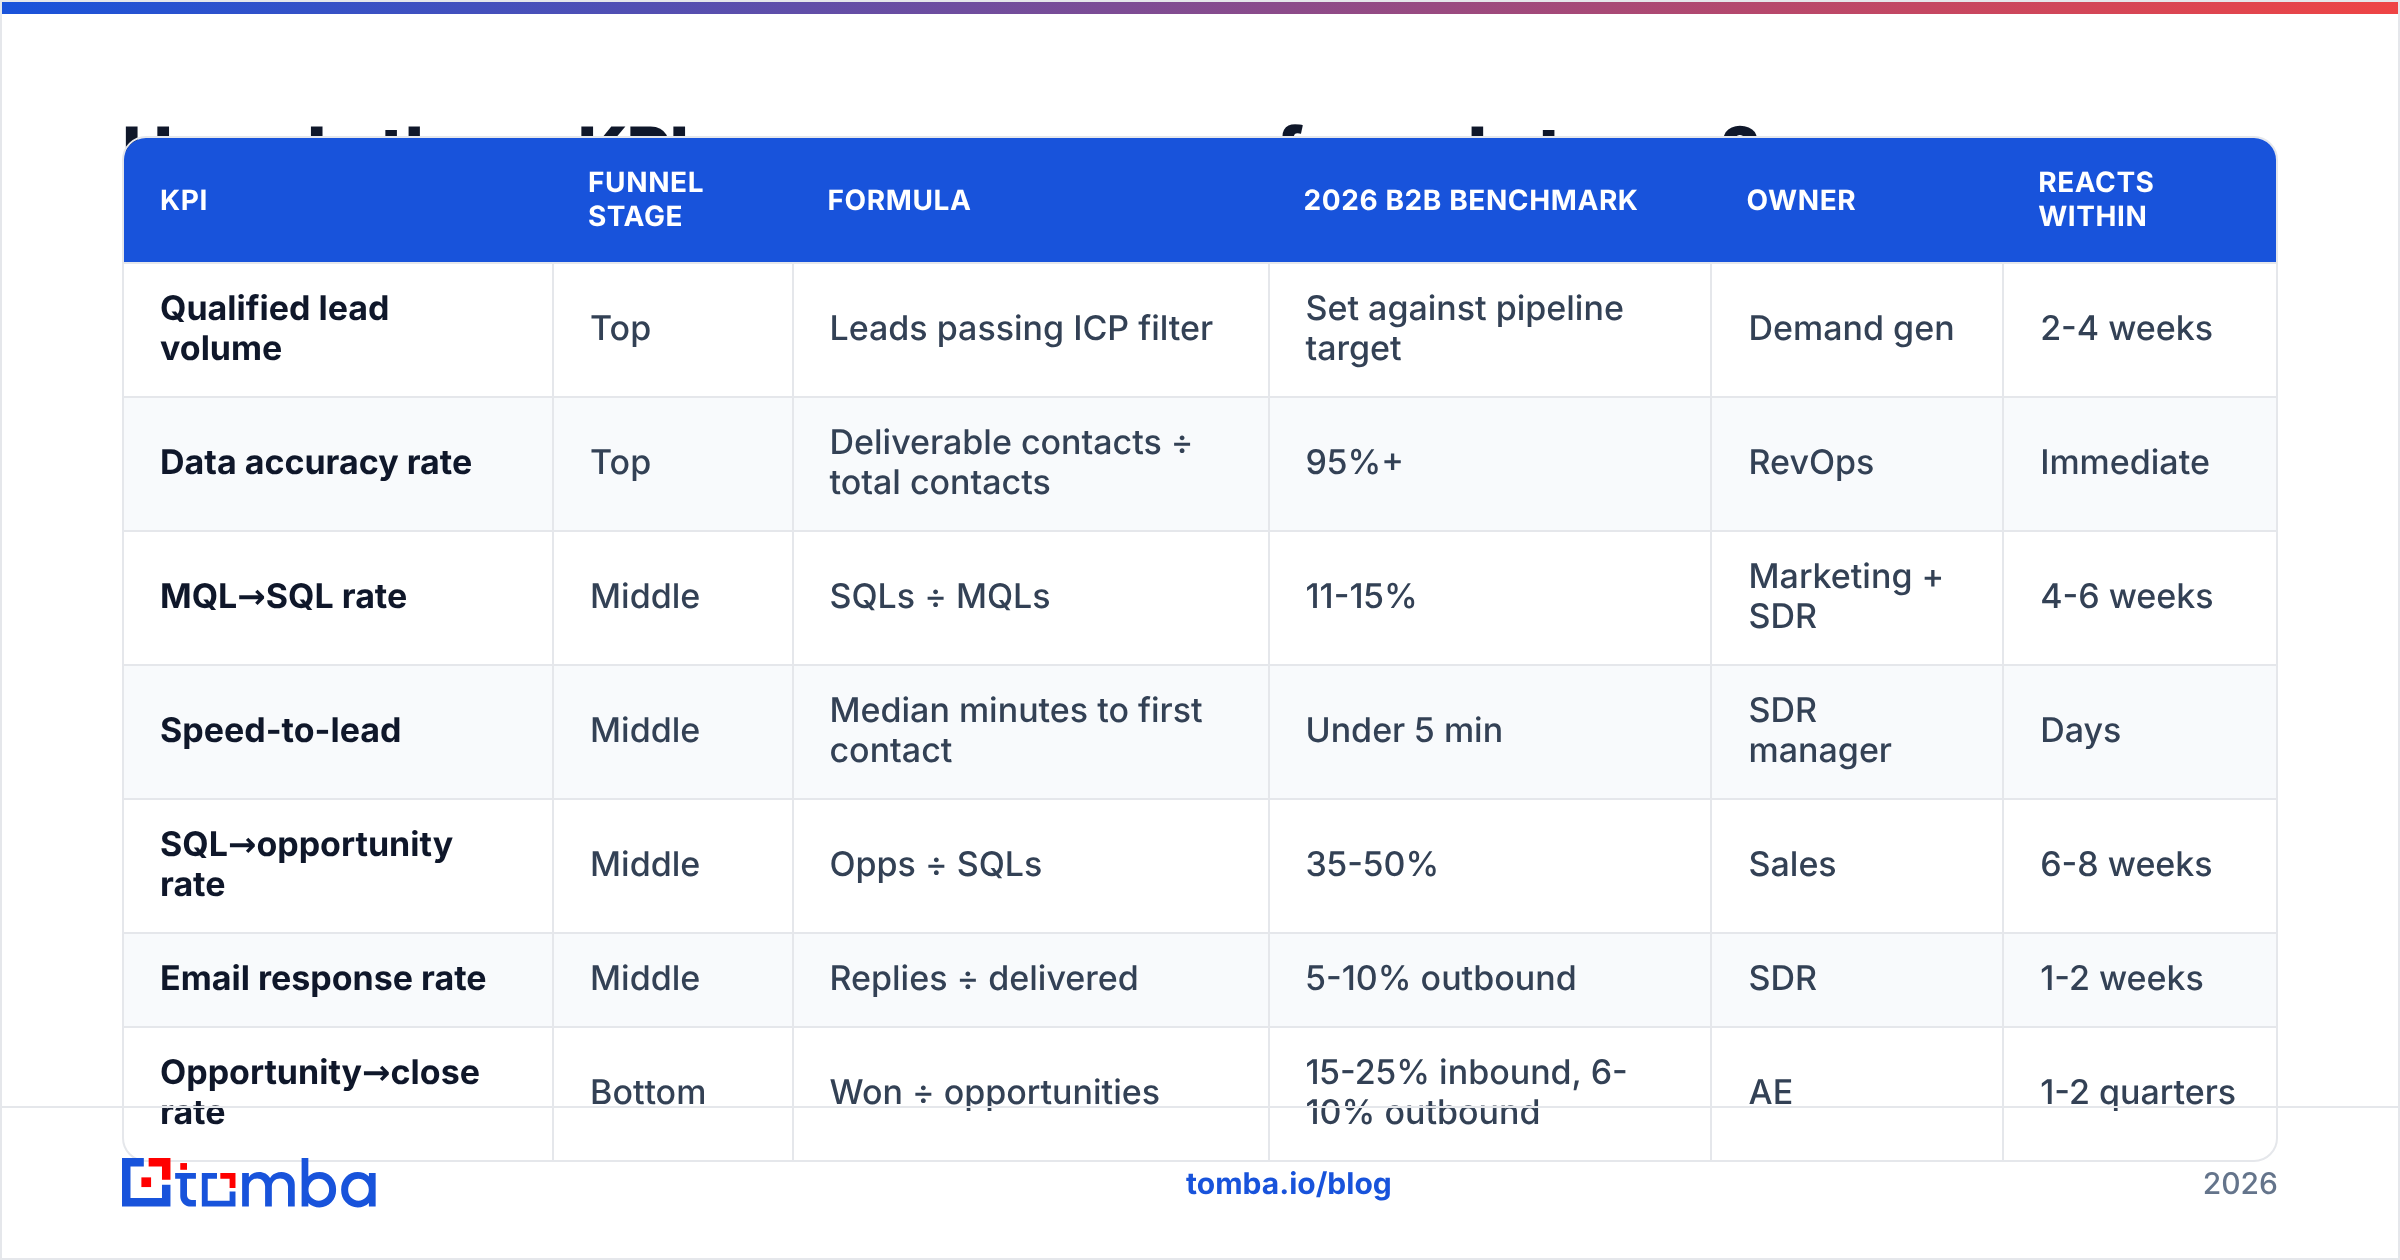
The same metric means different things depending on where it sits. This table is the version I would put on a wall.
| KPI | Funnel stage | Formula | 2026 B2B benchmark | Owner | Reacts within |
|---|---|---|---|---|---|
| Qualified lead volume | Top | Leads passing ICP filter | Set against pipeline target | Demand gen | 2-4 weeks |
| Data accuracy rate | Top | Deliverable contacts ÷ total contacts | 95%+ | RevOps | Immediate |
| MQL→SQL rate | Middle | SQLs ÷ MQLs | 11-15% | Marketing + SDR | 4-6 weeks |
| Speed-to-lead | Middle | Median minutes to first contact | Under 5 min | SDR manager | Days |
| SQL→opportunity rate | Middle | Opps ÷ SQLs | 35-50% | Sales | 6-8 weeks |
| Email response rate | Middle | Replies ÷ delivered | 5-10% outbound | SDR | 1-2 weeks |
| Opportunity→close rate | Bottom | Won ÷ opportunities | 15-25% inbound, 6-10% outbound | AE | 1-2 quarters |
| Pipeline coverage | Bottom | Open pipeline ÷ quota | 3-4x | Sales leadership | Weekly |
| Cost per SQL | Economics | Channel spend ÷ SQLs | $150-$600 | Demand gen | Monthly |
| CAC payback | Economics | CAC ÷ monthly gross margin per customer | Under 18 months | Finance + CRO | 2 quarters |
Read down the "reacts within" column before you set review cadence. Putting CAC payback on a weekly agenda produces noise; putting speed-to-lead on a quarterly one produces damage.
Why do most lead generation dashboards fail?#
Four failure modes account for nearly all of it.
Failure 1: Volume worship. A team hits 4,000 MQLs, celebrates, then discovers 3,100 of them were content downloads from students, competitors, and people at companies with nine employees. The fix is not a new metric — it is a stricter ICP filter applied before anything is counted as an MQL.
Failure 2: Denominator drift. Marketing counts leads from the day they enter the system. Sales counts from the day they are assigned. The two reports diverge by 15%, everyone spends the QBR arguing about the data, and no decision gets made. Write the definitions down once, in one document, and make both teams sign off.
Failure 3: No source-level breakdown. Aggregate numbers are averages of things that should never be averaged. Webinar leads and cold outbound leads behave nothing alike. Every conversion KPI in the table above should be sliceable by source, or it is close to useless for budget decisions.
Failure 4: Ignoring data decay. B2B contact data goes stale at roughly 25-30% per year — people change jobs, companies rebrand, domains migrate. If you are not measuring and refreshing, your database degrades silently while your cost per SQL climbs. G2's category research on lead intelligence tools is a reasonable starting point if you are evaluating vendors to fix this.
How does data quality change your KPI math?#
Directly, and more than people expect. Run the numbers.
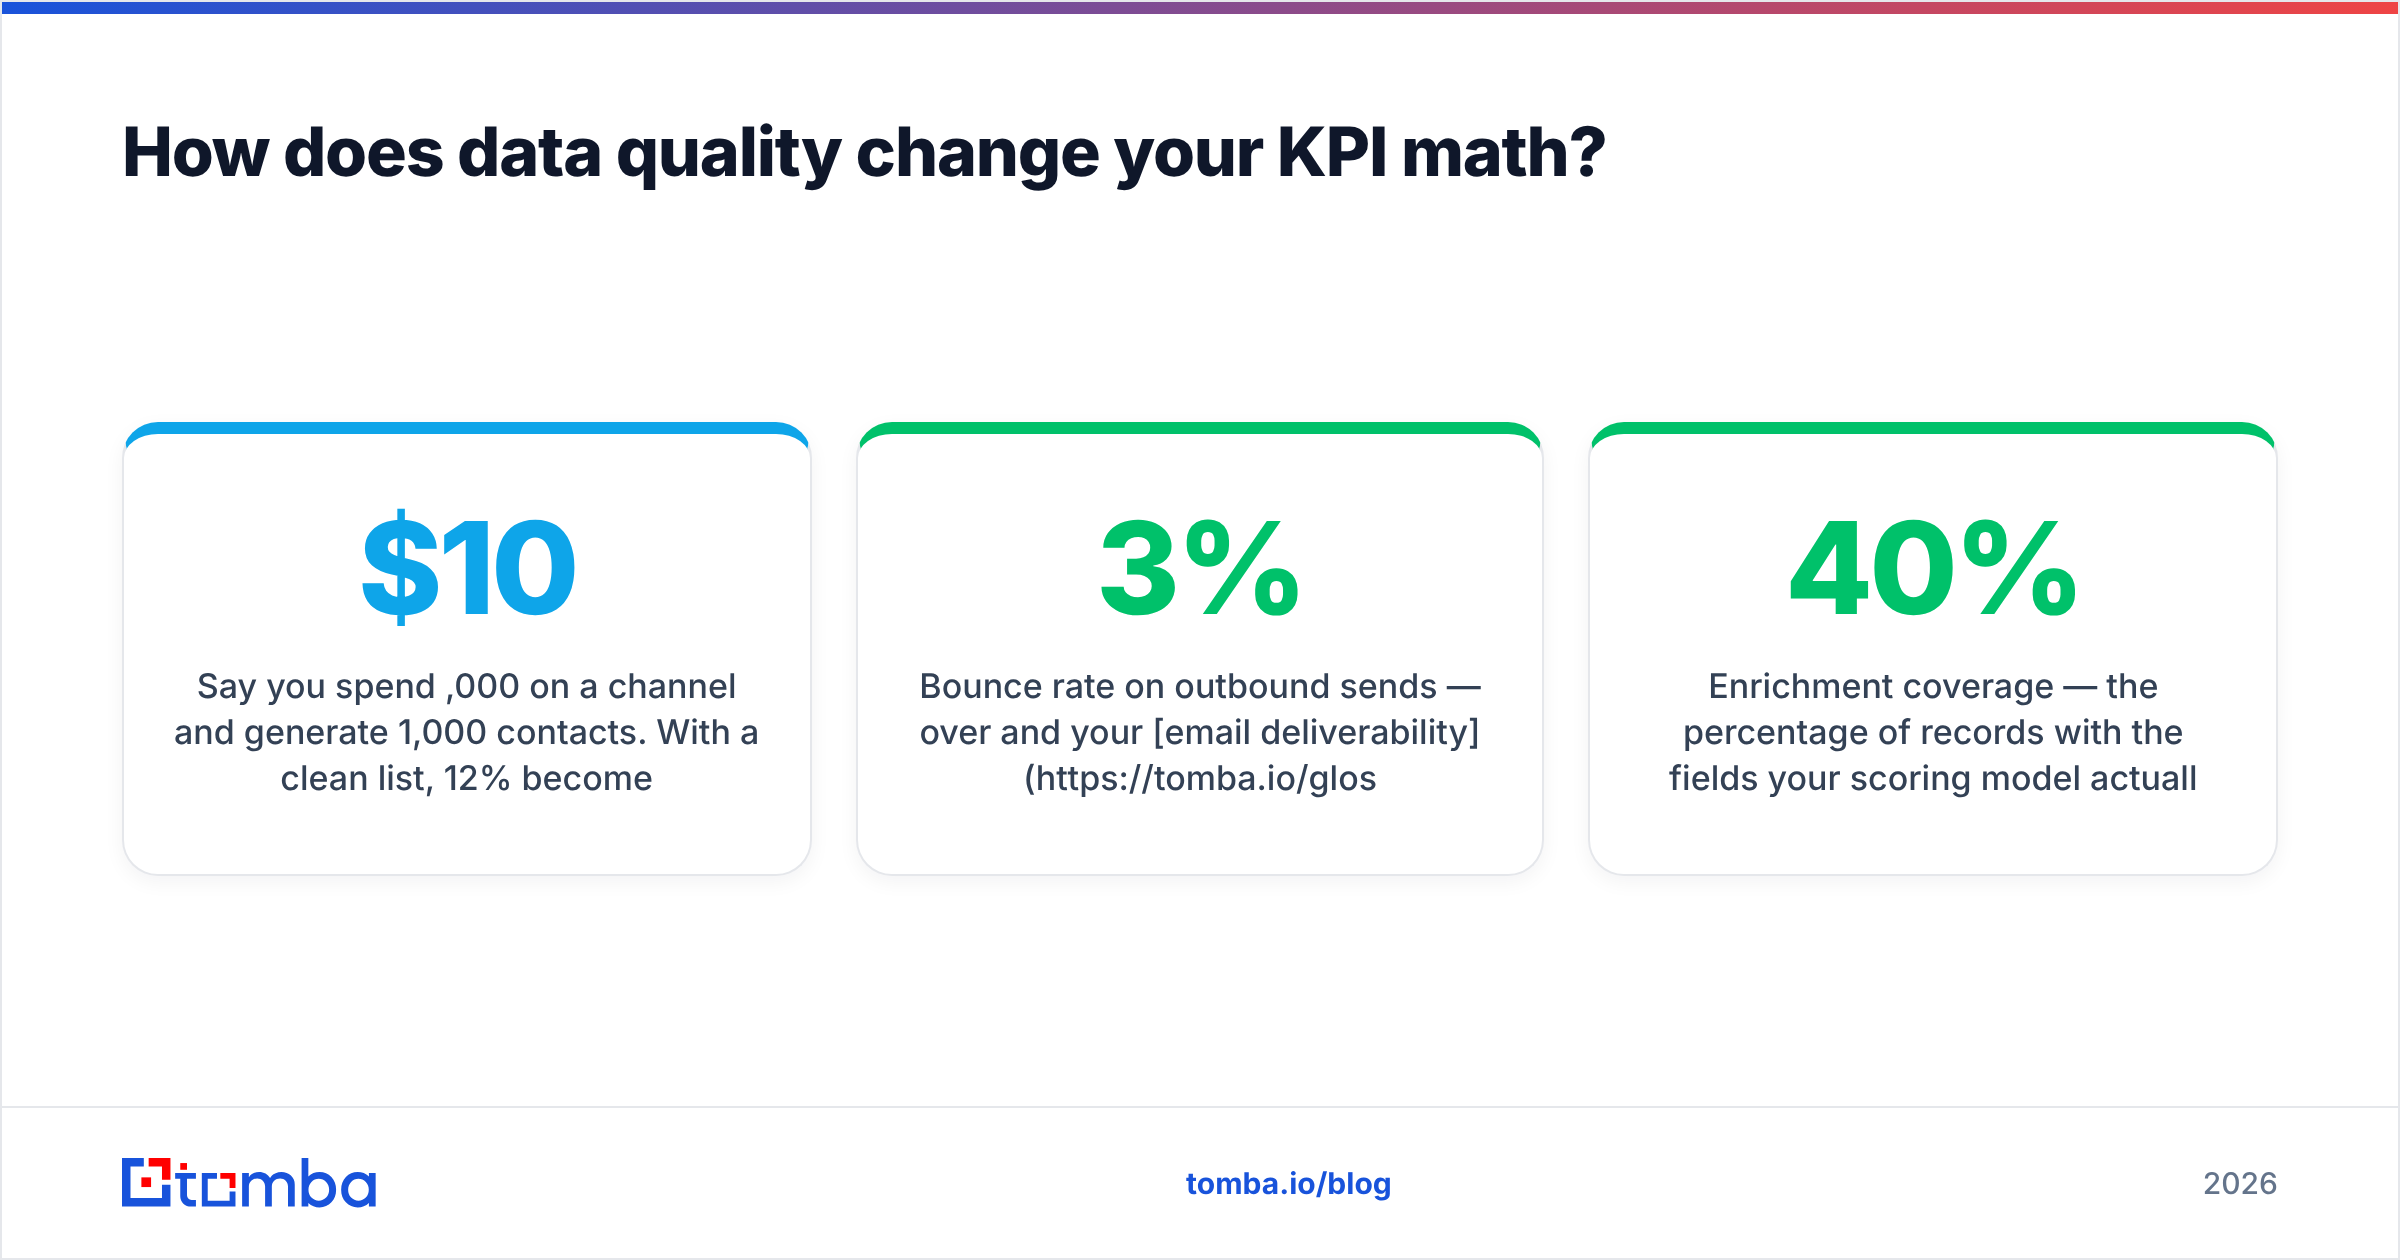
Say you spend $10,000 on a channel and generate 1,000 contacts. With a clean list, 12% become SQLs — 120 SQLs, $83 cost per SQL. Now assume 18% of those contacts are invalid: wrong email, bounced, person left the company. Your effective pool is 820 contacts. The same 12% qualification rate on a real pool yields 98 SQLs and a cost per SQL of $102. Same spend, same messaging, 23% worse economics — purely from data hygiene.
That is why data accuracy belongs on the KPI list, not in a cleanup ticket. Three practical measures:
- Bounce rate on outbound sends — over 3% and your email deliverability starts degrading, which corrupts response rate as a metric too.
- Catch-all share of your list — catch-all domains accept everything and confirm nothing, so they inflate "delivered" without inflating replies. A catch-all verifier separates the genuinely reachable from the merely accepted.
- Enrichment coverage — the percentage of records with the fields your scoring model actually needs. A lead scoring model missing company size on 40% of records is not a model, it is a guess.
Running contacts through an email verifier before they enter the CRM is the cheapest KPI improvement available to most teams, because it fixes the denominator of several metrics at once.

What lead generation KPIs should you stop tracking?#
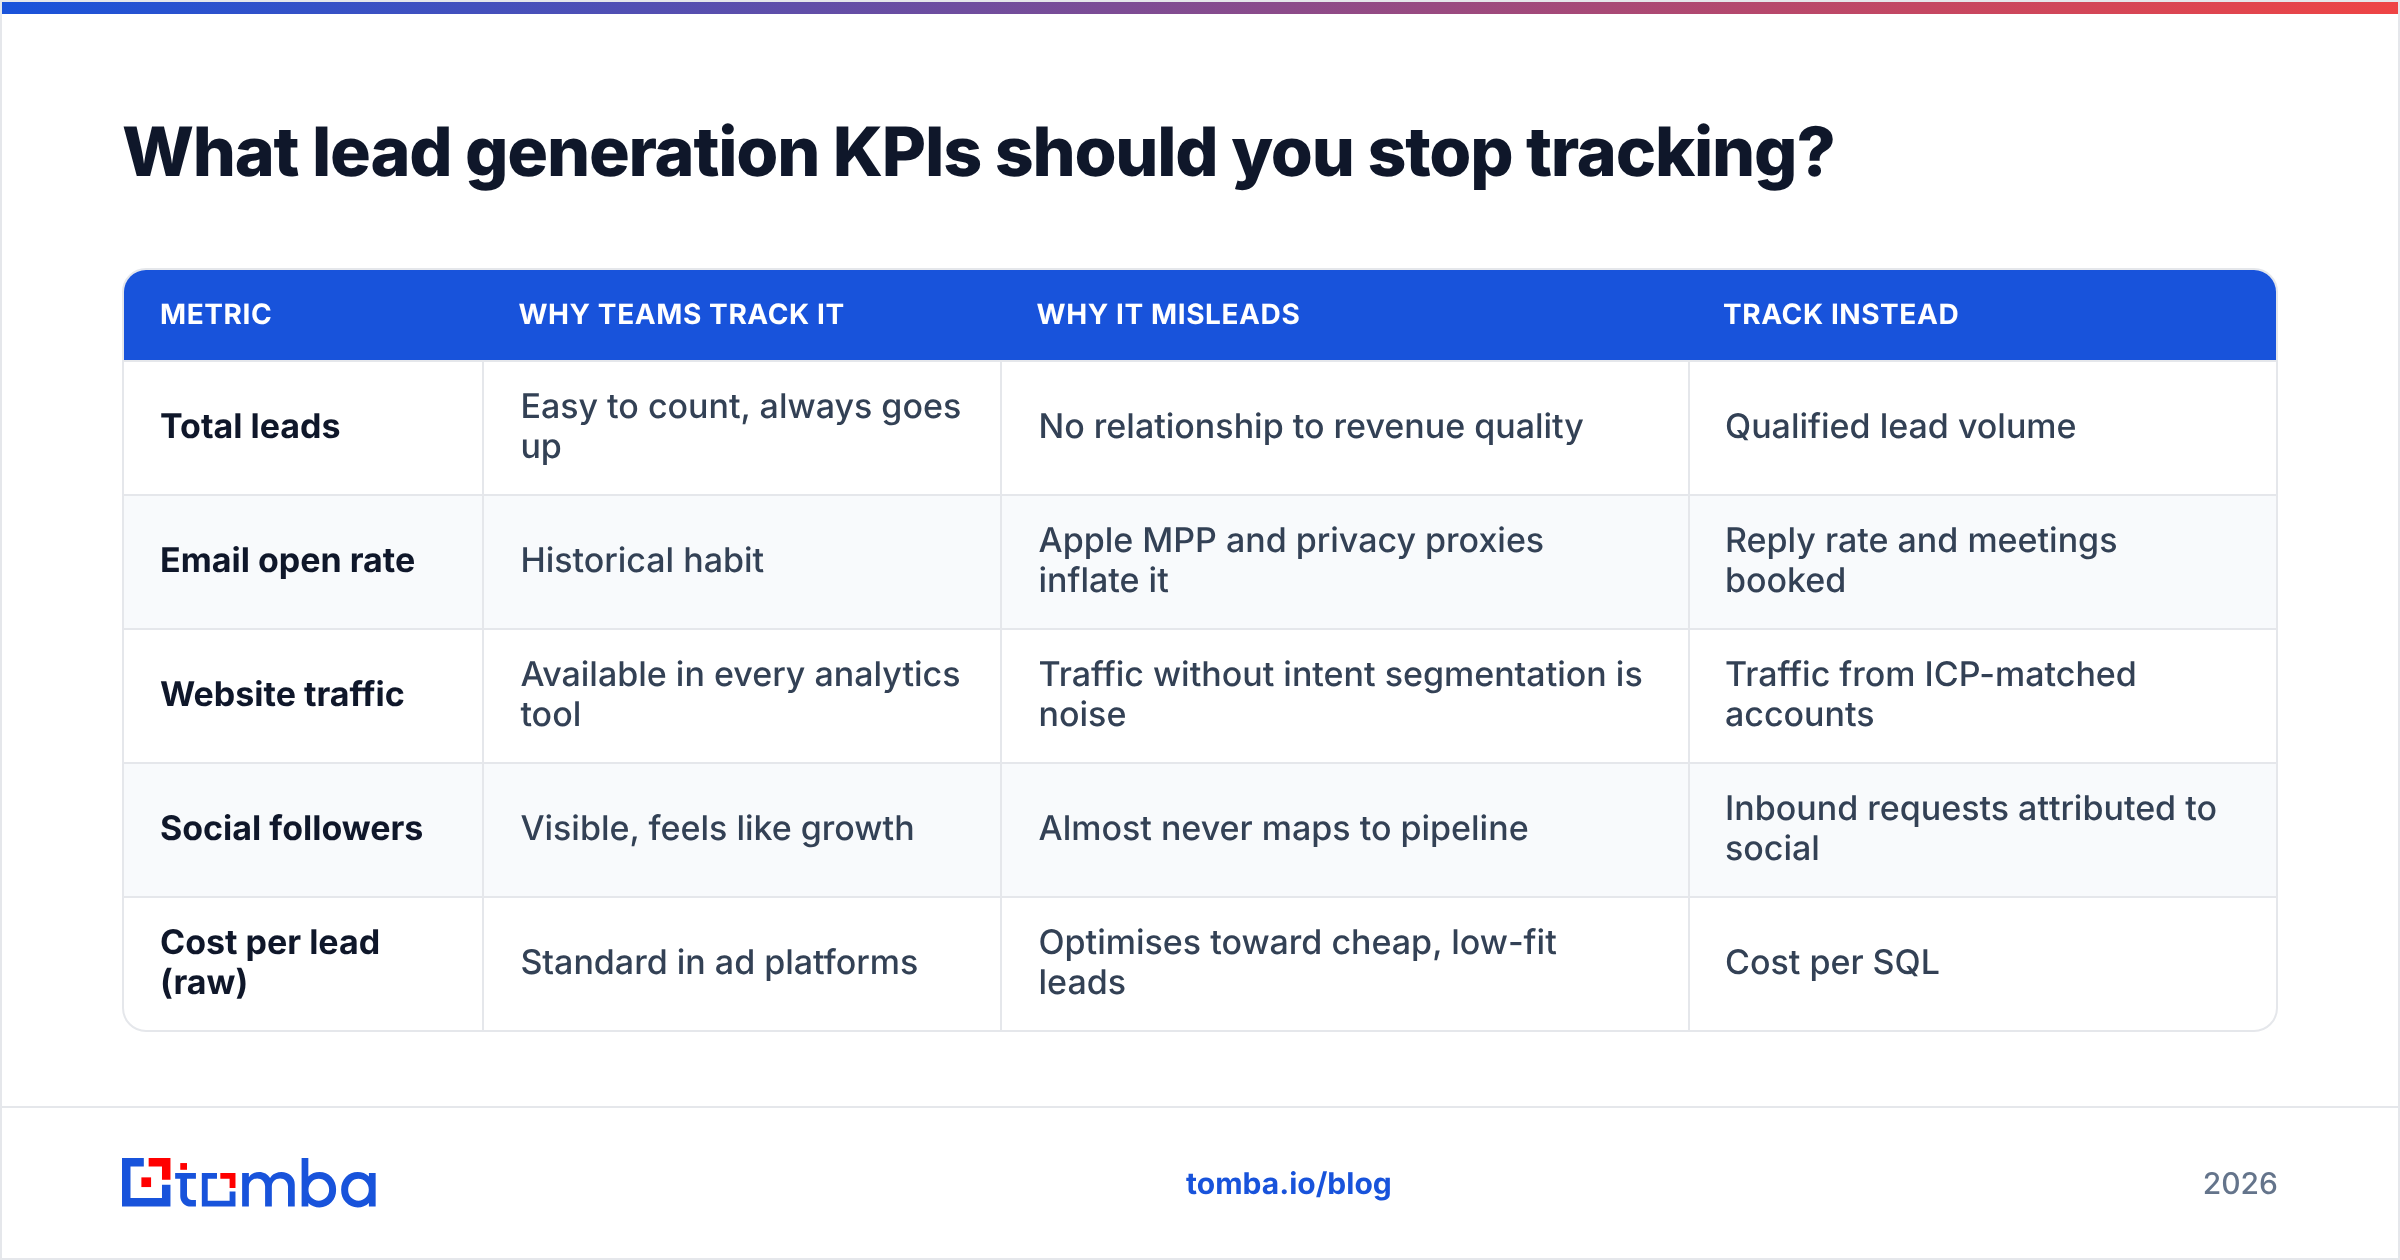
Cutting metrics is as valuable as adding them. These five usually cost more attention than they return.
| Metric | Why teams track it | Why it misleads | Track instead |
|---|---|---|---|
| Total leads | Easy to count, always goes up | No relationship to revenue quality | Qualified lead volume |
| Email open rate | Historical habit | Apple MPP and privacy proxies inflate it | Reply rate and meetings booked |
| Website traffic | Available in every analytics tool | Traffic without intent segmentation is noise | Traffic from ICP-matched accounts |
| Social followers | Visible, feels like growth | Almost never maps to pipeline | Inbound requests attributed to social |
| Cost per lead (raw) | Standard in ad platforms | Optimises toward cheap, low-fit leads | Cost per SQL |
Open rate deserves a specific note. Since Apple's Mail Privacy Protection pre-fetches images, open data is inflated by an unpredictable margin that varies by audience composition. Using it to A/B test subject lines is close to reading tea leaves. If you want to test subject lines, test them against reply rate, or use a subject line tester to pressure-test the copy before it ships.
How do you build the dashboard?#
Two tiers. Not one, not five.
Tier 1 — Leadership view (5 KPIs, monthly): qualified lead volume against target, pipeline coverage ratio, cost per SQL, blended close rate, CAC payback. These answer "are we buying revenue efficiently?" and nothing else belongs here.
Tier 2 — Operating view (the remaining 9, weekly): everything diagnostic. MQL→SQL by source, speed-to-lead distribution, disqualification reasons, data accuracy, response rate, sales cycle length by source. This is where the people doing the work find out what to change on Monday.
Three build rules:
- One source of truth for definitions. A shared doc that defines each metric, its formula, its owner, and its denominator. Update it when definitions change, which they will.
- Source dimension on everything. If a chart cannot be filtered by lead source, rebuild it. Budget decisions happen at the source level.
- Cohort by entry month, not report month. A lead that entered in January and closed in May belongs to January's cohort. Reporting by close month makes every channel look randomly good or bad.
On instrumentation: most of this lives in your CRM already, and Salesforce's own reporting documentation covers the mechanics of campaign influence and custom report types better than any third-party summary. The harder part is the data flowing in. If your sources are a mix of scraped lists, form fills, and exports, you need an enrichment layer that normalises company, role, and contact fields before anything hits a report. Tomba's data enrichment and Tomba API exist for exactly that step — filling the fields your KPIs depend on so the numbers mean something.
What does a healthy KPI review look like?#
Thirty minutes, monthly, with this structure:
- Five minutes on Tier 1. Read the five numbers against target. No discussion yet.
- Ten minutes on the worst-performing source. One channel, deep. What changed, what the disqualification reasons say, what the response rate did.
- Ten minutes on one experiment. What you are testing next month and what number would prove it worked. Define the threshold before you run it, not after.
- Five minutes on data health. Bounce rate, accuracy rate, enrichment coverage. If these are drifting, everything above is suspect.
What makes this work is the prohibition on explaining. Every team has a reflex to narrate why a number is down. Narration is not analysis. If MQL→SQL fell from 14% to 9%, the useful move is to pull the disqualification reason mix, not to describe market conditions.
Also: set thresholds that trigger action automatically. Speed-to-lead median above 15 minutes means routing gets audited this week, not "we should look at that." Bounce rate above 3% means the list gets re-verified before the next send. Pre-committed thresholds beat judgement calls made under pressure.
Where do you start if you have none of this?#
Pick three. Not fourteen. Instrument MQL→SQL rate, cost per SQL, and data accuracy rate first, because they are the three that most often reveal a problem you did not know you had. Get sixty days of clean history on those, then add speed-to-lead and pipeline coverage. Add the economics tier once you have enough closed-won volume for the numbers to be stable — usually 30+ closed deals.
The teams that get this right are not the ones with the prettiest dashboards. They are the ones where five people can name the same five numbers without looking them up, and where each of those five people knows which one they personally own.
Most of your KPI accuracy is decided before any number is calculated — it is decided by whether the contacts entering your funnel are real, current, and correctly attributed to the right company. If your cost per SQL keeps creeping up and nobody can explain why, start by auditing the data, not the campaigns. The Tomba Email Finder finds verified professional emails by domain, name, or company, with a free tier of 25 searches a month and paid plans from $49/mo — enough to test whether your current list quality is the thing quietly distorting every metric on your board deck. Check Tomba pricing if you want to size it against your volume.
Related guides#
// get started
Find, verify and enrich your first contacts today
Start on the free plan with 25 searches a month, then scale when your team is ready.
Free plan · No credit card required · GDPR & CCPA
// about the author