Lead Generation Metrics: The 12 Numbers That Matter in 2026
Most lead gen dashboards track volume and call it performance. Here are the 12 lead generation metrics that actually forecast pipeline — plus the formulas, the benchmarks, and the data problems that quietly break all of them.
TL;DR
- Volume metrics (total leads, MQLs, form fills) tell you how busy marketing was. Conversion-and-cost metrics (MQL→SQL rate, cost per SQL, pipeline velocity) tell you whether the machine actually works.
- Track 12 metrics, not 40. Four for volume, four for quality, four for economics — anything else is a diagnostic you pull when one of those twelve moves.
- Every downstream metric inherits your contact data quality. A 12% bounce rate does not just hurt deliverability; it silently inflates your MQL count and deflates your MQL→SQL rate.
- Benchmarks are directional, not verdicts. A 13% MQL→SQL rate is excellent in SMB self-serve and terrible in enterprise outbound. Compare yourself to last quarter, not to a blog post.
- The single highest-leverage number most teams do not track: cost per qualified opportunity, not cost per lead.
What Are Lead Generation Metrics, Really?#
Lead generation metrics are the numbers that describe how efficiently you turn attention into qualified revenue conversations. That is the whole definition. Everything else — the dashboards, the attribution models, the weekly scorecard — is packaging.
The problem is that most teams measure the inputs (traffic, form fills, connects, list size) because inputs are easy to count and easy to increase. Outputs are harder to count, slower to move, and occasionally embarrassing. So dashboards drift toward volume, and by Q3 you have a lead generation program that produces 4,000 "leads" a quarter and 11 closed deals, and nobody can point at the specific number that explains why.
A useful metric has three properties:
- It changes a decision. If the number moves 30% in either direction and you would do nothing differently, stop tracking it on the main dashboard. Move it to a diagnostic tab.
- It has an owner. "Conversion rate" owned by nobody is a status update. "Demo-request-to-held rate, owned by SDR management" is a job.
- It survives segmentation. A blended number that mixes inbound content leads with cold outbound prospects is an average of two unrelated businesses. Segment by source before you compare to anything.
- It connects to a dollar. Either it sits upstream of pipeline value or it sits inside a cost equation. Metrics that do neither are trivia.
- It is comparable over time. If you redefined "MQL" in March, your year-over-year chart is fiction. Version your definitions like you version code.
Which Lead Generation Metrics Actually Predict Revenue?#
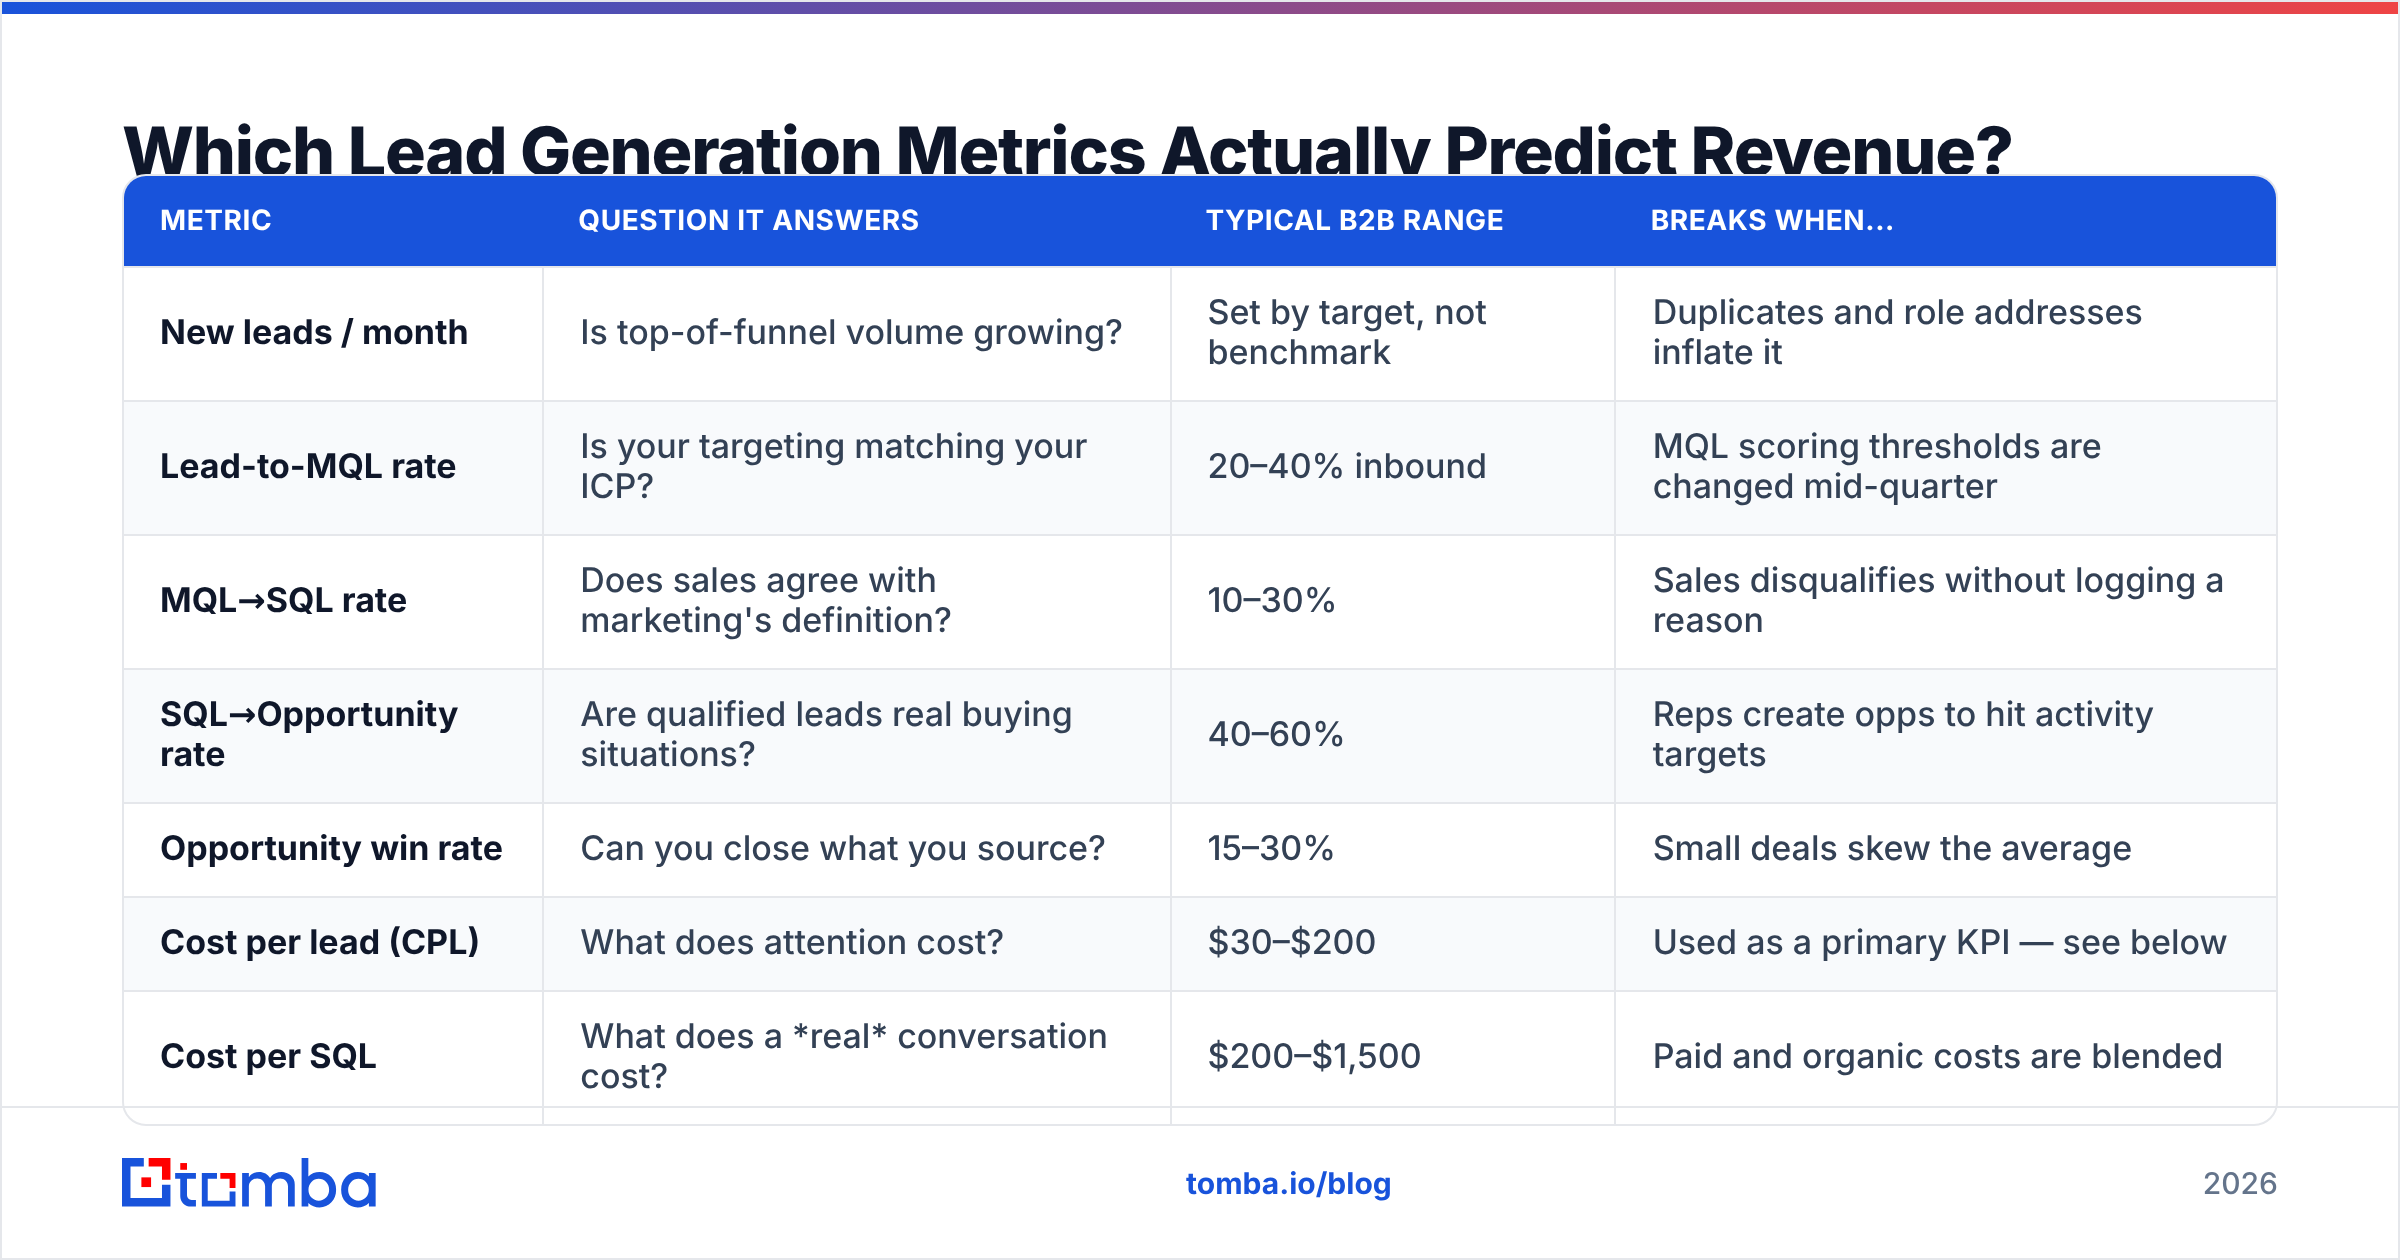
Here is the working set. Twelve metrics, grouped by what question they answer. If your dashboard has more than this on the front page, you are reporting, not managing.
| Metric | Question it answers | Typical B2B range | Breaks when... |
|---|---|---|---|
| New leads / month | Is top-of-funnel volume growing? | Set by target, not benchmark | Duplicates and role addresses inflate it |
| Lead-to-MQL rate | Is your targeting matching your ICP? | 20–40% inbound | MQL scoring thresholds are changed mid-quarter |
| MQL→SQL rate | Does sales agree with marketing's definition? | 10–30% | Sales disqualifies without logging a reason |
| SQL→Opportunity rate | Are qualified leads real buying situations? | 40–60% | Reps create opps to hit activity targets |
| Opportunity win rate | Can you close what you source? | 15–30% | Small deals skew the average |
| Cost per lead (CPL) | What does attention cost? | $30–$200 | Used as a primary KPI — see below |
| Cost per SQL | What does a real conversation cost? | $200–$1,500 | Paid and organic costs are blended |
| Customer acquisition cost (CAC) | What does a customer cost, fully loaded? | Varies wildly | Sales salaries are excluded |
| Average sales cycle length | How long is cash locked up? | 30–120 days | Measured from opp creation, not first touch |
| Pipeline velocity | How fast does money move? | Trend matters, not absolute | Any of its four inputs is stale |
| Email deliverability rate | Does outbound actually arrive? | 95%+ | List is unverified |
| Reply-to-meeting rate | Is your message worth a calendar slot? | 20–35% of positive replies | Auto-replies counted as replies |
Two notes on this table. First, the ranges are directional. HubSpot's marketing benchmark research and Gartner's sales practice both publish wide distributions for exactly this reason — industry, ACV, and motion move these numbers more than competence does.
Second, notice what is missing: impressions, followers, email opens, "engagement." Apple Mail Privacy Protection made open rates statistically useless for B2B in 2021 and nothing has fixed it since. If a metric on your dashboard was last credible during the Obama administration, retire it.
What's the Difference Between a Vanity Metric and a Decision Metric?#
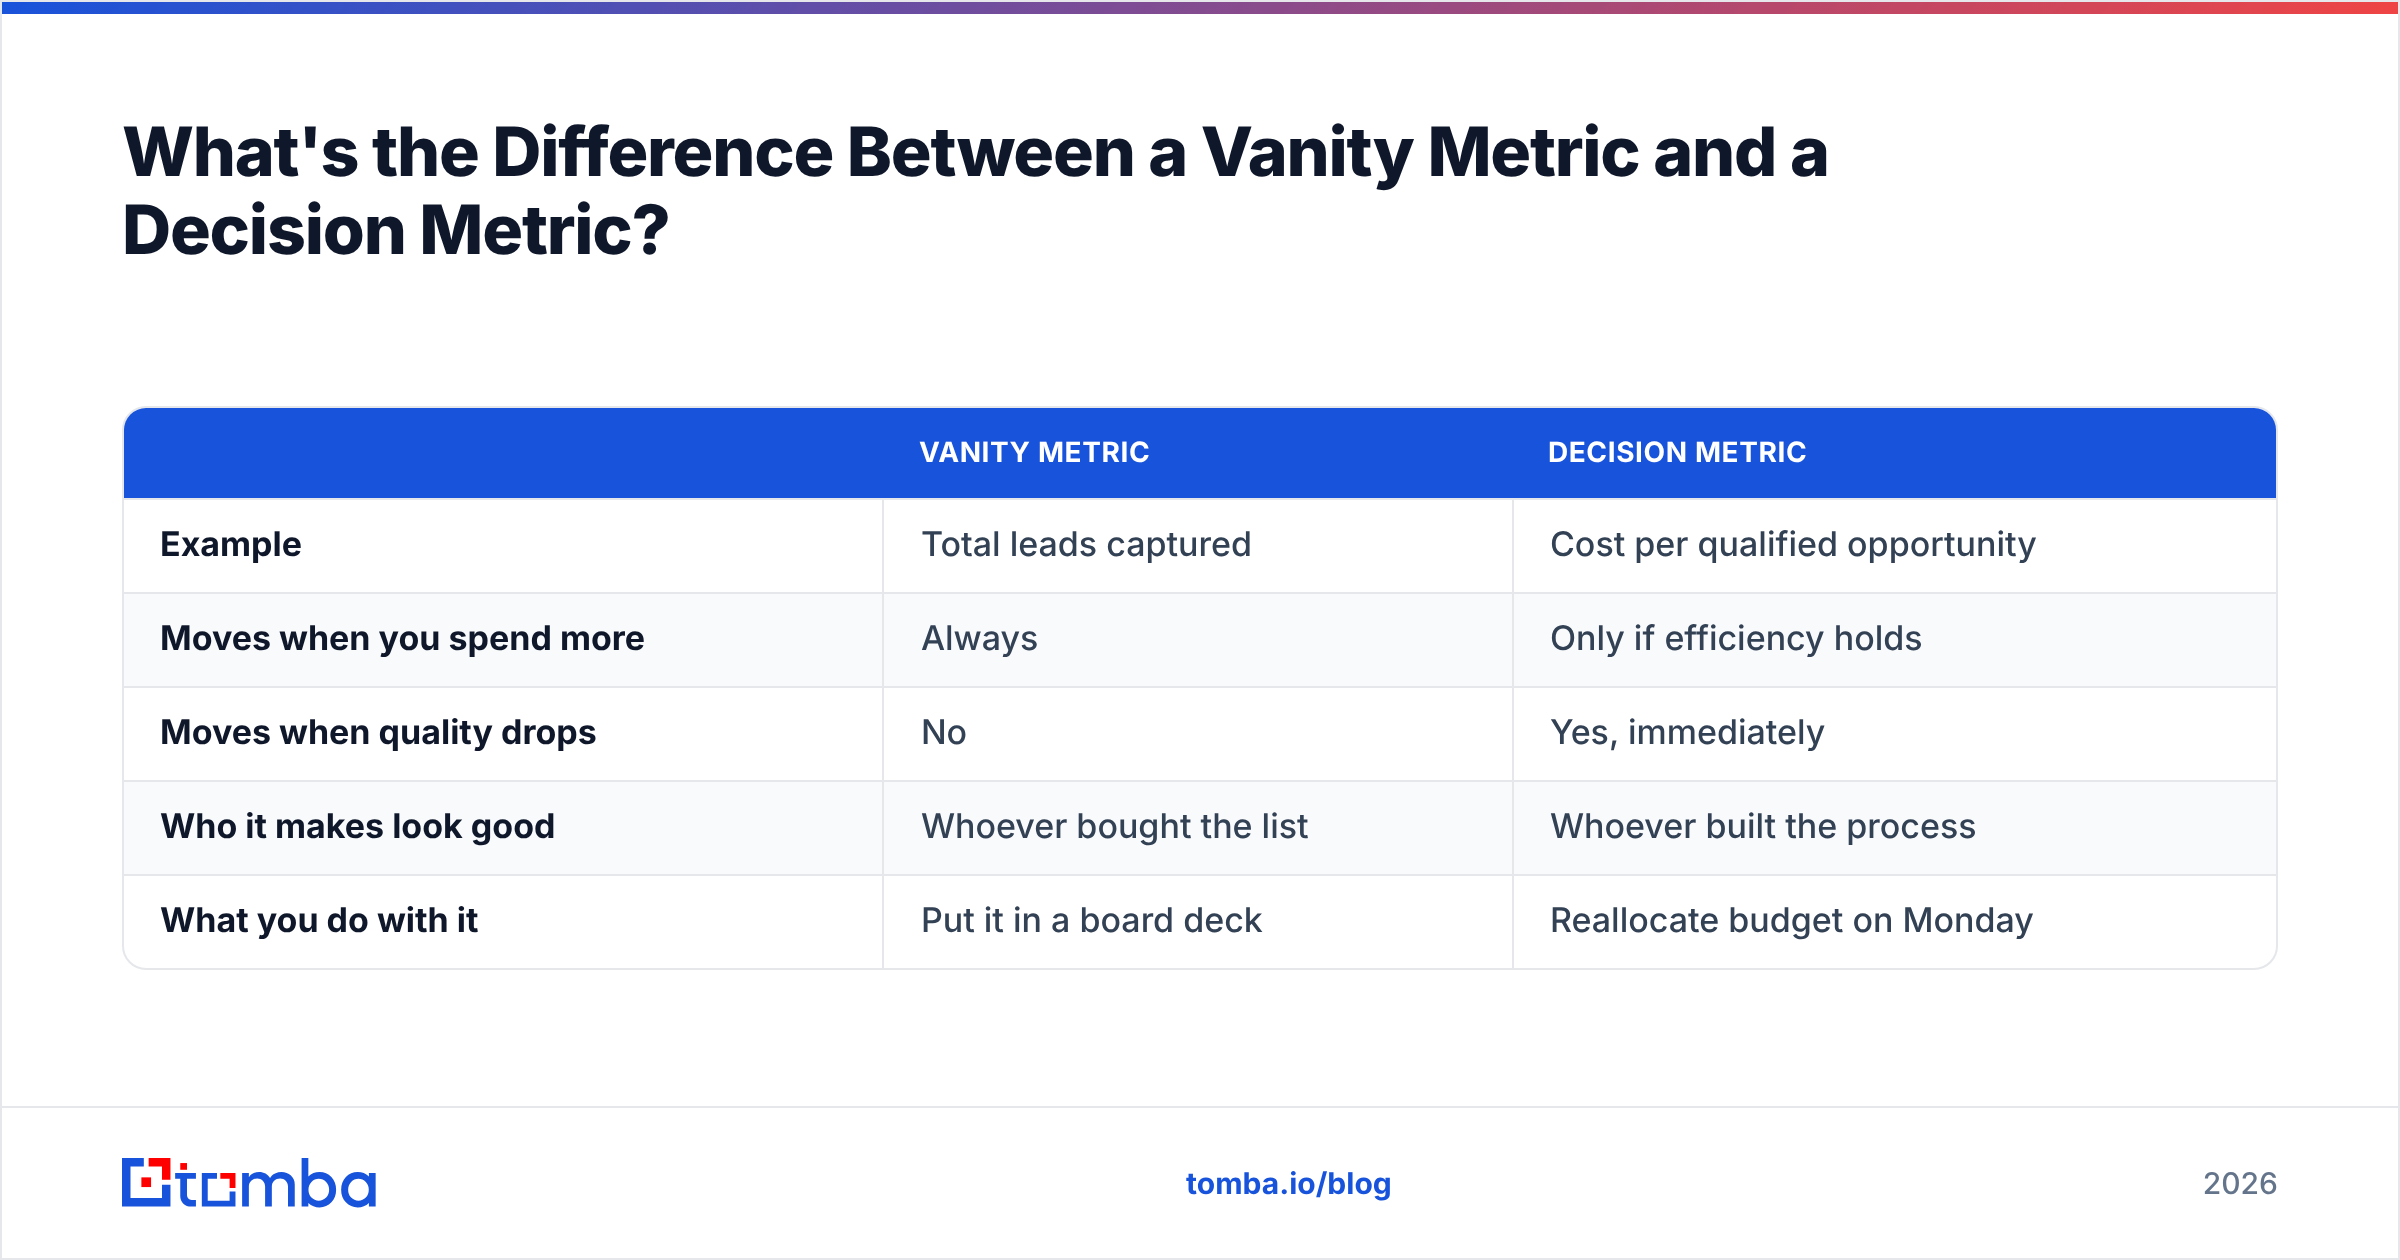
A vanity metric goes up when you spend more and never goes down when something is broken. That is the whole test.
| Vanity metric | Decision metric | |
|---|---|---|
| Example | Total leads captured | Cost per qualified opportunity |
| Moves when you spend more | Always | Only if efficiency holds |
| Moves when quality drops | No | Yes, immediately |
| Who it makes look good | Whoever bought the list | Whoever built the process |
| What you do with it | Put it in a board deck | Reallocate budget on Monday |
The most common failure I see in B2B reporting: a team celebrates a 40% increase in MQLs while cost per SQL doubles. Both statements are true. Only one of them describes the business.
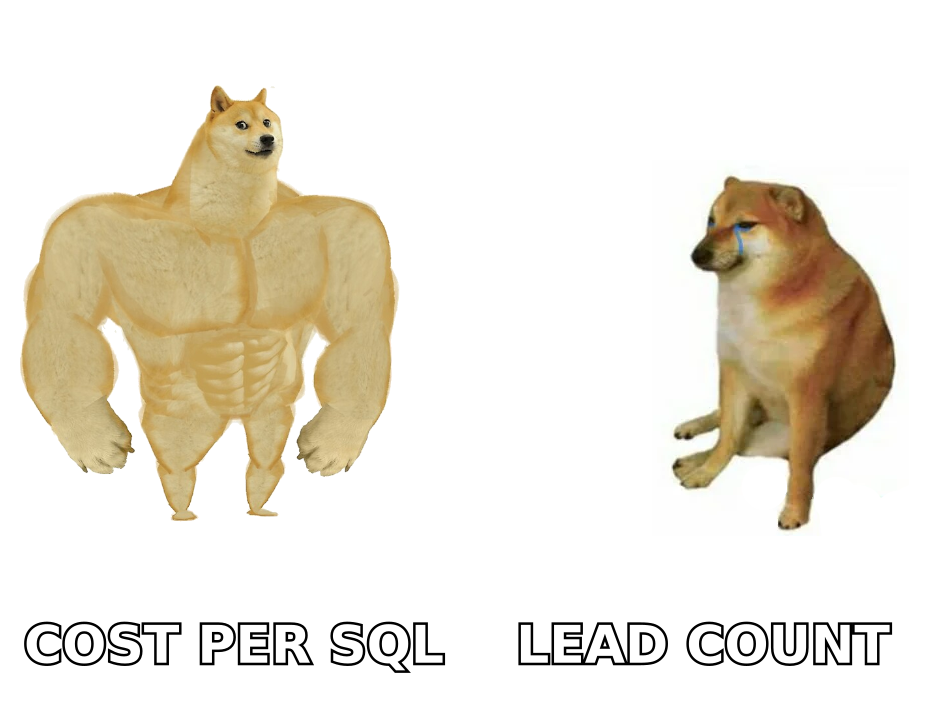
Cost per lead is the worst offender because it is almost useful. It is a legitimate diagnostic for channel comparison — if LinkedIn costs $180 per lead and a partner webinar costs $40, that is worth knowing. But as a primary KPI it actively rewards the wrong behavior, because the cheapest way to lower CPL is to lower the bar for what counts as a lead. Scraped lists and gated PDF downloads are cheap. Neither buys anything.
Replace CPL on the front page with cost per qualified opportunity: total acquisition spend divided by opportunities that passed sales qualification. It is slower to compute and much harder to game.
How Do You Calculate the Core Formulas?#
Four formulas cover 80% of the reporting work.
Conversion rate between any two stages
Stage B entries ÷ Stage A entries (same cohort) × 100The words "same cohort" are doing all the work. If you divide this month's SQLs by this month's MQLs, you are comparing two different groups of people, and in any business with a sales cycle longer than three weeks the result is noise. Track by cohort: leads that entered in January, and where they ended up 90 days later.
Pipeline velocity
(Number of opportunities × Average deal value × Win rate) ÷ Sales cycle length in daysThis produces dollars-per-day, which is the closest thing B2B has to a single health number. Its value is not the absolute figure — it is watching which of the four inputs changed when the output drops. Deal count fell? Top-of-funnel problem. Cycle length grew? Qualification or procurement problem.
Customer acquisition cost
(Total sales spend + total marketing spend) ÷ new customers acquiredFully loaded means salaries, tooling, contractors, and ad spend. Most teams quietly exclude headcount, which cuts reported CAC by half and makes the CAC:LTV ratio look healthy when it is not. The standard definition includes them.
Lead response time
Median minutes between inbound submission and first human contact attemptUse median, not mean — one rep who responded after a weekend will wreck the average. This is the cheapest metric to improve and among the most correlated with conversion. Salesforce's sales research has been saying this for a decade and most teams still respond in hours.
Which Lead Generation Metrics Break When Your Data Is Dirty?#
Almost all of them, and this is the part that rarely makes it into metrics articles.
Contact data quality is not a deliverability issue that lives in its own box. It is an upstream variable that distorts every conversion rate downstream. Work through the chain:
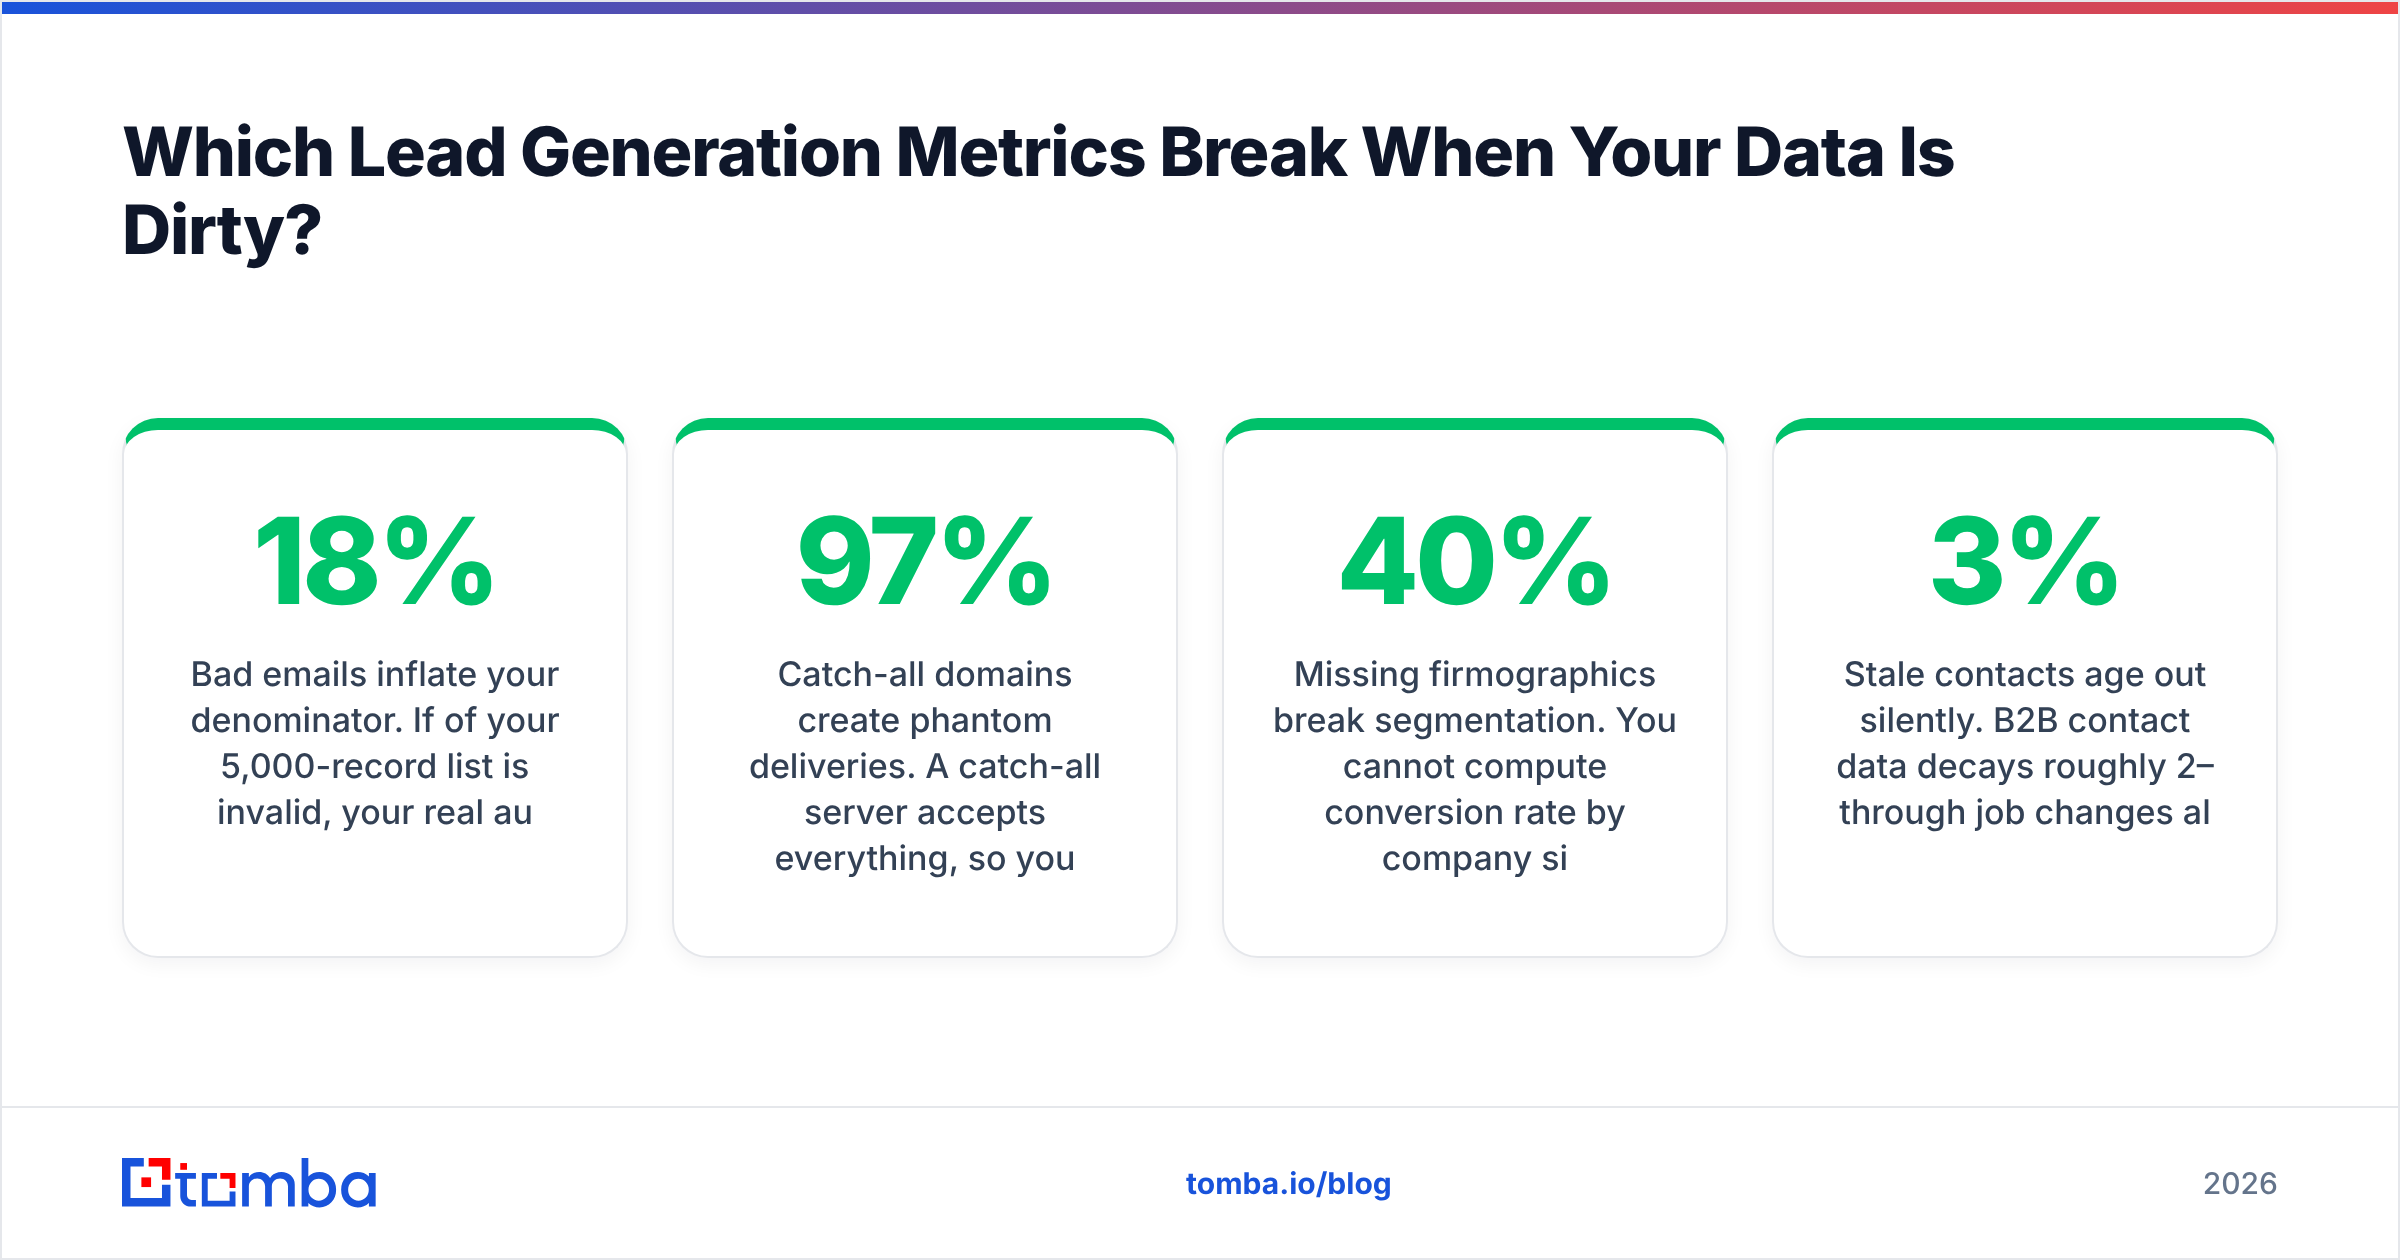
- Bad emails inflate your denominator. If 18% of your 5,000-record list is invalid, your real audience is 4,100. Every conversion rate you calculate against 5,000 is understated by roughly a fifth, and you will "fix" a messaging problem that does not exist.
- Catch-all domains create phantom deliveries. A catch-all server accepts everything, so your ESP reports a delivery. Nobody read it. Your deliverability metric says 97% and your reply rate says something is deeply wrong. Both are correct. Running a catch-all verifier before send separates "delivered" from "arrived at a human."
- Duplicates double-count MQLs. The same person filling two forms under two email aliases is one buyer and two MQLs. At scale this makes lead-to-MQL rate look excellent and MQL→SQL rate look broken.
- Missing firmographics break segmentation. You cannot compute conversion rate by company size if 40% of records have no company size. Most teams solve this by dropping the incomplete records, which means the analysis describes the subset of leads that happened to fill in a form field. Contact enrichment fixes the input rather than the report.
- Stale contacts age out silently. B2B contact data decays roughly 2–3% per month through job changes alone. An 18-month-old list is materially different from the one you bought.
The practical fix is boring and effective: verify emails before they enter the CRM, not after a campaign bounces. A bounce that never happens costs nothing to clean up, and your sender reputation never learns about it.

How Often Should You Review Each Metric?#
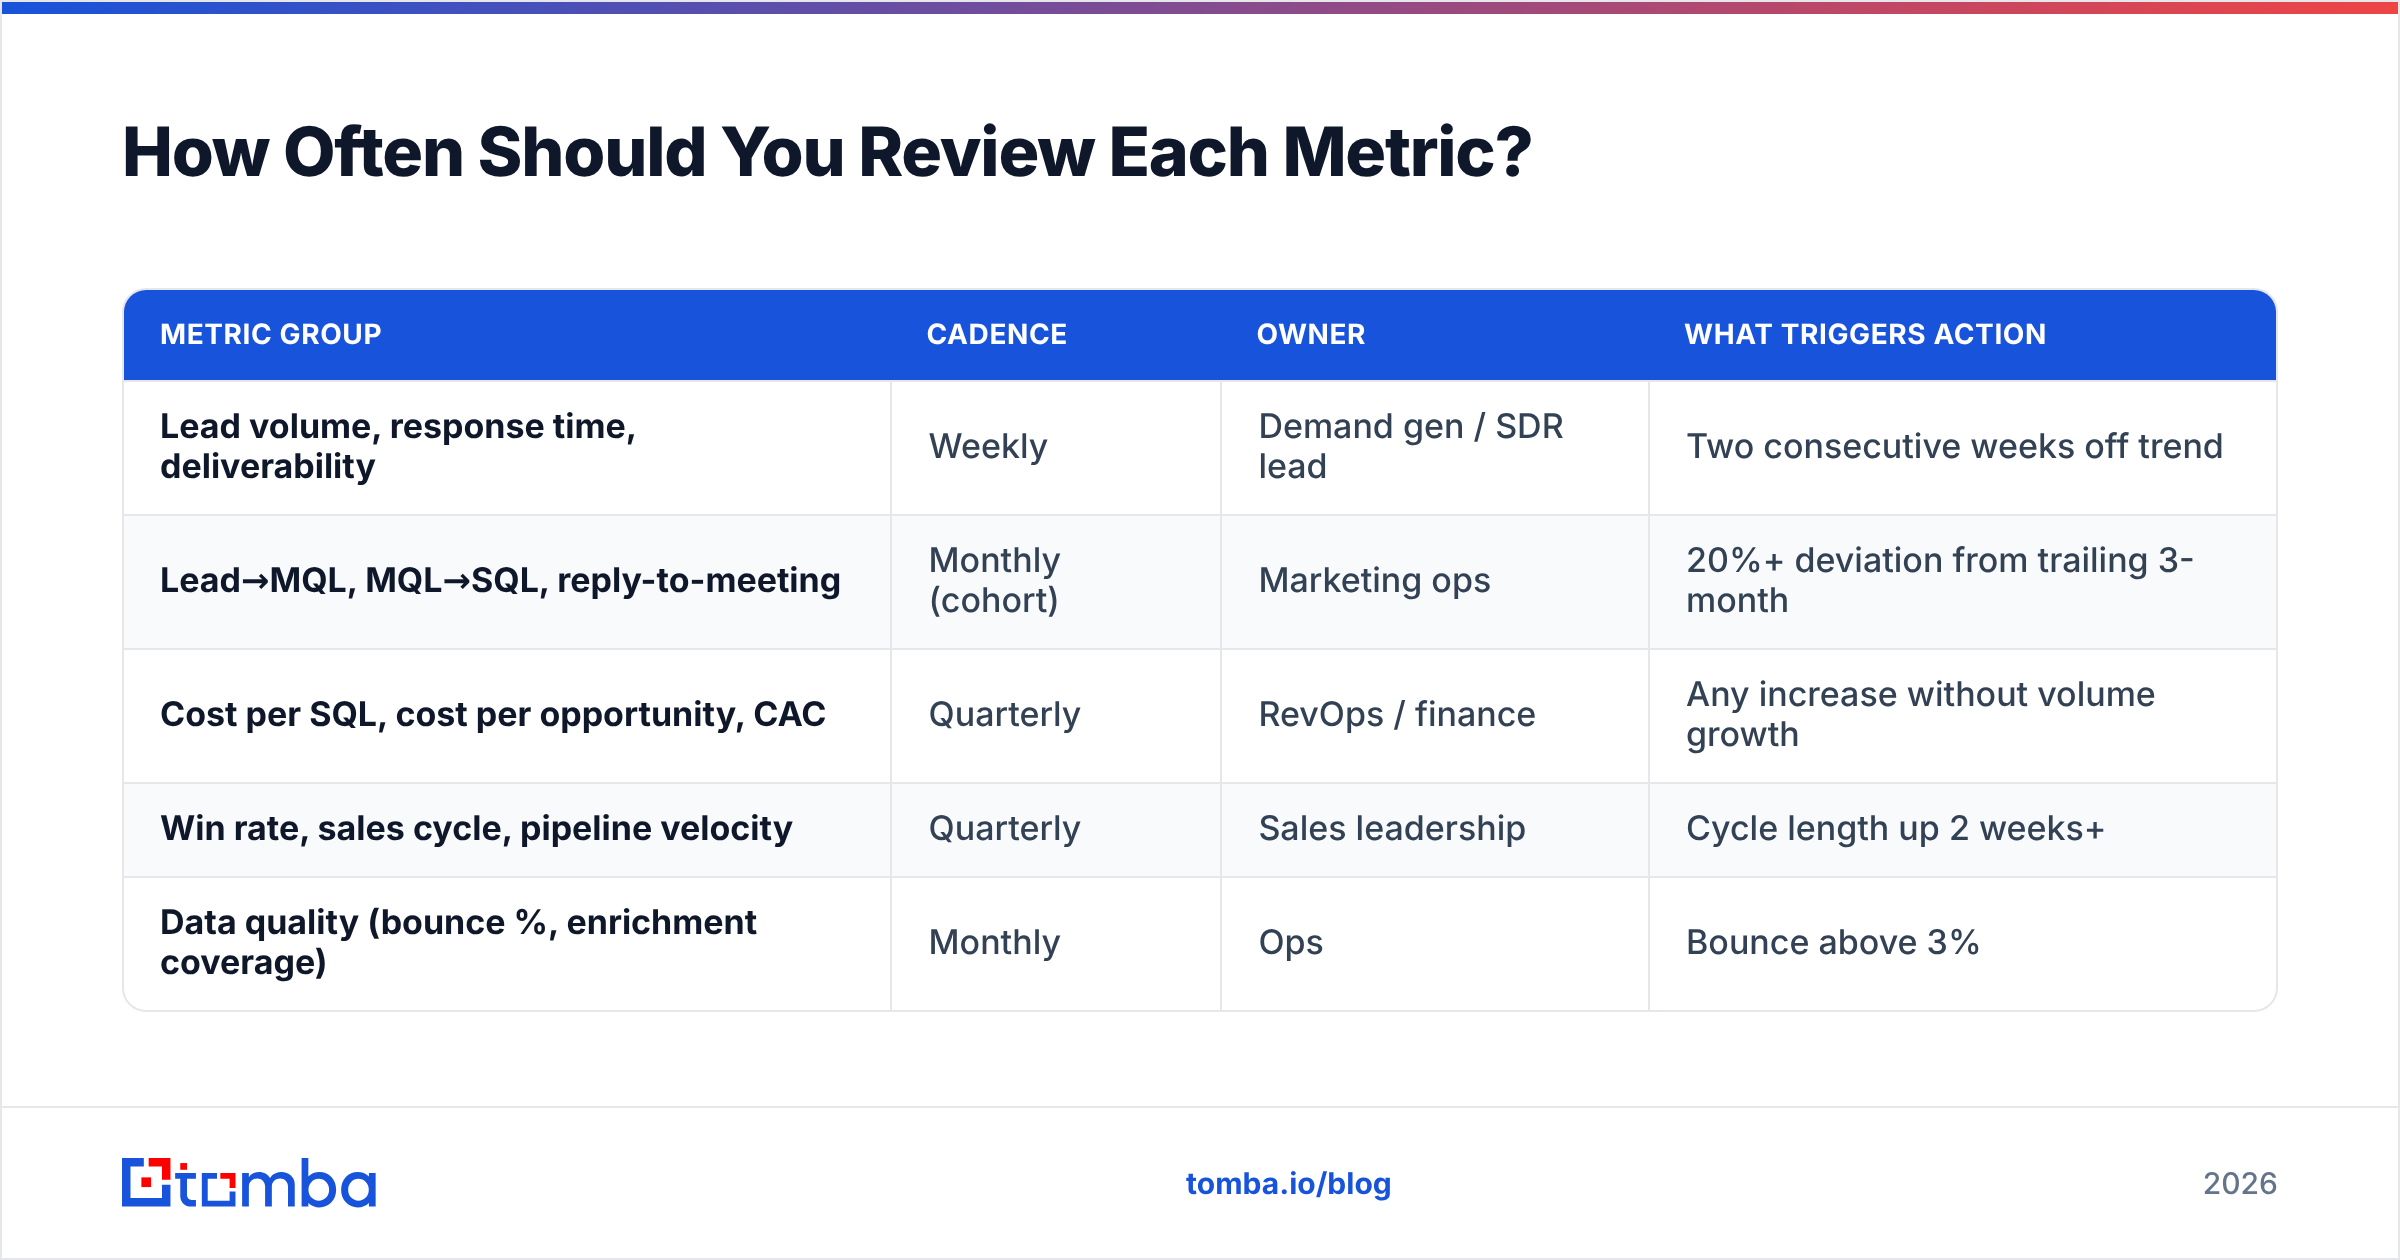
Reviewing everything weekly is how dashboards die. Match cadence to how fast the metric can actually move.
| Metric group | Cadence | Owner | What triggers action |
|---|---|---|---|
| Lead volume, response time, deliverability | Weekly | Demand gen / SDR lead | Two consecutive weeks off trend |
| Lead→MQL, MQL→SQL, reply-to-meeting | Monthly (cohort) | Marketing ops | 20%+ deviation from trailing 3-month |
| Cost per SQL, cost per opportunity, CAC | Quarterly | RevOps / finance | Any increase without volume growth |
| Win rate, sales cycle, pipeline velocity | Quarterly | Sales leadership | Cycle length up 2 weeks+ |
| Data quality (bounce %, enrichment coverage) | Monthly | Ops | Bounce above 3% |
One rule that saves a lot of arguing: freeze your definitions at the start of the quarter and write them down where everyone can see them. What counts as an MQL, when an SQL is created, what "qualified opportunity" requires. If you want a shared starting point, the standard definition of a marketing qualified lead is a reasonable baseline to argue against.
What Does a Working Lead Gen Scorecard Look Like?#
Concrete example. Mid-market SaaS, $18k ACV, outbound-led, one quarter:
- 3,200 contacts sourced and verified → 2,960 deliverable (92.5% after verification, up from 81% before)
- 2,960 contacts → 178 positive replies (6.0%)
- 178 positive replies → 52 meetings held (29% — inside range)
- 52 meetings → 31 SQLs (60%)
- 31 SQLs → 24 opportunities (77%)
- 24 opportunities → 5 closed won (21% win rate)
- Total program cost: $41,000 → cost per opportunity $1,708, CAC $8,200
Now the diagnostic question: where is the leak? Not the win rate — 21% at that ACV is fine. Not deliverability. The weak link is reply-to-meeting at 29%, which is at the bottom of the healthy band, meaning positive replies are not converting to calendar time. That is a follow-up-speed and booking-friction problem, not a list problem or a messaging problem.
That is what good metrics do. They do not tell you that things are bad. They tell you which of six possible things is bad, so you stop running discovery on your own funnel every quarter.
A quick sanity check before you rebuild anything: pull last quarter's numbers into this structure. If you cannot populate five of the twelve metrics without a three-day data project, your instrumentation problem is bigger than your lead gen problem, and that is where the next sprint should go.
Where Should You Start If Your Dashboard Is a Mess?#
In order:
- Fix the denominator first. Deduplicate and verify the list. Every ratio you compute before this is wrong by an unknown amount.
- Pick four metrics for the front page. New qualified opportunities, cost per opportunity, MQL→SQL rate, sales cycle length. Everything else goes one click deeper.
- Switch to cohort reporting. Period-over-period ratios mislead anyone with a sales cycle.
- Write the definitions down. One page, shared, dated.
- Review at the cadence in the table above — not more often.
Most teams find that steps 1 and 2 alone change the conversation within a month, because the cost-per-opportunity number is usually 3–5x higher than anyone on the team had assumed.
Start with the data layer. Every metric in this article is downstream of one thing: whether the contacts in your CRM are real, current, and reachable. Tomba's Email Finder finds verified professional email addresses by domain, name, or company, with verification built into the same call — so your list is clean before it becomes a conversion rate. The free tier covers 25 searches a month; paid plans start at $49/mo, and you can compare the tiers on the Tomba pricing page. Fix the denominator, then argue about the dashboard.
Related guides#
Ready to find emails that actually work?
Join 150,000+ professionals who stopped guessing and started sending. Free credits on signup — no credit card required.
Get the Tomba newsletter
Practical outbound tactics and product updates — once every two weeks.
About the author