Lead Generation ROI: How to Measure It and Fix It in 2026
Most teams report lead volume and call it performance. Here is the actual lead generation ROI formula, realistic 2026 benchmarks by channel, and the four cost levers that move the number.
TL;DR
- Lead generation ROI is
(revenue from leads − cost of generating them) / cost of generating them, measured on closed revenue, not MQLs. - Most reported ROI numbers are inflated because they count pipeline instead of bookings, ignore SDR payroll, and use a first-touch attribution model that flatters paid channels.
- Realistic 2026 B2B benchmarks: outbound email sits around 200–500% ROI when data is clean, paid search around 100–250%, SEO/content 300–700% but on a 9–14 month lag.
- Data cost is rarely the problem. A $0.04 verified contact and a $12 "enriched" record produce wildly different ROI because of bounce rates, rep time, and domain reputation — not the line-item price.
- The four levers that actually move lead generation ROI: contact accuracy, ICP tightness, speed-to-lead, and cost-per-hour of the humans touching each lead.
What is lead generation ROI, actually?#
Lead generation ROI is the ratio of revenue produced by leads to the total cost of producing those leads. That is the whole definition. The trouble starts with what you put in each half of the fraction.
Think of it like a fishing boat. Fuel, crew wages, bait, and boat depreciation are your costs. Your return is the fish you actually sold at the dock — not the fish you saw in the water, not the fish that got off the hook, and definitely not the fish you estimated were "in the area." Almost every lead gen dashboard reports fish sightings.
The formal version:
Lead Generation ROI = (Closed Revenue Attributed to Leads − Total Lead Gen Cost) / Total Lead Gen Cost × 100Two things break this in practice. First, "closed revenue attributed to leads" requires an attribution model, and every model is a set of assumptions dressed as arithmetic. Second, "total lead gen cost" is almost always understated because teams count tool subscriptions and ad spend but not the salaried humans who prospect, qualify, and follow up — which is usually 60–75% of the real cost.
How do you calculate lead generation ROI correctly?#
Build both sides of the fraction line by line. Here is the minimum viable cost stack most B2B teams should be summing:
- Media and list costs — ad spend, sponsorships, content syndication, purchased or licensed contact data.
- Tooling — your email finder, verification, sequencer, CRM seats, enrichment, and intent data, allocated per month.
- People cost — fully loaded SDR/BDR salary plus benefits and commission, allocated by the percentage of their time spent on lead generation rather than handoffs and admin.
- Creative and content production — writers, designers, video, and the agency retainer if you have one.
- Waste overhead — the invisible one. Bounced sends, bad-fit meetings that waste an AE hour, and the reputational damage that lowers next quarter's deliverability.
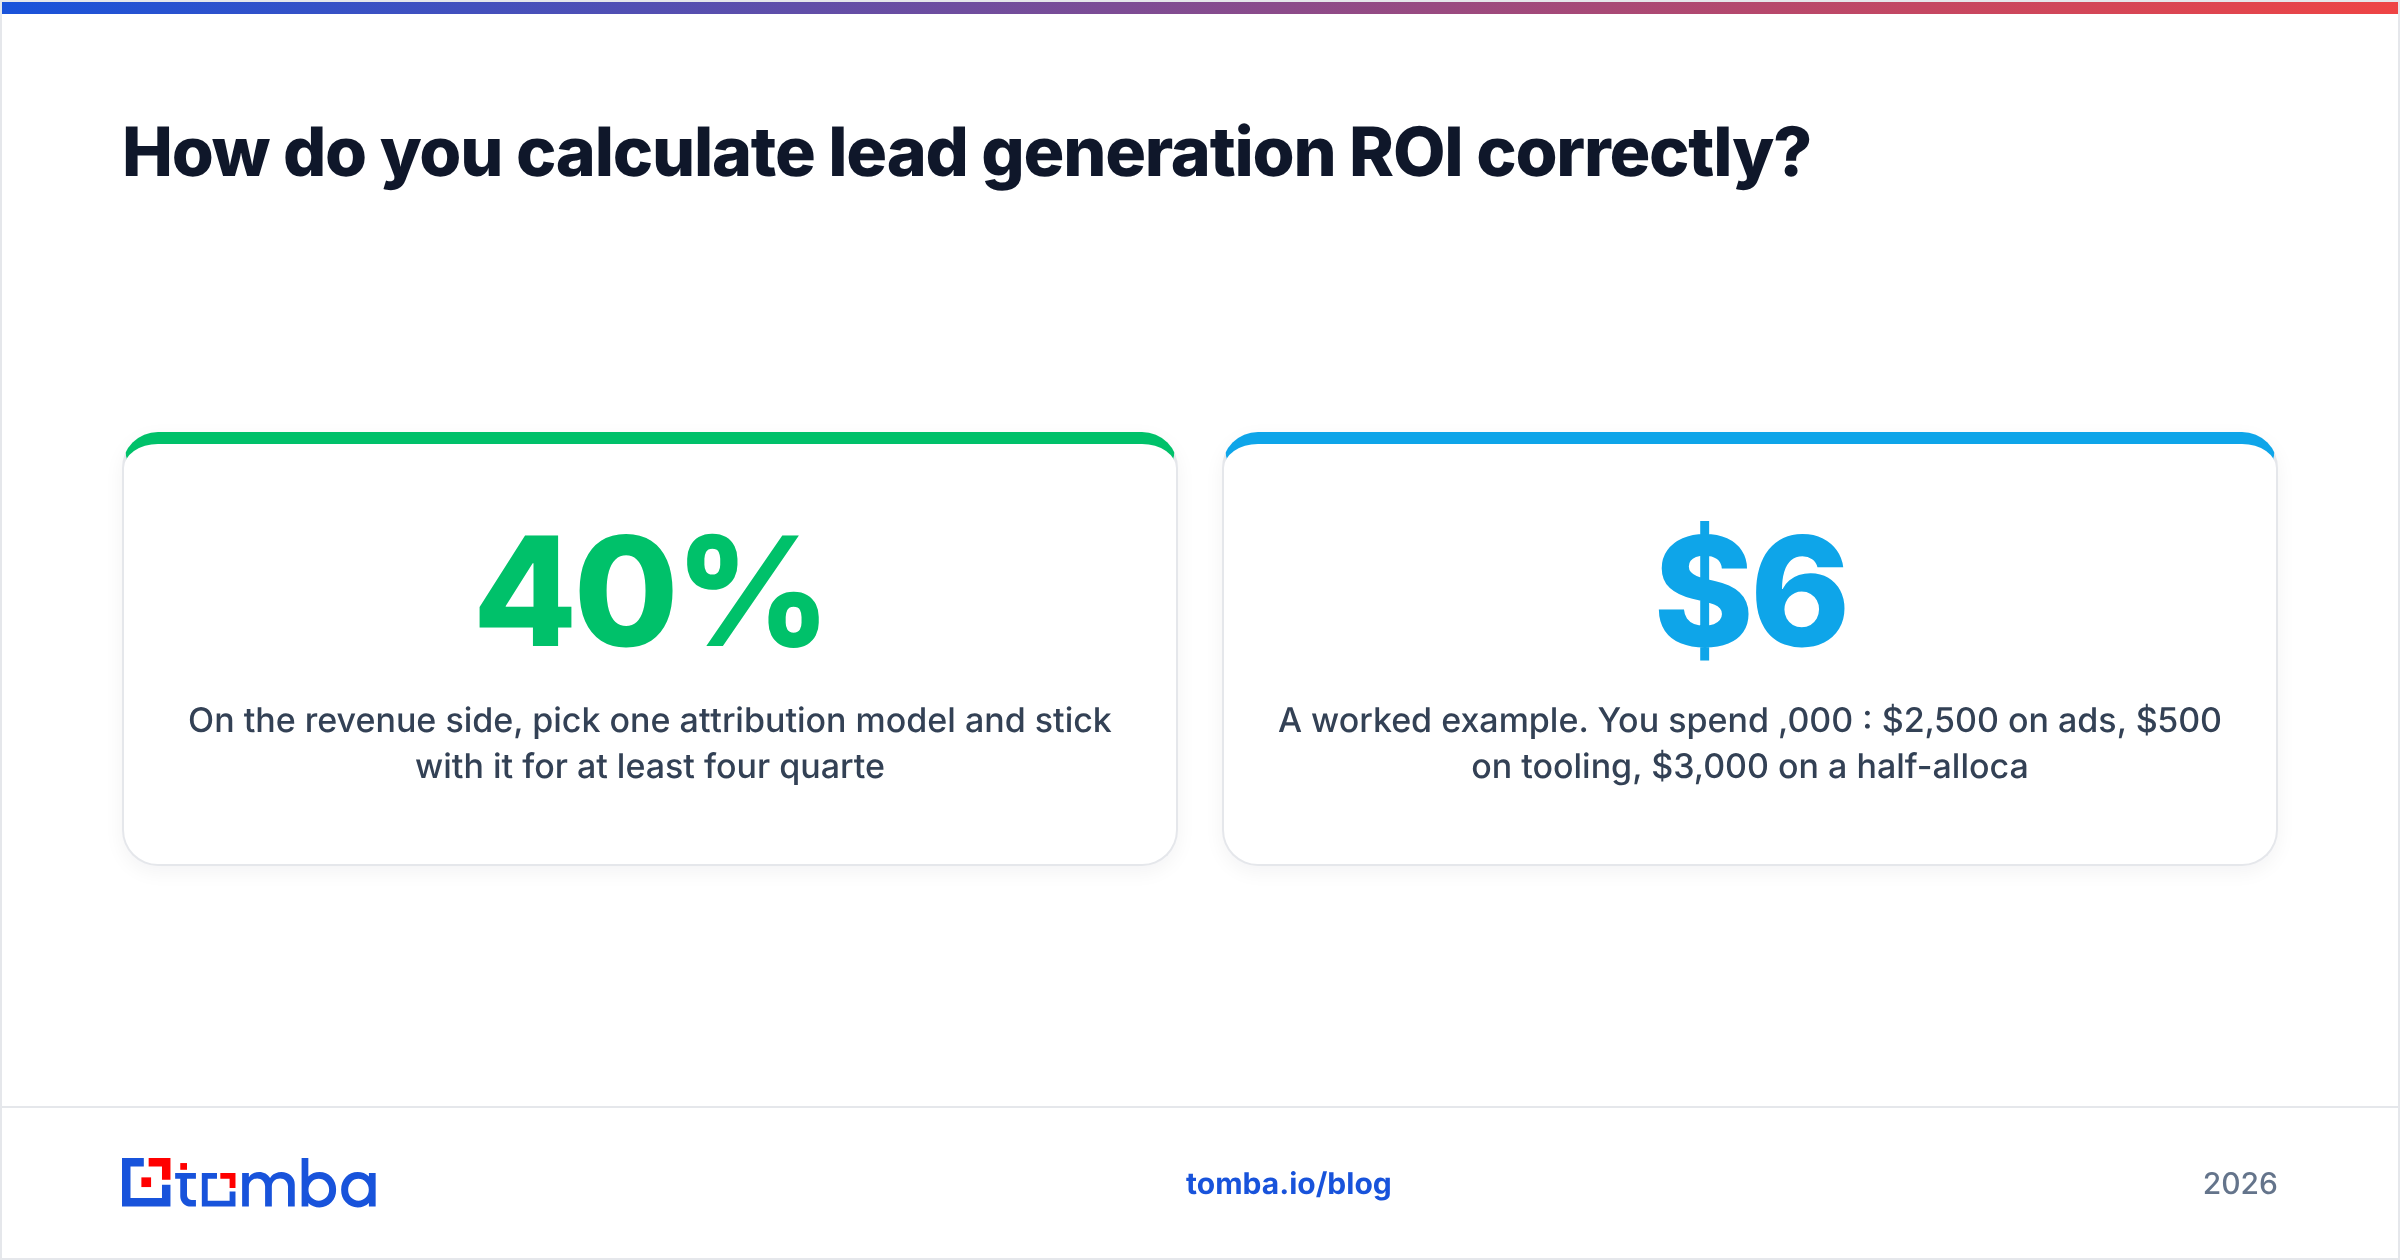
On the revenue side, pick one attribution model and stick with it for at least four quarters. Switching from first-touch to W-shaped mid-year will make your ROI "improve" by 40% while nothing real changed. If you are sizing the denominator honestly, most teams find their true cost per meeting is 2–3x what the dashboard says.
A worked example. You spend $6,000/month: $2,500 on ads, $500 on tooling, $3,000 on a half-allocated SDR. You generate 220 leads, 34 become sales-accepted, 6 become opportunities, and 1.8 close at an average of $9,400 ACV. Monthly revenue: $16,920. ROI: (16,920 − 6,000) / 6,000 = 182%. That is a healthy number — and it is roughly one-third of what the same team would report if they counted pipeline instead of bookings.

What is a good lead generation ROI in 2026?#
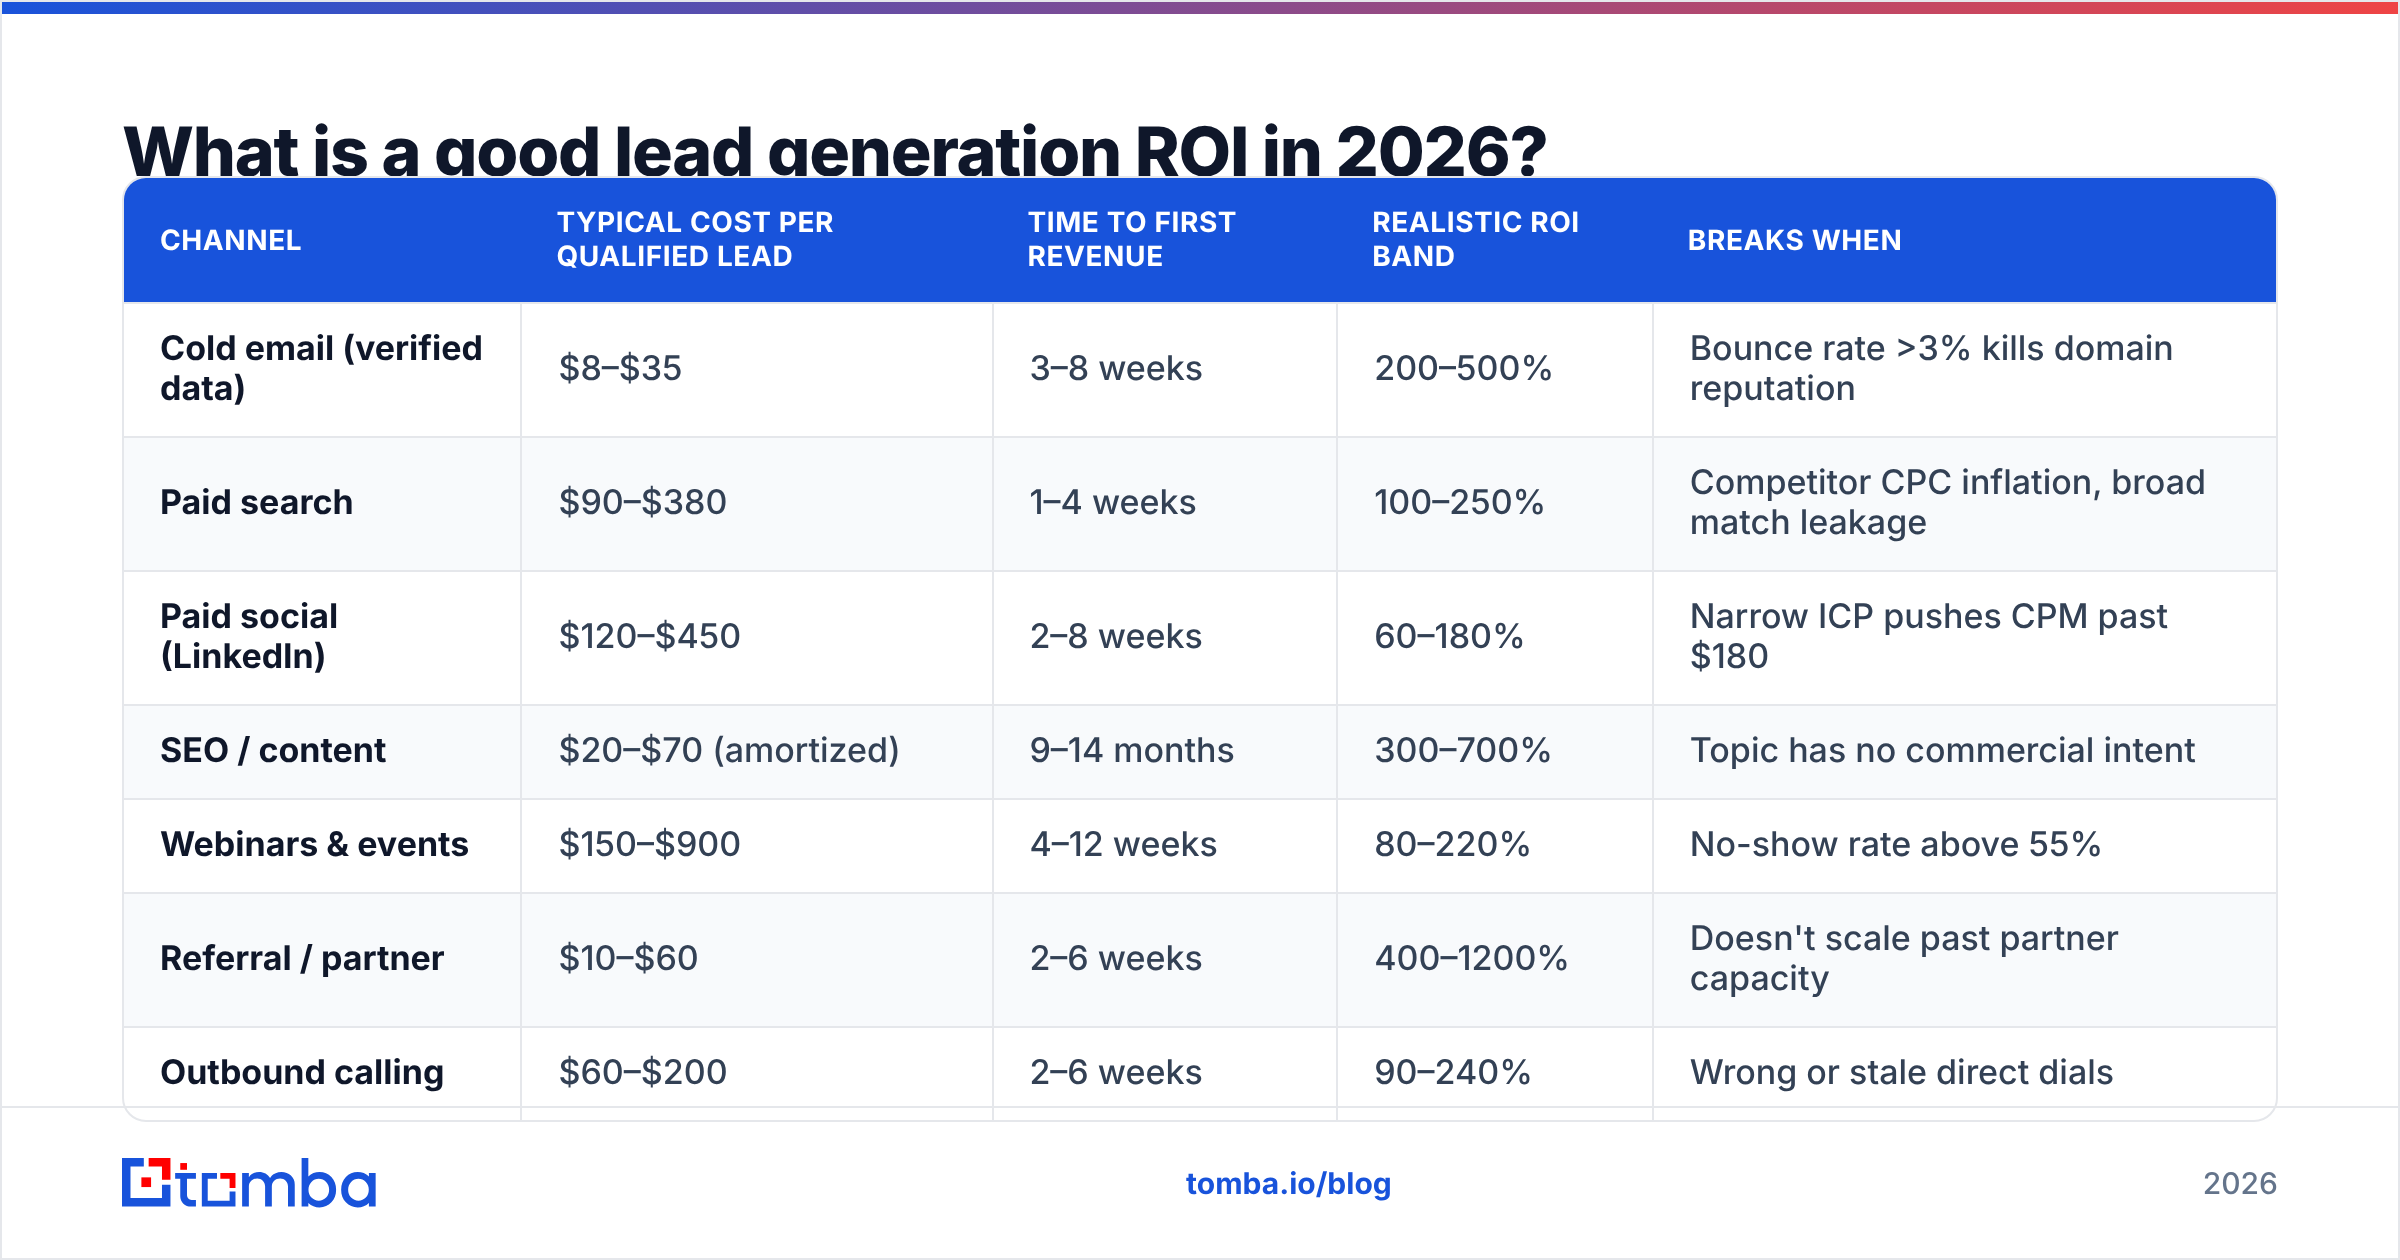
There is no universal "good." A 150% ROI on a $200k ACV enterprise motion is excellent; the same number on a $49/month self-serve product is a slow bleed. Benchmark against your own payback period instead, and use the channel table below as a sanity check rather than a target.
| Channel | Typical cost per qualified lead | Time to first revenue | Realistic ROI band | Breaks when |
|---|---|---|---|---|
| Cold email (verified data) | $8–$35 | 3–8 weeks | 200–500% | Bounce rate >3% kills domain reputation |
| Paid search | $90–$380 | 1–4 weeks | 100–250% | Competitor CPC inflation, broad match leakage |
| Paid social (LinkedIn) | $120–$450 | 2–8 weeks | 60–180% | Narrow ICP pushes CPM past $180 |
| SEO / content | $20–$70 (amortized) | 9–14 months | 300–700% | Topic has no commercial intent |
| Webinars & events | $150–$900 | 4–12 weeks | 80–220% | No-show rate above 55% |
| Referral / partner | $10–$60 | 2–6 weeks | 400–1200% | Doesn't scale past partner capacity |
| Outbound calling | $60–$200 | 2–6 weeks | 90–240% | Wrong or stale direct dials |
Two patterns show up consistently. Channels with the highest ROI (referral, SEO) are the hardest to scale on demand. Channels you can turn on tomorrow (paid, outbound) have the tightest ROI bands and are the most sensitive to input quality. That is why teams chasing a quarterly number end up optimizing the channels where optimization matters most — and why cost-per-lead obsession quietly destroys returns.
Why do most lead generation ROI numbers lie?#
Four failure modes account for nearly all of it.
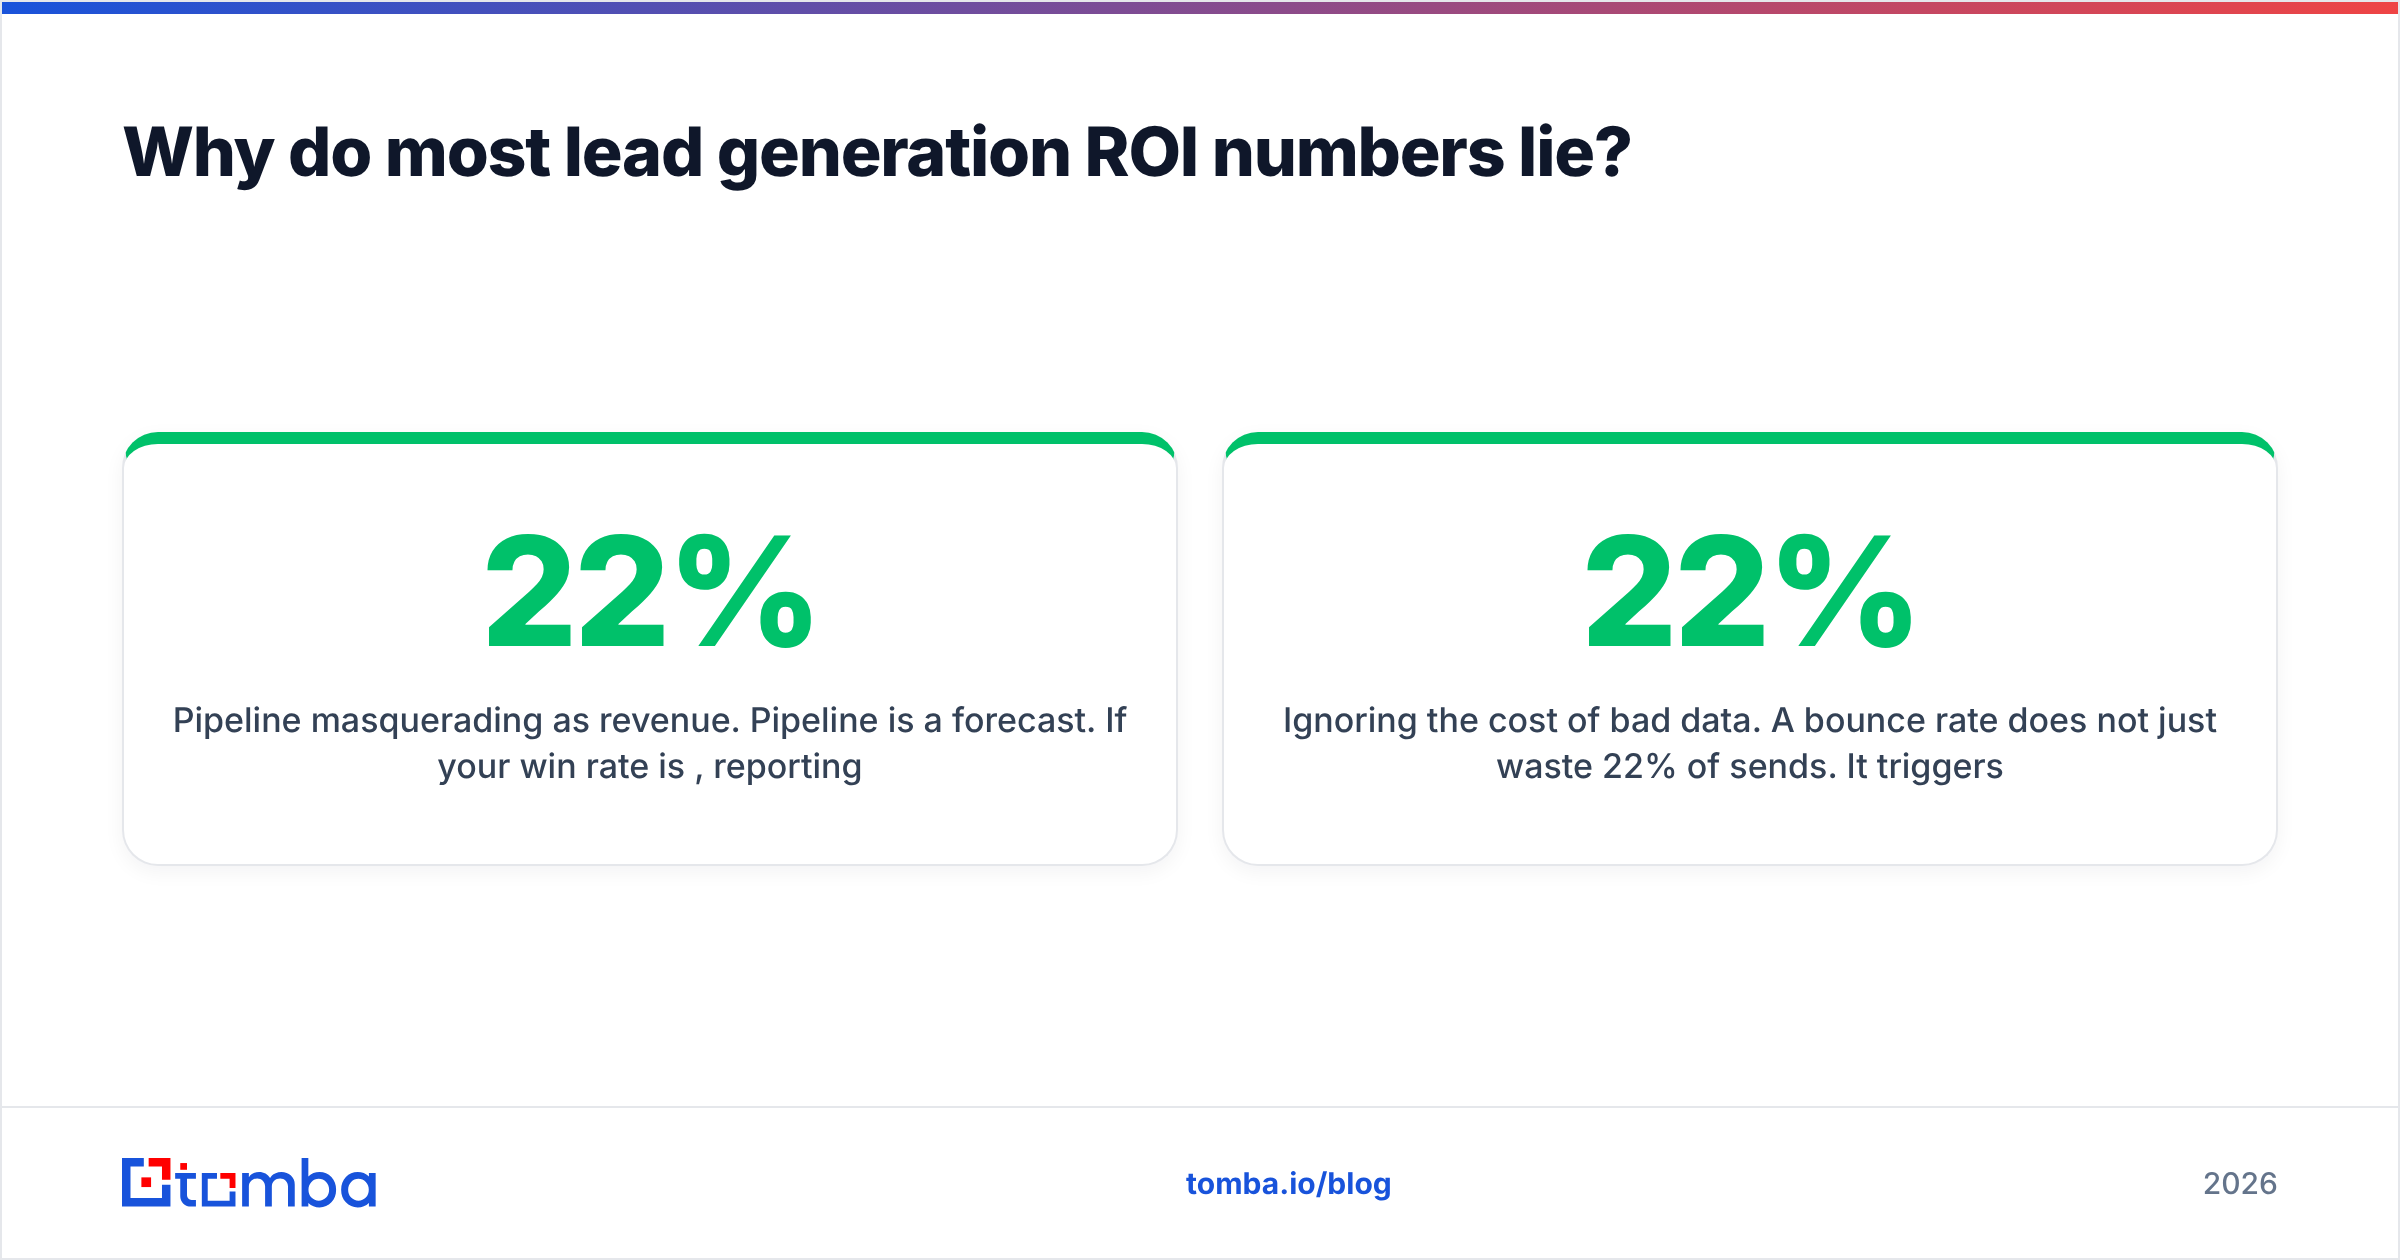
Pipeline masquerading as revenue. Pipeline is a forecast. If your win rate is 22%, reporting $1M in generated pipeline as if it were return overstates ROI by roughly 4.5x. Use closed-won only, with a second view on pipeline clearly labeled as such. HubSpot's marketing research has shown for years that the gap between "leads generated" and "revenue influenced" is where most reporting credibility dies.
Ignoring the cost of bad data. A 22% bounce rate does not just waste 22% of sends. It triggers spam filtering that suppresses the other 78%, and it burns SDR hours on contacts that were never reachable. The line-item savings on cheap data are always smaller than the compounding cost of using it. This is why email verification belongs in the ROI conversation rather than the ops budget.
Counting MQLs as an outcome. An MQL is an internal status flag, not money. If marketing is scored on MQL volume and sales is scored on bookings, the two teams will report contradictory ROI from the same funnel — forever. Gartner's ongoing coverage of demand generation measurement has pushed most mature orgs toward shared pipeline-and-revenue targets for exactly this reason.
Measuring windows that don't match sales cycles. If your average cycle is 74 days and you report ROI monthly, your numerator and denominator are describing different cohorts. Always cohort by lead creation date, not close date.

How much does data quality change the ROI math?#
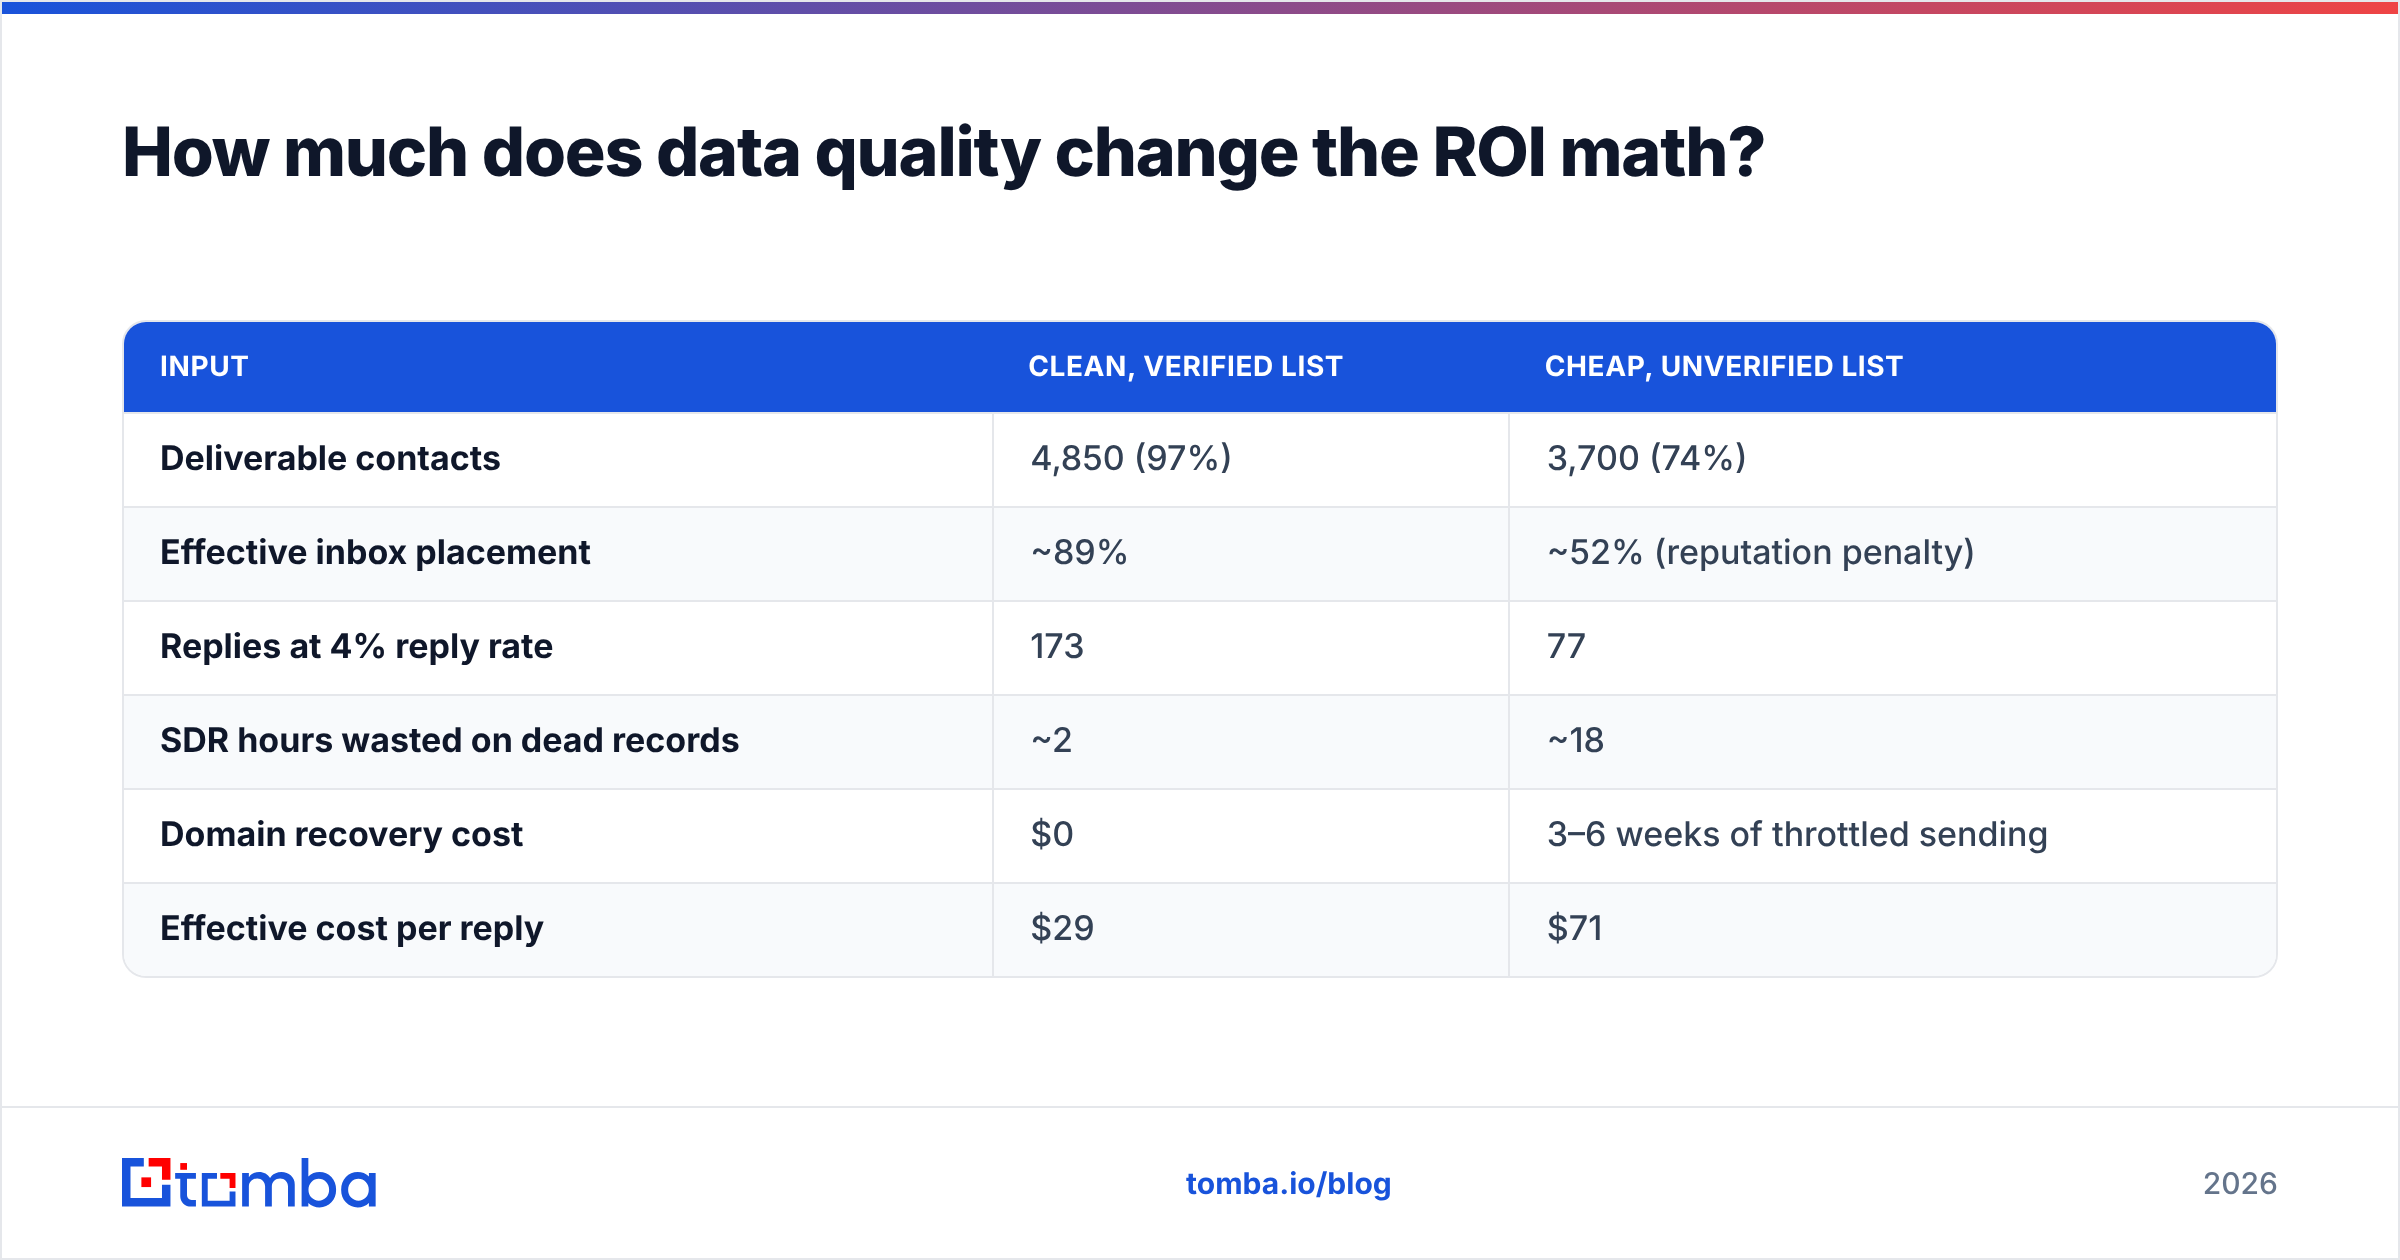
More than any other single variable, because it multiplies rather than adds. Run the same 5,000-contact campaign through two data qualities and the difference is not a percentage point — it is the difference between a channel you scale and a channel you kill.
| Input | Clean, verified list | Cheap, unverified list |
|---|---|---|
| Deliverable contacts | 4,850 (97%) | 3,700 (74%) |
| Effective inbox placement | ~89% | ~52% (reputation penalty) |
| Replies at 4% reply rate | 173 | 77 |
| SDR hours wasted on dead records | ~2 | ~18 |
| Domain recovery cost | $0 | 3–6 weeks of throttled sending |
| Effective cost per reply | $29 | $71 |
The unverified list may have cost a third as much per record, and it still produced a cost per reply 2.4x higher. That is the entire argument for spending more on inputs, and it is why where your data comes from matters more than the sticker price on the plan. If you are running large campaigns, a bulk email finder workflow with verification built into the same pass eliminates the two-step lag where records go stale between sourcing and sending.
Worth noting: vendor category pages like G2's lead intelligence listings are useful for shortlisting, but almost no vendor publishes bounce rates measured on your ICP. The only honest benchmark is a 500-contact test on your own target segment.
What are the four levers that actually improve lead generation ROI?#
Ranked by impact per unit of effort, for most B2B teams under $50M ARR.
- Tighten the ICP before you increase volume. Cutting your addressable list by 60% and raising fit quality typically improves ROI more than doubling spend. Fewer, better-fit leads raise win rate, shorten cycles, and shrink the denominator at the same time. It is the only lever that improves both halves of the fraction simultaneously.
- Fix contact accuracy at the source. Verify before sending, not after bouncing. Catch-all domains deserve special handling — a good catch-all verifier distinguishes "unknown but likely valid" from "accept-all garbage," which is the difference between a usable segment and a reputation risk.
- Compress speed-to-lead. Response within five minutes versus an hour still produces a multiple-fold difference in qualification rates, and the cost of the improvement is a routing rule, not a budget line. This is the cheapest ROI gain available to almost every team reading this.
- Reprice the human hour. If an SDR spends 40% of their week on manual list building, you are paying senior-salary rates for junior-data work. Moving sourcing into an automated pass — via the Tomba API or a spreadsheet-native workflow — converts that time into conversations without adding headcount.
A fifth, slower lever: build a repeatable content asset in a commercial-intent topic. The ROI band is the widest of any channel, but you have to survive the 9–14 month ramp, which is why it belongs in annual planning rather than quarterly firefighting.
How should you report lead generation ROI to leadership?#
Report three numbers, not one. A single ROI percentage invites arguments about attribution and wins none of them.
- Blended CAC payback in months. Board-legible, attribution-agnostic, hard to game.
- Cost per closed-won by channel, cohorted by lead creation month. This is where you find the channel that looks cheap and closes nothing.
- Marginal ROI at the last $10k of spend. Average ROI tells you whether a channel works. Marginal ROI tells you whether to add budget — and they frequently point in opposite directions. Salesforce's State of Sales research consistently shows teams over-invest in channels with strong average returns that have already saturated at the margin.
Add one qualitative line: what changed in the inputs this quarter. If bounce rate fell from 14% to 2%, that context explains more of your ROI swing than any campaign creative did.
Where should you start if your ROI is currently unknown?#
Pick one channel. Rebuild the cost stack honestly, including people. Cohort 90 days of leads by creation date. Compute closed-won revenue against that cohort. You will likely find the real number is half of what was being reported, and that the single largest recoverable cost is wasted effort against contacts that were never valid.
Fix the inputs first, because every downstream optimization multiplies against them. Verified contacts make sequencing math work, protect email deliverability, and stop your reps from spending Tuesday morning on records that bounce Tuesday afternoon.
If that is your bottleneck, start with the Tomba Email Finder. The free tier gives you 25 searches a month to test accuracy against your own ICP before spending anything, Starter runs $49/month, and Growth at $99/month covers most teams running consistent outbound. Run a 500-contact accuracy test on your real target segment, measure the bounce rate, and put the result directly into your ROI model — that one number will tell you more about your lead generation ROI than another quarter of dashboard-watching.
Related guides#
// get started
Find, verify and enrich your first contacts today
Start on the free plan with 25 searches a month, then scale when your team is ready.
Free plan · No credit card required · GDPR & CCPA
// about the author