Lead Nurturing KPIs: 12 Metrics to Track in 2026 (With Benchmarks)
Open rates say very little about whether nurturing works. These 12 lead nurturing KPIs track leads from first touch to closed revenue, with ranges that help you tell a healthy program from a leaky one.
TL;DR
- The lead nurturing KPIs that matter fall into four layers: data health, engagement, progression, and revenue. If you only track the first two, you're measuring activity, not results.
- Open rate is no longer a reliable KPI. Apple Mail Privacy Protection and bot clicks inflate it, so use reply rate, click rate, and stage conversion instead.
- Your two most important metrics are nurture-to-opportunity conversion and nurture-influenced pipeline. They show whether nurturing produces revenue or just sends emails.
- Bad contact data quietly breaks every downstream metric. A bounce rate above 2% means your conversion numbers are measured against the wrong denominator.
- Compare nurtured cohorts against a non-nurtured control group. Without that comparison, you can't show that your program caused any lift.
What are lead nurturing KPIs?#
Lead nurturing KPIs measure whether your ongoing, non-sales-ready communication with prospects moves them closer to buying. The prospects get emails, content, retargeting, and occasional SDR touches. The KPIs tell you if any of it works.
The key word is moves. A nurture program exists to take a lead who isn't ready today and bring them back when they are, with more context and more trust. So the useful KPIs track movement between stages, not how many times someone saw your logo.
Most teams get this backwards. Their nurture dashboard shows sends, opens, and clicks because the marketing automation platform reports those by default. Then the CFO asks what the program contributed to pipeline last quarter, and nobody has an answer.
A useful way to see it: think of nurturing as a relay race. Engagement metrics tell you the runners are moving. Progression and revenue metrics tell you whether the baton reached the finish line.
Which lead nurturing KPIs should you actually track?#
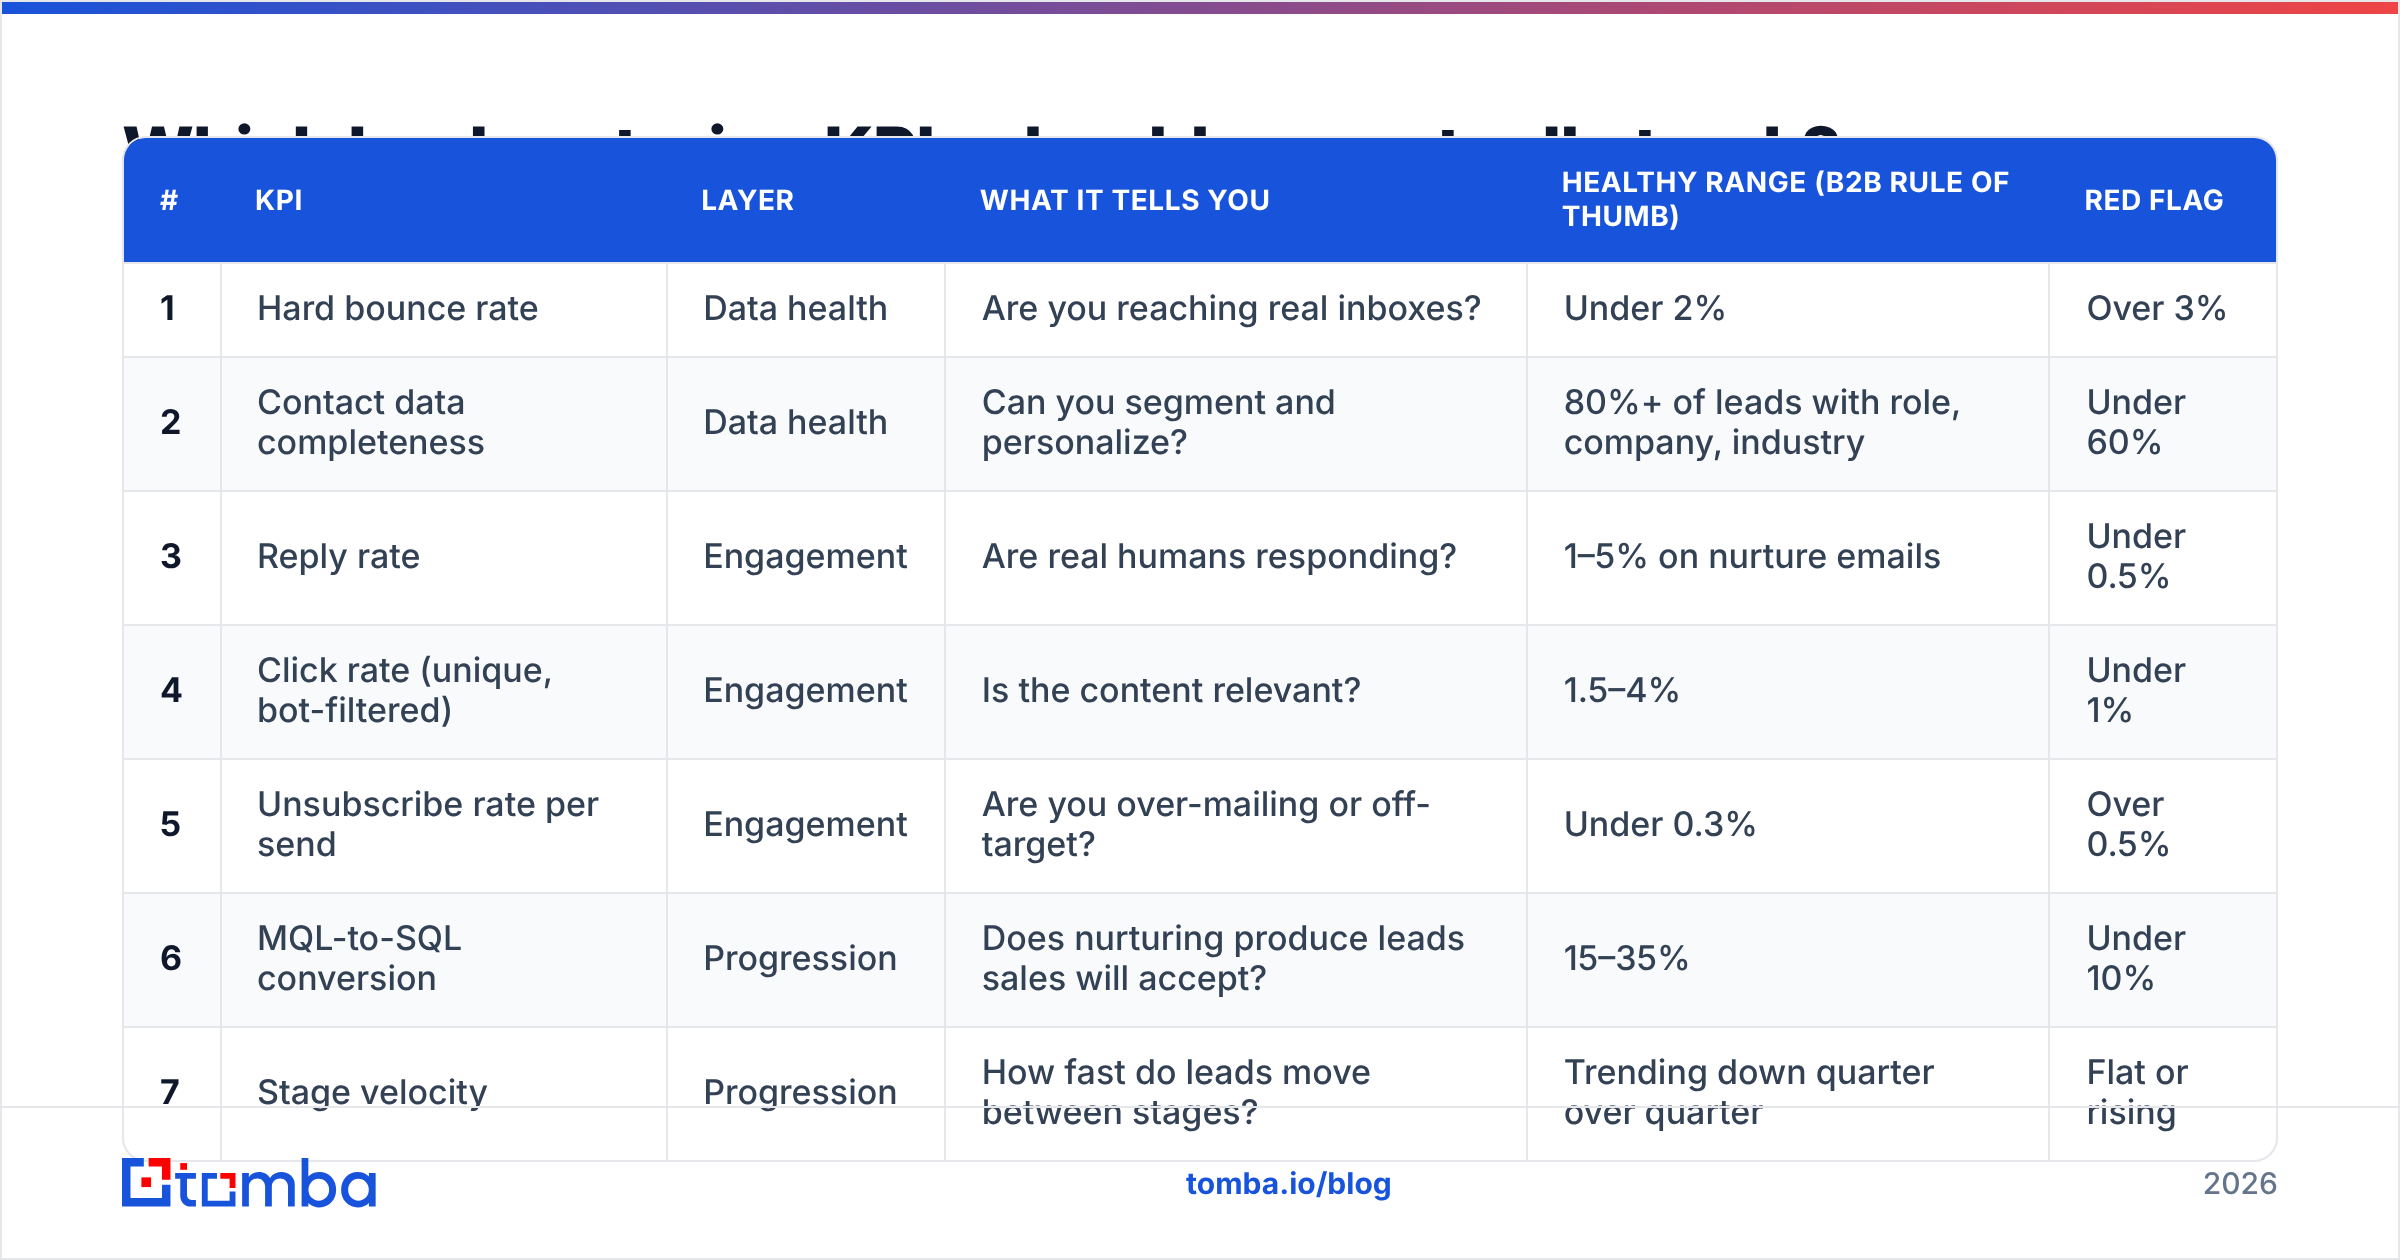
Track 12 metrics in four layers. Each layer depends on the one before it. If data health is bad, engagement numbers mean little. If engagement is fake, progression numbers are noise.
| # | KPI | Layer | What it tells you | Healthy range (B2B rule of thumb) | Red flag |
|---|---|---|---|---|---|
| 1 | Hard bounce rate | Data health | Are you reaching real inboxes? | Under 2% | Over 3% |
| 2 | Contact data completeness | Data health | Can you segment and personalize? | 80%+ of leads with role, company, industry | Under 60% |
| 3 | Reply rate | Engagement | Are real humans responding? | 1–5% on nurture emails | Under 0.5% |
| 4 | Click rate (unique, bot-filtered) | Engagement | Is the content relevant? | 1.5–4% | Under 1% |
| 5 | Unsubscribe rate per send | Engagement | Are you over-mailing or off-target? | Under 0.3% | Over 0.5% |
| 6 | MQL-to-SQL conversion | Progression | Does nurturing produce leads sales will accept? | 15–35% | Under 10% |
| 7 | Stage velocity | Progression | How fast do leads move between stages? | Trending down quarter over quarter | Flat or rising |
| 8 | Nurture-to-opportunity rate | Progression | How many nurtured leads become opps? | 3–10% of enrolled leads | Under 2% |
| 9 | Nurture-influenced pipeline | Revenue | Dollar value of opps that touched nurture | Growing share of total pipeline | Unknown / not tracked |
| 10 | Win rate: nurtured vs. non-nurtured | Revenue | Does nurturing improve close rates? | Nurtured cohort beats control | No difference |
| 11 | Sales cycle length (nurtured cohort) | Revenue | Does nurturing shorten deals? | Shorter than control | Longer than control |
| 12 | Cost per nurtured opportunity | Revenue | Is the program efficient? | Below paid-channel cost per opp | Above it |
Treat these ranges as starting points, not industry law. They vary widely by deal size, ICP, and channel mix. The most reliable benchmark is your own trailing four quarters.
Why does data health come first?#
Every nurture KPI is a ratio, and bad data corrupts the denominator.
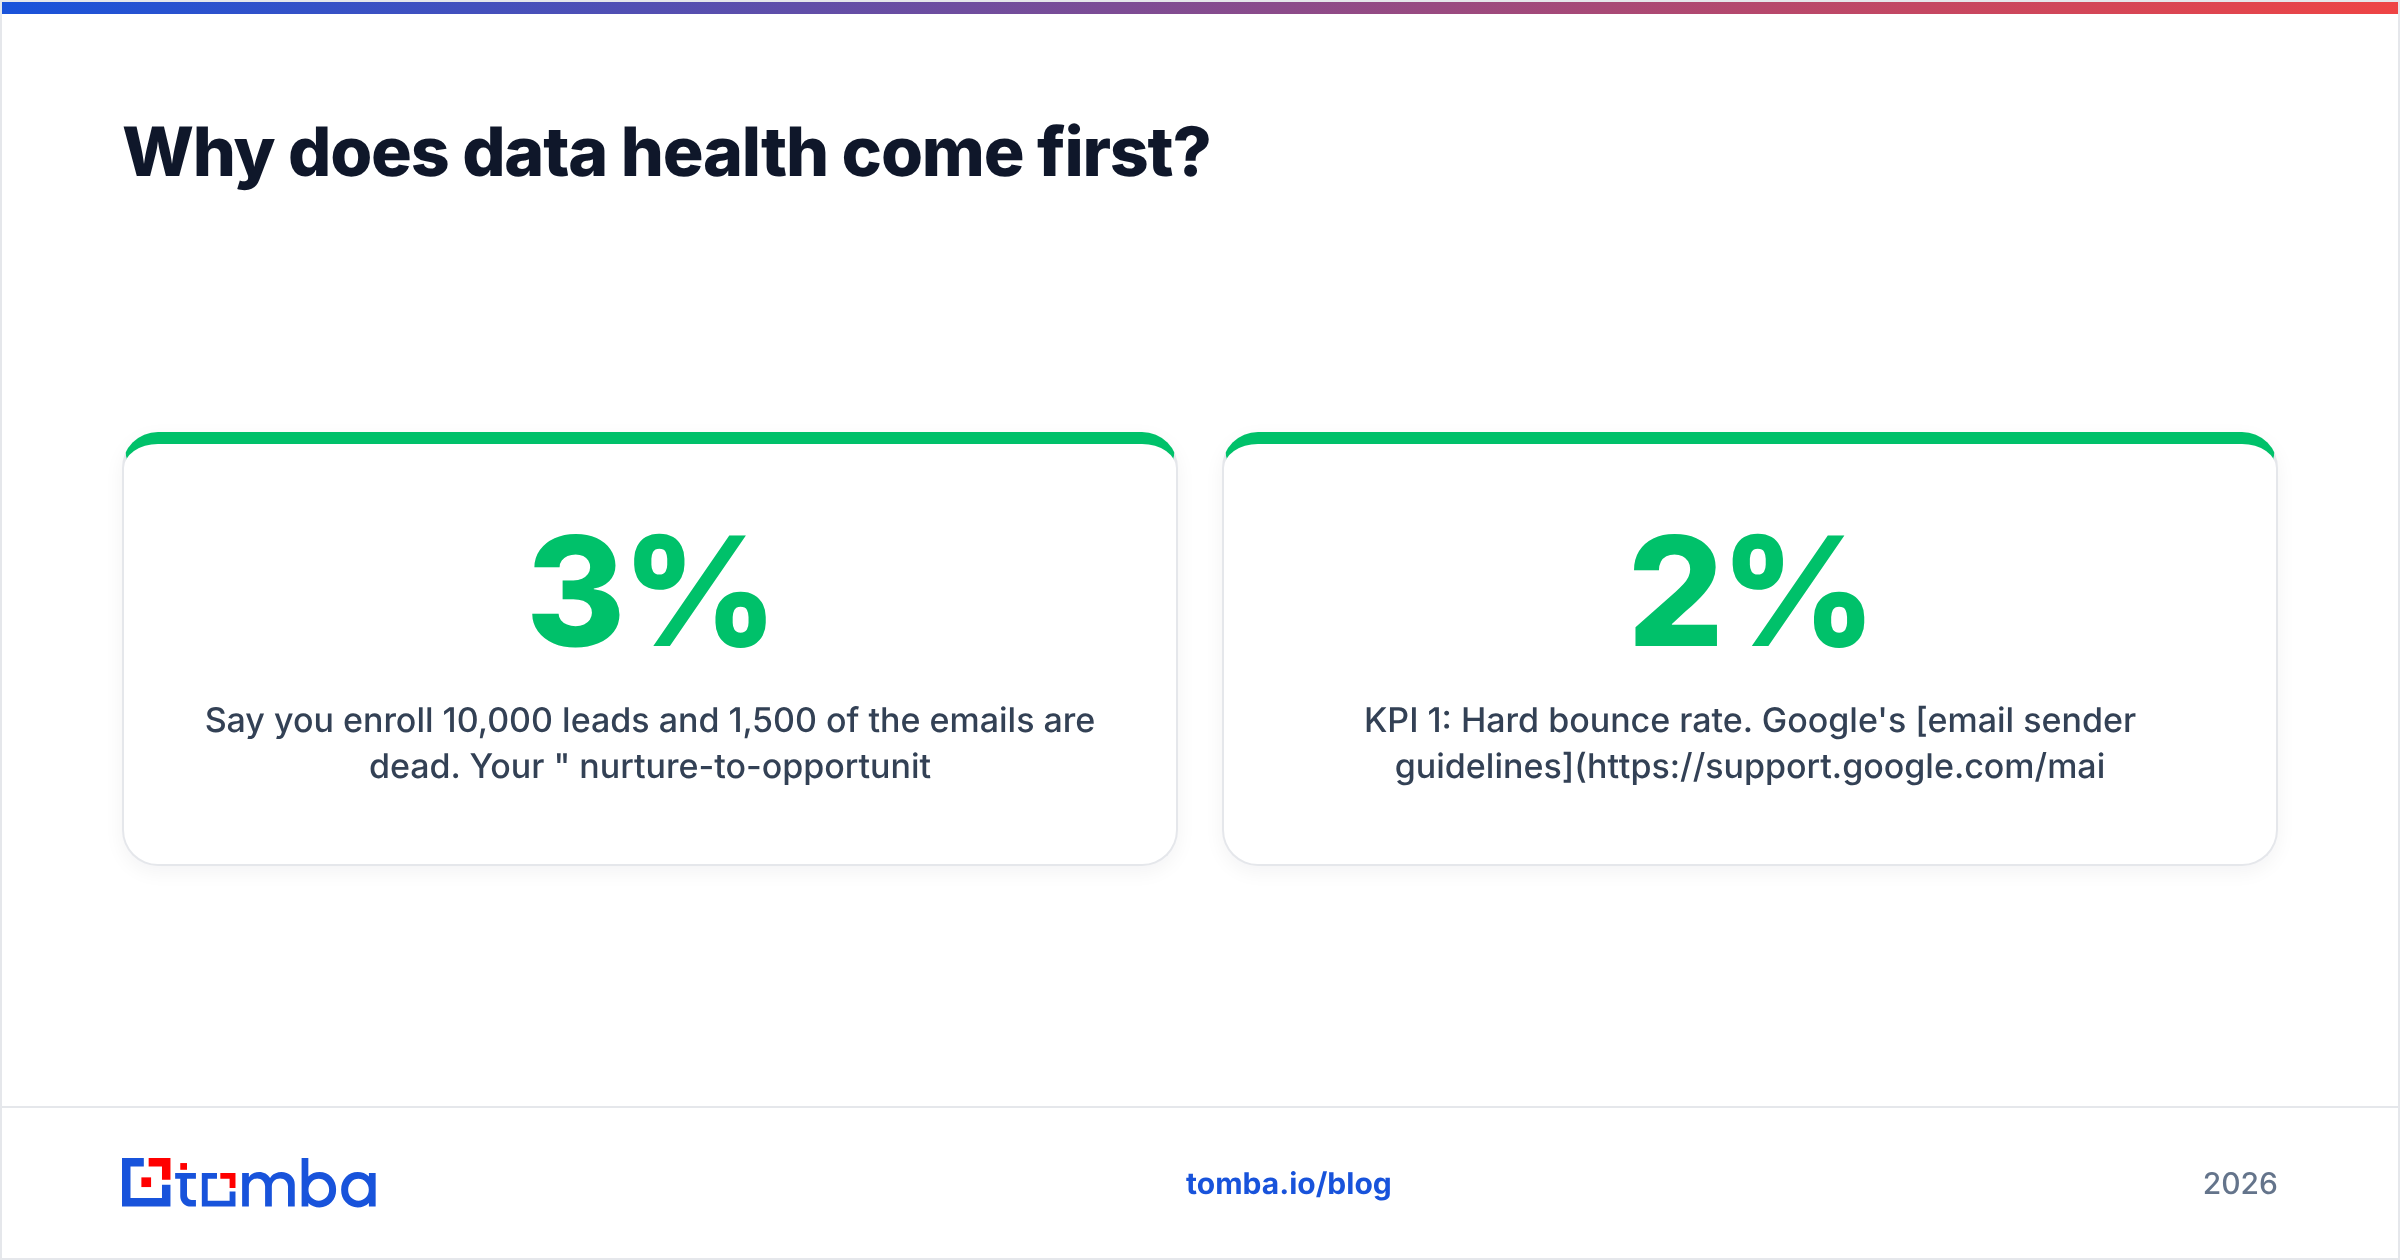
Say you enroll 10,000 leads and 1,500 of the emails are dead. Your "3% nurture-to-opportunity rate" is really 3.5% of reachable leads. Your reply rate looks weaker than it is. Meanwhile your sender reputation takes a hit, so real prospects start landing in spam. Once that happens, the engagement layer degrades for everyone.
KPI 1: Hard bounce rate. Google's email sender guidelines spell out how hard bounces and spam complaints hurt deliverability for bulk senders. Keep hard bounces under 2%. Run your lists through an email verifier before enrollment and again every 60–90 days. B2B data decays quickly as people change jobs.
KPI 2: Contact data completeness. Nurturing only works if you can segment. A CFO and a DevOps lead shouldn't get the same track. Measure the share of enrolled leads with job title, seniority, company size, and industry filled in. If most records are just an email address from a gated PDF, run data enrichment on inbound leads before routing them into tracks.

Which engagement metrics still mean something in 2026?#
Opens are mostly gone as a signal. Apple Mail Privacy Protection pre-fetches images and registers an "open" whether or not anyone read the email. Corporate security scanners do the same with links. If your nurture report leads with a 45% open rate, it's mostly measuring machines.
Here are the three engagement signals that still hold up.
KPI 3: Reply rate. Replies are the hardest engagement signal to fake. Nurture emails rarely ask for a reply, so a 1–5% range is healthy. Replies to a plain-text "Is this still a priority for your team?" check-in are some of the best buying signals you'll get. Route them to sales within hours. For how this differs from outbound benchmarks, see our glossary entry on email response rate.
KPI 4: Click rate, bot-filtered. Raw clicks are inflated by link scanners that click everything within seconds of delivery. Most modern automation platforms can filter these. If yours can't, exclude clicks that happen in the first 60 seconds or that hit every link in the email. What's left tells you whether the content matched the segment.
KPI 5: Unsubscribe rate per send. This is your over-mailing alarm. A spike after one email points to a bad subject line or topic. A slow climb across a track points to cadence fatigue. Watch spam complaints too. Unsubscribes cost you a contact, but complaints cost you deliverability.
What should you stop reporting?#
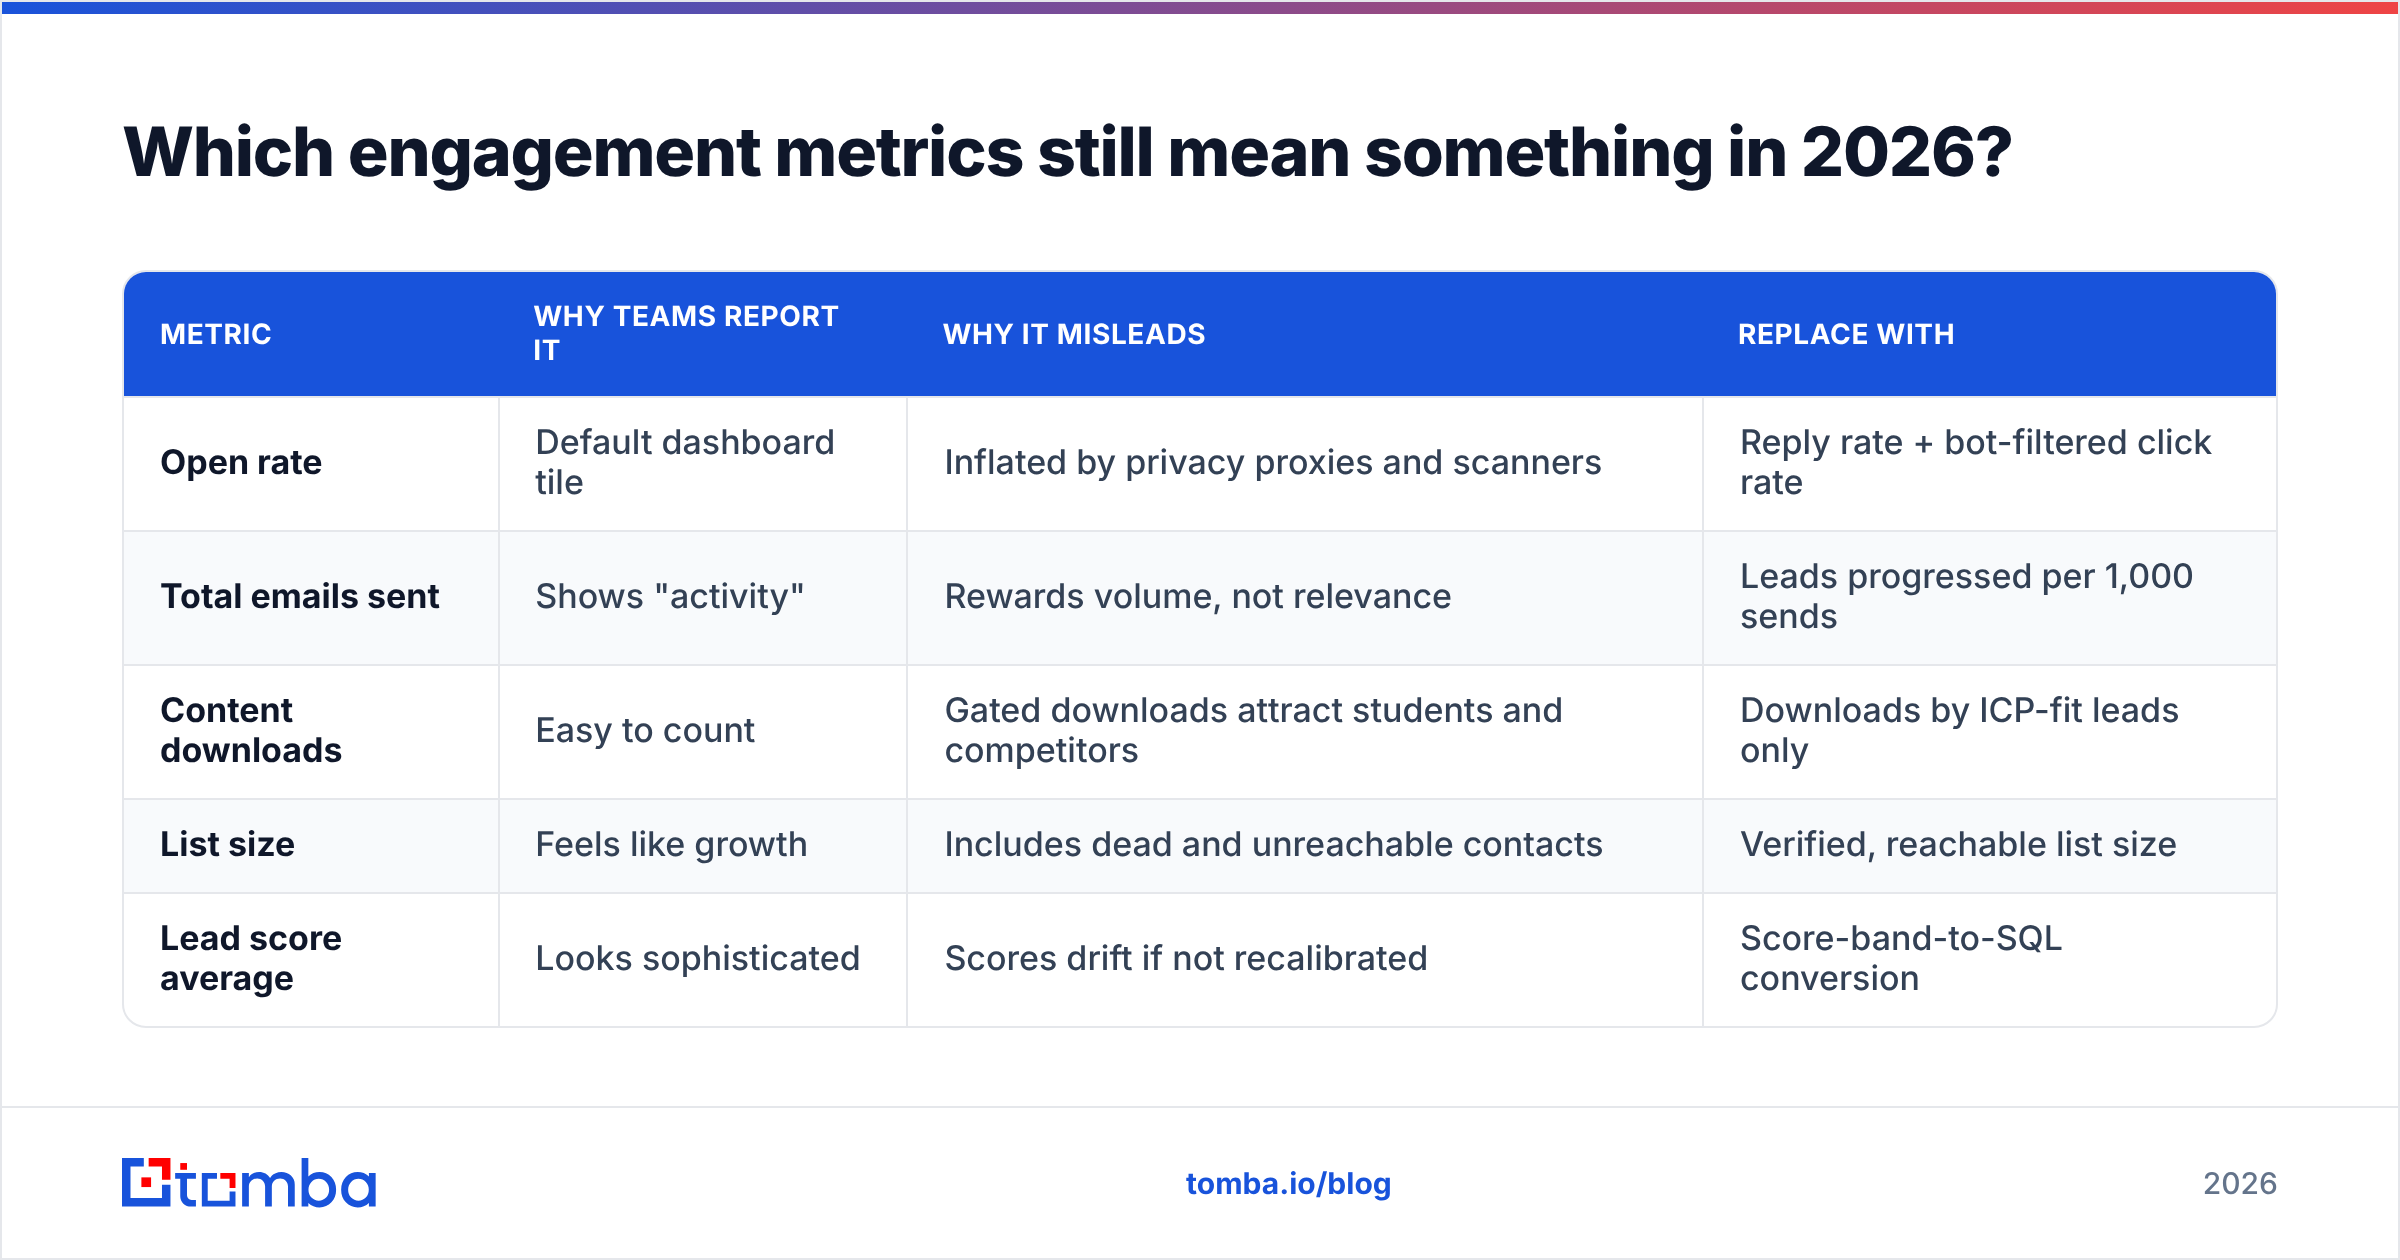
| Metric | Why teams report it | Why it misleads | Replace with |
|---|---|---|---|
| Open rate | Default dashboard tile | Inflated by privacy proxies and scanners | Reply rate + bot-filtered click rate |
| Total emails sent | Shows "activity" | Rewards volume, not relevance | Leads progressed per 1,000 sends |
| Content downloads | Easy to count | Gated downloads attract students and competitors | Downloads by ICP-fit leads only |
| List size | Feels like growth | Includes dead and unreachable contacts | Verified, reachable list size |
| Lead score average | Looks sophisticated | Scores drift if not recalibrated | Score-band-to-SQL conversion |
How do you measure whether leads are actually progressing?#
This is the layer most teams skip, and it's the one that shows whether nurturing works. Three KPIs cover it.
KPI 6: MQL-to-SQL conversion. Of the leads nurturing pushed over the marketing qualified lead threshold, how many did sales accept? A low rate means one of two things: your scoring rewards the wrong behavior, or nurture is surfacing leads that are engaged but not in your ICP. HubSpot and most CRMs can report this if lifecycle stages are stamped with dates. If they aren't, fix that before anything else.
KPI 7: Stage velocity. Measure the median days between lifecycle stages for nurtured leads: subscriber to MQL, MQL to SQL, SQL to opportunity. You want the MQL-to-SQL gap to shrink over time. If it's growing, your nurture tracks may be keeping leads "warm" without ever creating urgency.
KPI 8: Nurture-to-opportunity rate. Divide opportunities created from leads that were enrolled in nurture by total enrolled leads over the same window. This is the single number to put at the top of the report. It connects the work directly to sales outcomes, and it's hard to game.
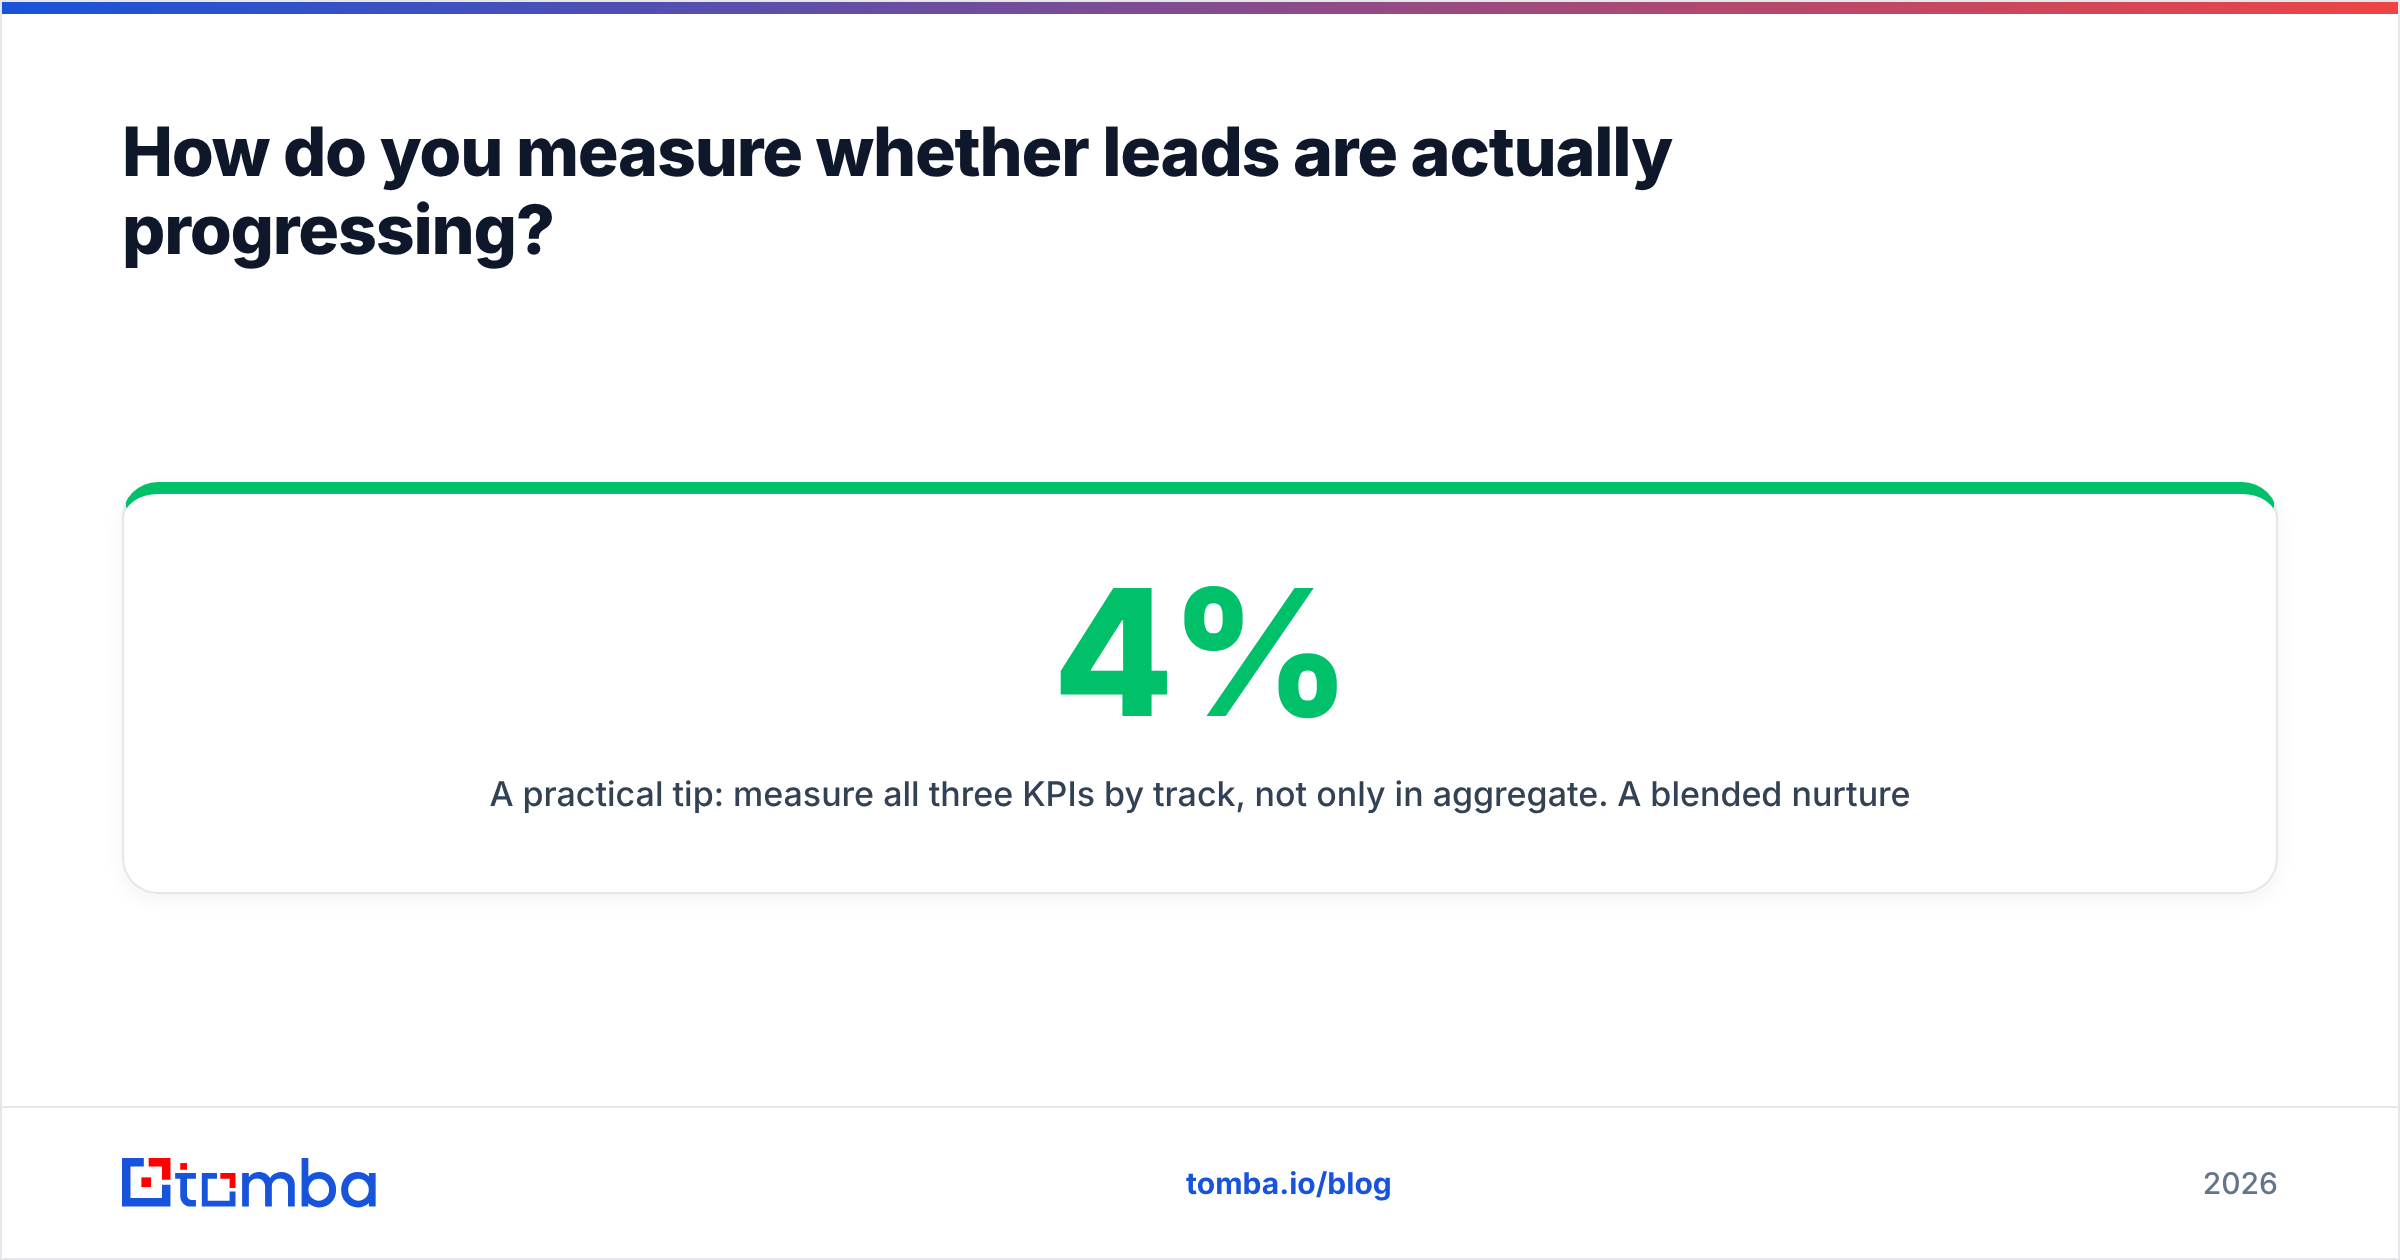
A practical tip: measure all three KPIs by track, not only in aggregate. A blended 4% nurture-to-opportunity rate can hide one track converting at 9% and another at 0.5%. The fix is obvious once the numbers are split. It's invisible when they're combined.
Which revenue KPIs prove nurturing is worth the budget?#
These are the numbers leadership cares about. Each one needs clean CRM attribution to report.
- Nurture-influenced pipeline (KPI 9). The total opportunity value where the contact had at least one meaningful nurture touch before the opp was created, such as a reply, a bot-filtered click, or a content consumption event. Report it as a dollar figure and as a share of total pipeline. Influence models overcount, so pair this with the control-group comparison below.
- Win rate, nurtured vs. non-nurtured (KPI 10). Compare the close rate of opps from nurtured leads with opps from leads that skipped nurture. If nurtured deals don't close at a higher rate, the program may be generating volume without improving quality.
- Sales cycle length for the nurtured cohort (KPI 11). Educated buyers should need fewer discovery calls. If nurtured deals take longer to close, check whether nurture is attracting early-stage researchers who aren't ready to buy yet.
- Cost per nurtured opportunity (KPI 12). Add up platform cost, content production, and ops time, then divide by opportunities from nurture. Compare that with your paid-channel cost per opportunity. Nurturing usually wins here, which is exactly why it deserves budget.
- The control group that makes it all credible. Hold back a random 10% of eligible leads from nurture for one quarter. Without a holdout, every revenue KPI is correlation. With one, you can tell your revenue operations team how much lift the program actually caused.
Research from firms like Forrester has argued for years that B2B buyers spend most of their journey researching on their own before they talk to sales. Nurturing is how you stay involved during that phase. The revenue KPIs are how you show it paid off.

How do you set up a lead nurturing KPI dashboard?#
Keep it to one screen with four rows, one per layer. Here's a practical build order.
- Stamp lifecycle dates. Every stage change in your CRM needs a timestamp. Without them, velocity and conversion reporting won't work.
- Tag nurture enrollment. Add a field or list membership for which track each lead entered, and when. This is what lets you split KPIs by track.
- Verify before enrollment. Add an email verification step at the point of entry, whether that's a form fill, list import, or event upload. This keeps KPI 1 under control automatically instead of requiring quarterly cleanups.
- Filter bot engagement. Turn on bot-click filtering in your automation platform and drop open rate from the primary view.
- Build the holdout. Randomly exclude a small share of new eligible leads each month. Tag them so they can be reported separately.
- Review monthly, recalibrate quarterly. Engagement KPIs move fast and deserve a monthly look. Revenue KPIs need a full sales cycle before they mean anything, so judge them quarterly.
Is a high engagement rate a good sign?#
Not always. High engagement combined with low progression usually means one of three things:
- Wrong audience. Your content attracts practitioners and students, not buyers. Check ICP fit on your most engaged segment.
- No call to action. The track educates but never asks for anything. Add one clear, low-friction next step to each email, like a short assessment, a benchmark report, or a 15-minute call.
- Scoring disconnect. Leads are engaging but never cross the MQL threshold because your scoring model underweights the actions they take. Look at the engagement patterns of recently closed-won deals and reweight around them.
The reverse also happens. Low engagement with healthy progression often means a small, well-targeted track is doing its job. Don't "optimize" it by broadening the audience.
How often should you revisit your nurture KPIs?#
Set a simple cadence:
- Weekly: bounce rate and unsubscribe spikes, which are operational alarms.
- Monthly: reply rate, click rate, and MQL-to-SQL conversion by track.
- Quarterly: stage velocity, nurture-to-opportunity rate, influenced pipeline, and the holdout comparison.
- Annually: reset the healthy ranges from your own trailing data and retire tracks that haven't produced an opportunity in two quarters.
The last one matters more than it looks. Nurture programs pile up tracks the way garages pile up boxes. Every dead track still sends email, still burns sender reputation, and still dilutes your aggregate KPIs.
What's the bottom line on lead nurturing KPIs?#
Measure four layers in order: data health, engagement, progression, revenue. Drop open rate. Put nurture-to-opportunity rate at the top of the report. Prove causation with a holdout group. Most of all, don't let bad contact data spoil the math, because every ratio on your dashboard is only as accurate as the list behind it.
If your nurture tracks are starving for reachable, correctly attributed contacts, start at the source. Tomba Email Finder finds professional email addresses by name, domain, or company, and pairs with built-in verification. That means the leads entering your tracks are real people at the right accounts, not bounces waiting to show up in next quarter's KPI review. The free tier includes 25 searches a month, and paid plans start at $49/mo. You can compare options on the Tomba pricing page.
Related guides#
// get started
Find, verify and enrich your first contacts today
Start on the free plan with 25 searches a month, then scale when your team is ready.
Free plan · No credit card required · GDPR & CCPA
Get the Tomba newsletter
Product and data updates
// about the author