Lead Quality Scoring: How to Build a Model Your Sales Team Trusts
Most lead scores reward whoever clicks the most, not whoever is most likely to buy. Here's how to build a lead quality scoring model around fit, intent, and data accuracy, with a template you can copy.
TL;DR
- Lead quality scoring ranks leads by how likely they are to turn into revenue. That is a different question from how much they engaged, which is what most legacy scores measure.
- A useful model has three layers: fit (does the lead match your ICP?), intent (are they actively evaluating?), and data quality (can you actually reach them?).
- Weight fit the heaviest, add score decay to intent signals, and make an unreachable contact a hard disqualifier rather than a small deduction.
- Rebuild the model from closed-won and closed-lost data every quarter. Judge it by win rate per score band, not by MQL volume.
- Your score is only as good as the data underneath it. Enrichment and email verification belong at the start of the process, not after it.
What is lead quality scoring?#
Lead quality scoring gives each lead a number, or a grade, for how likely it is to become a paying customer. It then uses that number to decide who sales contacts first, who goes into nurture, and who gets dropped.
Think of a hospital triage nurse. They don't treat patients in arrival order, and they don't treat whoever complains loudest. They check a few signals that predict severity and route each patient to the right place. Lead quality scoring does the same job for your pipeline.
The standard definition of lead scoring covers any method that ranks prospects by perceived value. "Quality" scoring is a narrower idea. It deliberately separates who the lead is and whether you can reach them from how many emails they opened. That separation matters because the classic points-for-activity model is the main reason sales teams stop trusting the marketing qualified lead label.
Why do most lead scoring models fail?#
Most models fail because they measure engagement volume and label it quality. Some common failure patterns:
- Students and job seekers score high. They download every ebook and attend every webinar. They will never buy.
- Competitors score high. They read your pricing page five times a week.
- Real buyers score low. A VP of Operations at an ideal-fit account visits once, reads the security page, and leaves. The score says "cold."
- Scores never decay. Someone who clicked a lot 14 months ago still sits at 85.
- Bad contact data is ignored. A lead scores 90, gets routed to an SDR, and the email bounces. Nobody fixes the model.

Each of these problems has the same root cause: the model is built from inputs that are easy to track, not from inputs that predict revenue. The fix isn't more rules. The fix is a model with clear layers.
What are the three layers of a lead quality score?#
A reliable lead quality score is built from three independent layers. Scoring each one separately lets you see why a lead scored the way it did. It also stops a high engagement number from hiding a bad fit.
- Fit (explicit data). Firmographics and demographics: industry, company size, revenue band, region, tech stack, job title, seniority, department. This answers: "If this person wanted to buy, would we want to sell to them?"
- Intent (implicit and behavioral data). High-signal actions such as pricing-page visits, demo requests, and comparison-page views, plus third-party intent topics and product usage for PLG motions. This answers: "Are they in-market right now?"
- Data quality (reachability). Is the email verified, or is it risky or catch-all? Is there a direct phone number? Is the title current? Is the record deduplicated? This answers: "Can sales actually start a conversation?"
- Negative signals. Competitor domains, free-mail addresses on B2B forms, student titles, unsubscribes, hard bounces, and careers-page-only traffic. These subtract points or disqualify outright.
- Decay. Intent points lose value over time. A demo request from yesterday and one from last spring should not carry the same weight.
Most teams already do some version of layers 1 and 2. Layer 3 is the one they skip, and it is the cheapest to fix.
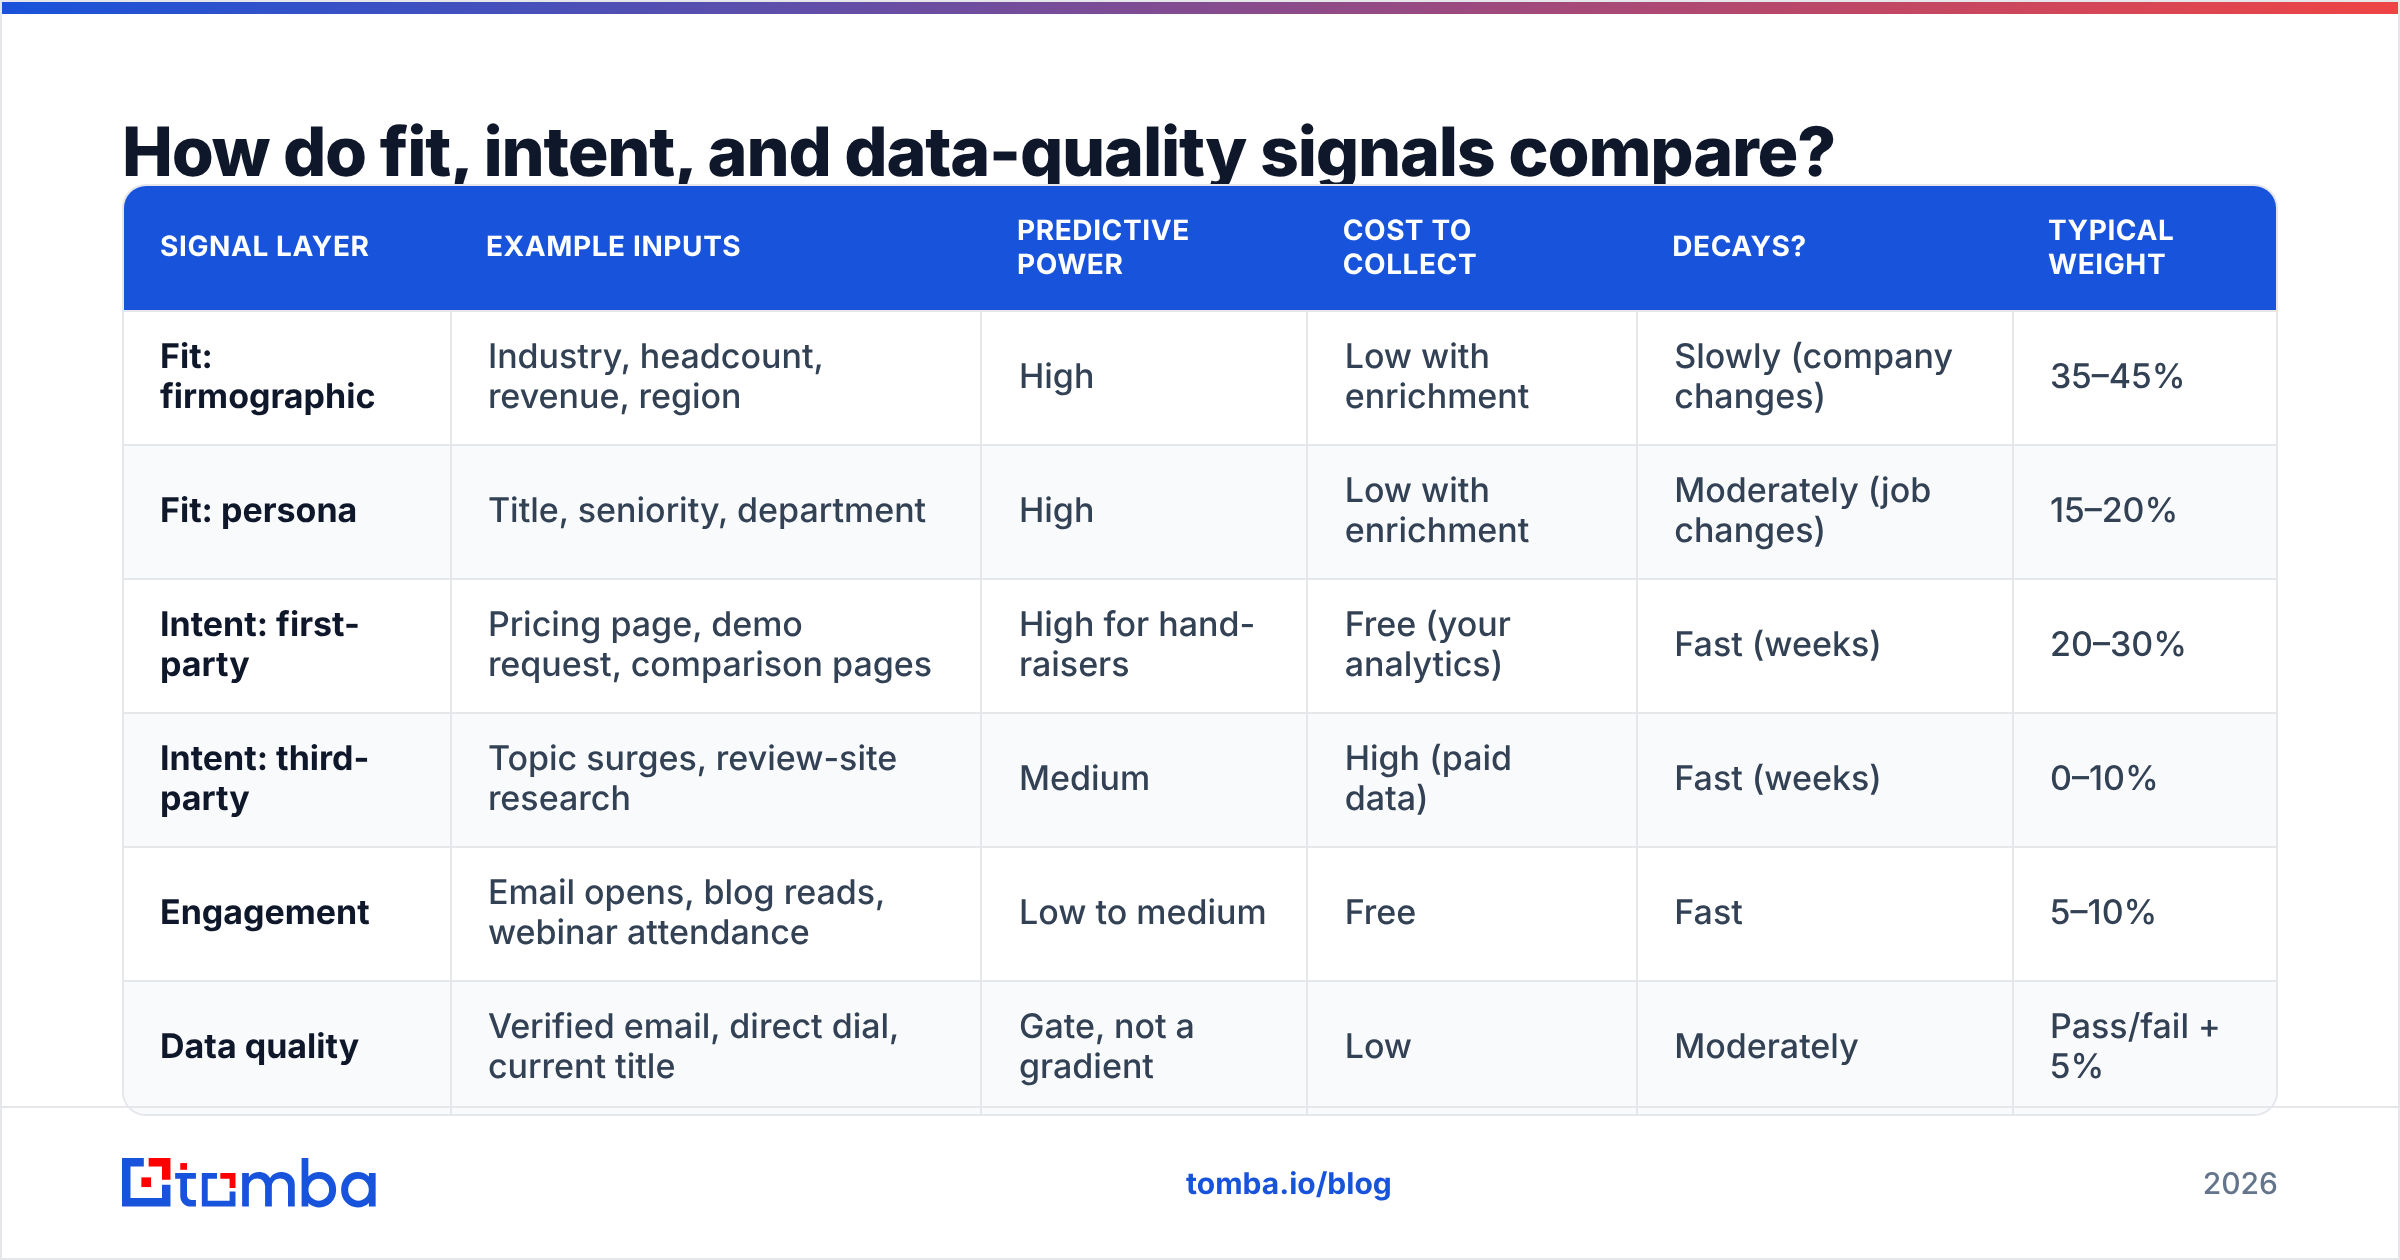
How do fit, intent, and data-quality signals compare?#
Every signal is not equally predictive, and some are much cheaper to collect than others. Use this table to decide what to include first:
| Signal layer | Example inputs | Predictive power | Cost to collect | Decays? | Typical weight |
|---|---|---|---|---|---|
| Fit: firmographic | Industry, headcount, revenue, region | High | Low with enrichment | Slowly (company changes) | 35–45% |
| Fit: persona | Title, seniority, department | High | Low with enrichment | Moderately (job changes) | 15–20% |
| Intent: first-party | Pricing page, demo request, comparison pages | High for hand-raisers | Free (your analytics) | Fast (weeks) | 20–30% |
| Intent: third-party | Topic surges, review-site research | Medium | High (paid data) | Fast (weeks) | 0–10% |
| Engagement | Email opens, blog reads, webinar attendance | Low to medium | Free | Fast | 5–10% |
| Data quality | Verified email, direct dial, current title | Gate, not a gradient | Low | Moderately | Pass/fail + 5% |
Two things stand out. First, email opens are one of the weakest signals you can score, especially now that privacy features inflate open tracking. Second, data quality works best as a gate and not a sliding scale. A perfect-fit, high-intent lead with an invalid email isn't an 80. It's a lead you can't work until the data is fixed.
How do you build a lead quality scoring model step by step?#
You can build a working first version in a spreadsheet in about a day. Here is the sequence.
Step 1: Pull your closed-won and closed-lost deals#
Export the last 12 to 18 months of opportunities from your CRM with the originating contact and account attached. You need a minimum of about 40 to 50 closed-won deals for the patterns to mean anything. With fewer than that, start with a rules-based model built on sales team interviews and plan to recalibrate once you have more data.
Step 2: Fill in the missing fields before you analyze#
This is where most scoring projects quietly break. Half of your historical leads will have no industry, a blank headcount, or a title like "Manager." If you analyze incomplete records, the model learns that "unknown industry" predicts nothing. That tells you about your data, not about your buyers.
Run the historical records through data enrichment first, so every closed-won and closed-lost record has comparable firmographic and persona fields. Then look for the attributes that are overrepresented in wins compared with losses.
Step 3: Assign fit points by lift, not by gut feel#
For each attribute value, compare its share of closed-won deals to its share of all leads. If 40% of your wins are companies with 200 to 1,000 employees, but that band makes up only 15% of your lead volume, the lift is strong. It deserves heavy points. If "Director" titles appear at the same rate in wins and losses, they deserve few points, whatever your gut says.
Step 4: Score only high-signal intent actions#
Pick five to eight behaviors that actually come before a sale. Ignore the rest. A short list is easier to explain to reps and harder to game.
Step 5: Add the data-quality gate#
Before a lead can reach sales-ready status, it has to pass three checks: a deliverable email, a current role, and no duplicate owner in the CRM. Running an email verifier at the moment a lead enters your system stops bounced first-touch emails from reaching sales. It also protects your sender reputation.
Step 6: Set thresholds and routing#
Define three or four score bands with an explicit action for each band. A score with no attached action is just decoration.
Step 7: Backtest, then launch#
Apply the model to last year's leads and check whether the top band actually converted at a higher rate. If it didn't, fix the weights before you ship.
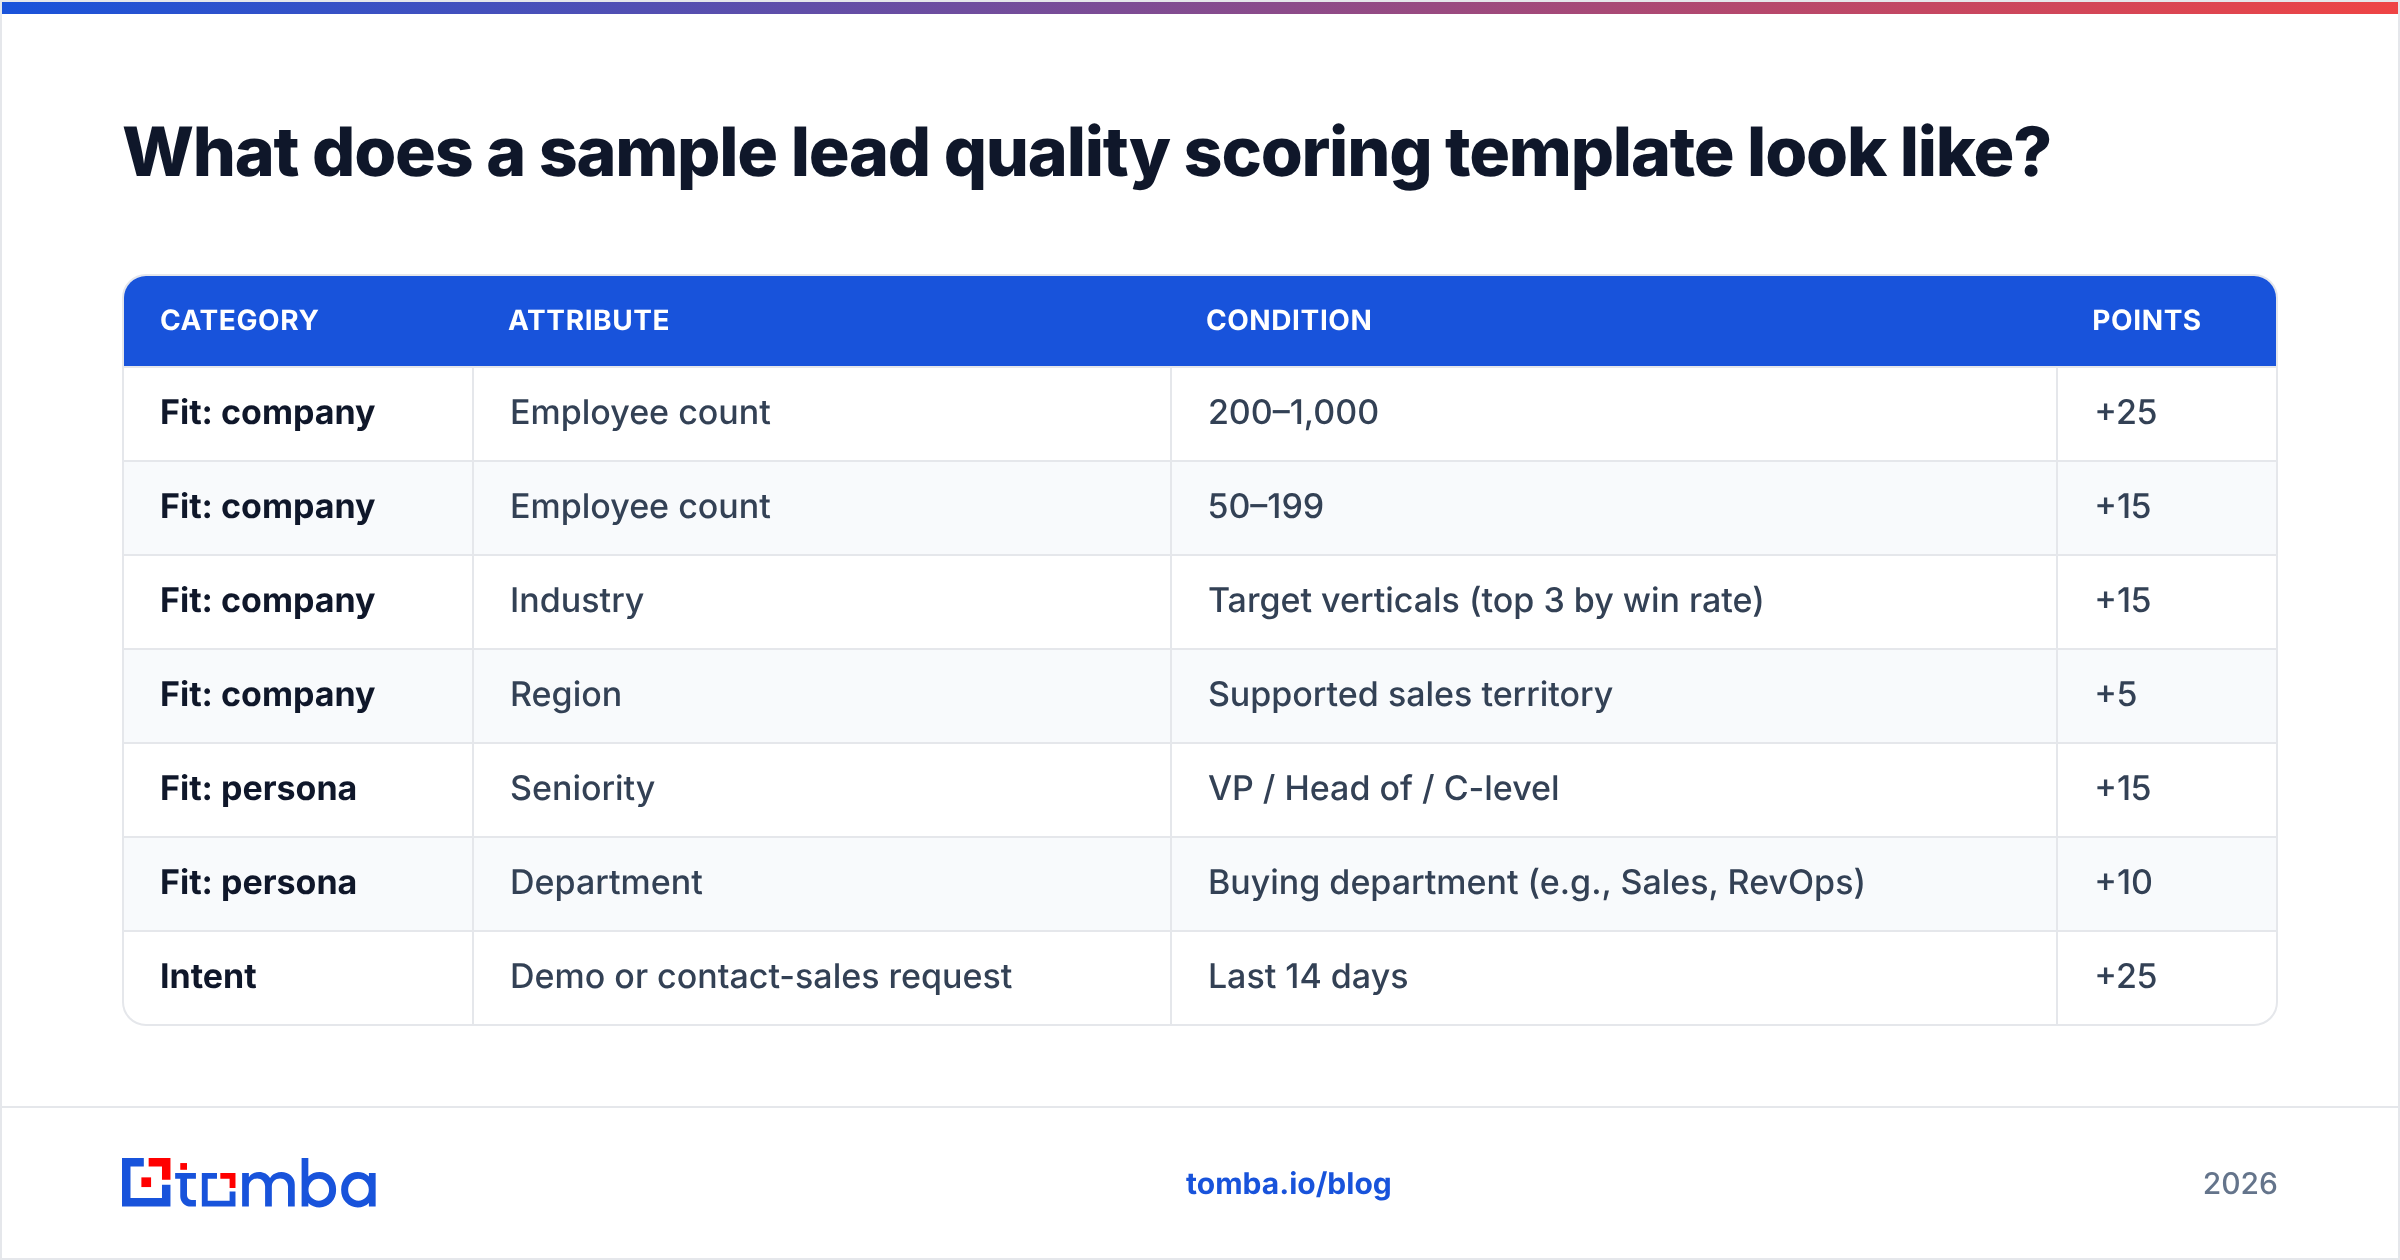
What does a sample lead quality scoring template look like?#
Here is a starting template for a mid-market B2B SaaS company. Copy the structure and replace the values with what your own closed-won analysis shows.
| Category | Attribute | Condition | Points |
|---|---|---|---|
| Fit: company | Employee count | 200–1,000 | +25 |
| Fit: company | Employee count | 50–199 | +15 |
| Fit: company | Industry | Target verticals (top 3 by win rate) | +15 |
| Fit: company | Region | Supported sales territory | +5 |
| Fit: persona | Seniority | VP / Head of / C-level | +15 |
| Fit: persona | Department | Buying department (e.g., Sales, RevOps) | +10 |
| Intent | Demo or contact-sales request | Last 14 days | +25 |
| Intent | Pricing page views | 2+ in last 30 days | +10 |
| Intent | Competitor comparison page | Last 30 days | +8 |
| Engagement | Webinar attended | Last 60 days | +3 |
| Data quality | Email status | Verified deliverable | +5 |
| Data quality | Email status | Invalid / hard bounce | Disqualify |
| Data quality | Email status | Catch-all / risky | Hold for review |
| Negative | Domain | Competitor or free-mail on B2B form | −40 |
| Negative | Title | Student, intern, "looking for work" | −30 |
| Decay | Any intent points | Older than 30 days | −50% |
Suggested routing bands
- 80+ (A leads): route to an AE or senior SDR within one business hour.
- 55–79 (B leads): SDR sequence within 24 hours.
- 30–54 (C leads): marketing nurture. Rescore weekly.
- Below 30 or disqualified: suppress from outbound. Fix the data or archive.
A useful trick is to show the score as a letter plus a number, for example A2. The letter is the fit grade and the number is the intent level. Reps can then tell at a glance whether a lead is "right company, not ready yet" (A4) or "wrong company, very active" (D1). Those two leads need completely different handling.
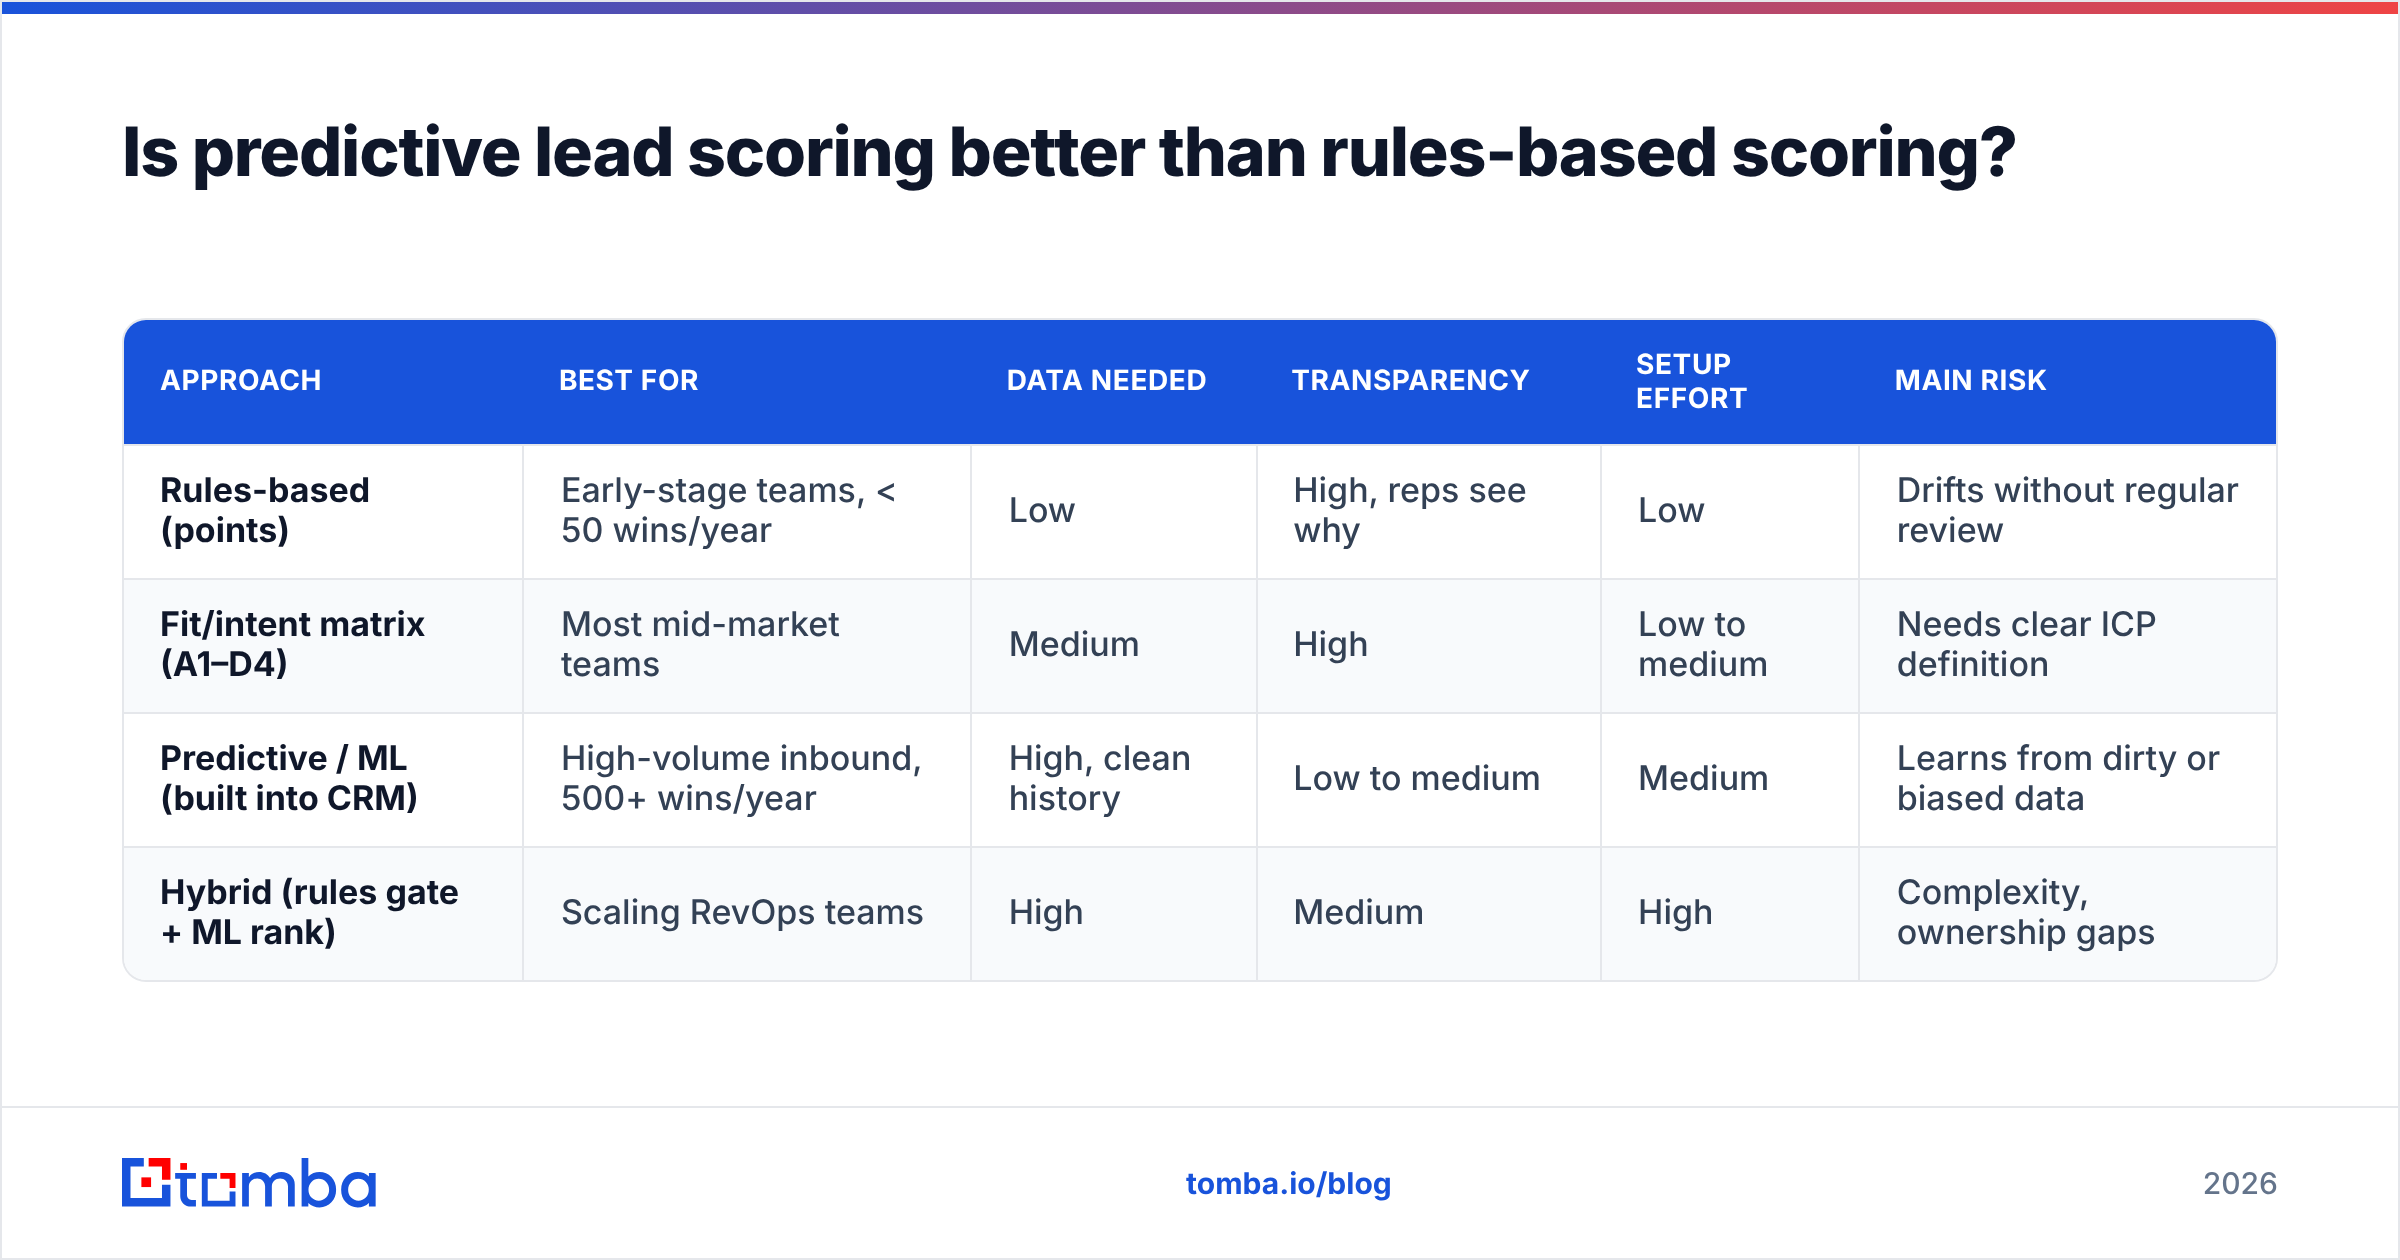
Is predictive lead scoring better than rules-based scoring?#
Not automatically. Predictive scoring (machine learning on your CRM history) works well when you have lots of clean historical data. Rules-based scoring wins when you don't. Here is how the main approaches compare:
| Approach | Best for | Data needed | Transparency | Setup effort | Main risk |
|---|---|---|---|---|---|
| Rules-based (points) | Early-stage teams, < 50 wins/year | Low | High, reps see why | Low | Drifts without regular review |
| Fit/intent matrix (A1–D4) | Most mid-market teams | Medium | High | Low to medium | Needs clear ICP definition |
| Predictive / ML (built into CRM) | High-volume inbound, 500+ wins/year | High, clean history | Low to medium | Medium | Learns from dirty or biased data |
| Hybrid (rules gate + ML rank) | Scaling RevOps teams | High | Medium | High | Complexity, ownership gaps |
Major CRM platforms such as HubSpot and Salesforce now include both manual and AI-assisted scoring on their higher tiers. The tool isn't usually the bottleneck. The inputs are. A predictive model trained on records that are 30% incomplete will confidently learn the wrong patterns. That's why enrichment and verification come before any modeling choice.
If you are unsure, start with a fit/intent matrix. It's easy to explain in a pipeline review, and it gives you clean labeled data you can use to train a predictive model later.
How does data quality affect lead scores?#
Data quality affects scores more than most teams realize, because errors pile up in both directions.
- False negatives: a strong-fit lead fills out a short form with just an email address. With no company size, industry, or title on the record, they score 20 and land in nurture forever. Enrichment at capture fixes this.
- False positives: a lead scores 85, but the email is outdated because the person changed jobs eight months ago. The SDR's first touch bounces. Enough bounces like that will hurt your email deliverability for every sequence you run.
- Duplicate inflation: the same person exists as three records, each earning points separately, or worse, split across two owners.
- Catch-all ambiguity: many B2B domains accept all mail at the server level, so a basic check can't confirm the mailbox exists. Treat these as "hold for review" and don't score them as verified.
B2B contact data degrades constantly as people change roles, companies get acquired, and domains migrate. Analysts at firms such as Gartner have repeatedly flagged poor data quality as a major, underestimated cost for revenue teams. The practical takeaway is simple: re-verify and re-enrich any lead that has been in your system for more than about 90 days before you rescore it.
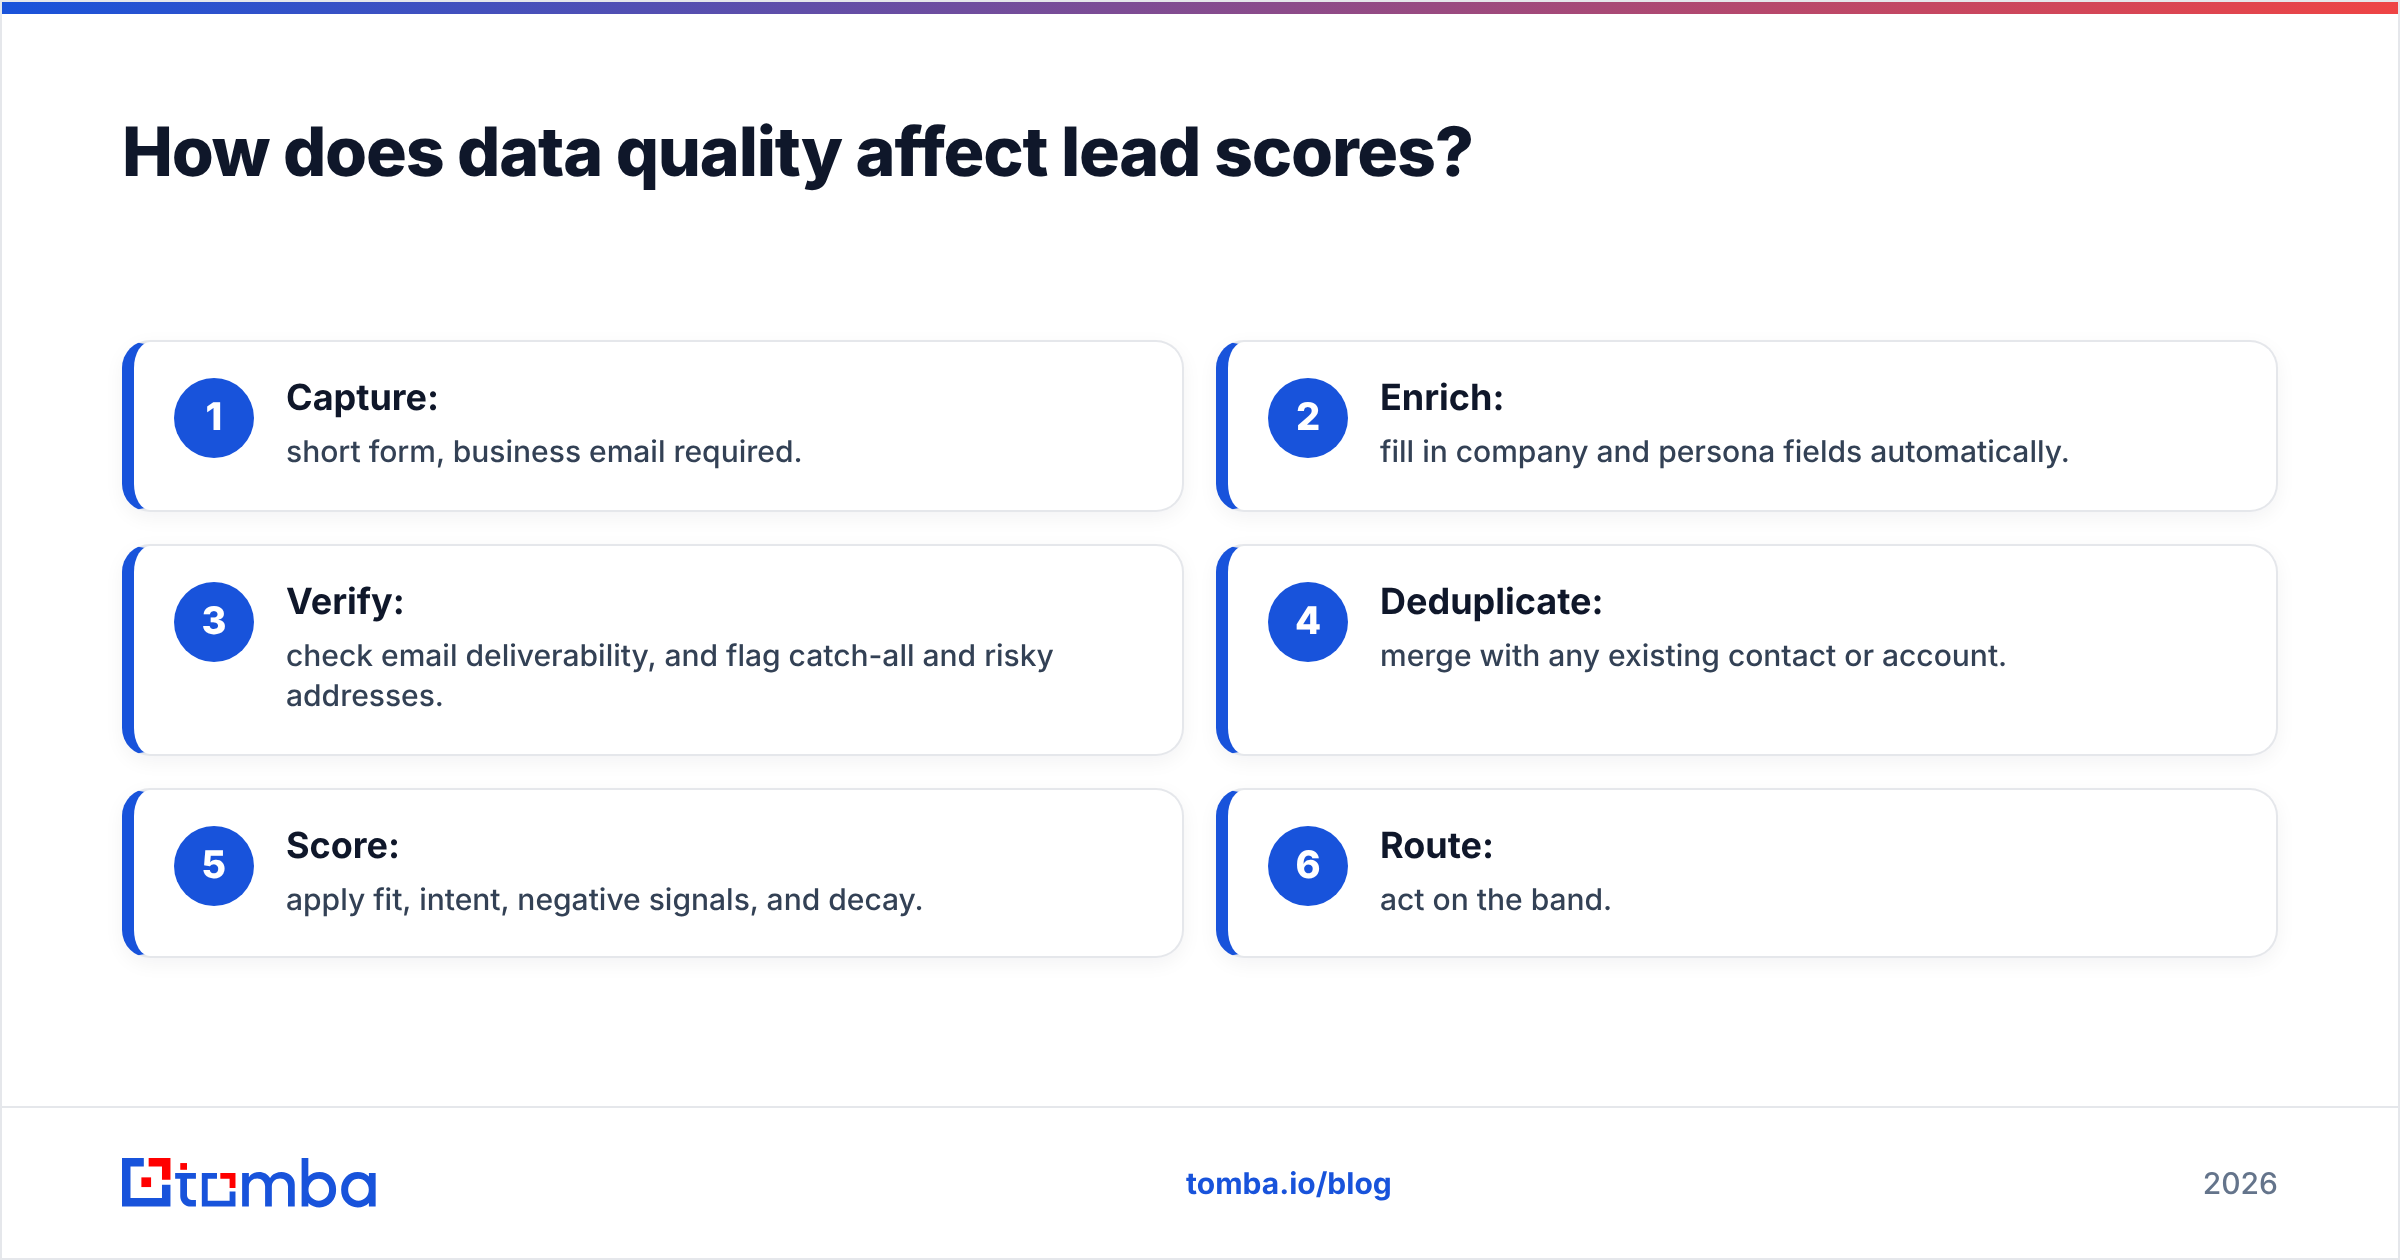
Here is a clean order of operations:
- Capture: short form, business email required.
- Enrich: fill in company and persona fields automatically.
- Verify: check email deliverability, and flag catch-all and risky addresses.
- Deduplicate: merge with any existing contact or account.
- Score: apply fit, intent, negative signals, and decay.
- Route: act on the band.
If you run steps 2 to 4 after scoring, you are scoring noise.
How do you know if your lead quality scoring is working?#
Judge your model by what happens to the leads after sales gets them, not by how many MQLs it produces. Track these metrics monthly:
- Conversion rate by score band. A leads should convert to opportunity at several times the rate of C leads. If the bands convert at about the same rate, the model isn't separating anything.
- Win rate by band. Opportunity creation alone can be gamed. Check closed-won too.
- Speed-to-lead for A leads. A great score is worthless if top leads wait two days for a reply.
- Sales acceptance rate. What share of routed leads do reps accept instead of rejecting? A falling acceptance rate is your earliest warning sign.
- Bounce rate on first touch. Anything above about 2% on routed leads points to a data-quality gap, not a copy problem.
- Score distribution. If 60% of your database scores 80+, the thresholds are too loose or decay is broken.

Schedule a quarterly recalibration. Pull the latest closed-won and closed-lost deals, recalculate lift per attribute, and adjust the weights. Markets move, your ICP gets sharper, and new product lines attract different buyers. A score you set once and never revisit will drift out of date within a year.
What are common lead quality scoring mistakes to avoid?#
- Scoring the person but not the account. In B2B, three mid-intent people from one target account are a stronger signal than one high-intent person. Roll contact scores up to an account score.
- Too many rules. Forty scoring criteria can't be explained or debugged. Keep it to 15 to 20.
- No negative scoring. If nothing ever subtracts points, scores only go up, and eventually everyone becomes an MQL.
- Letting marketing own it alone. Build the model with sales, RevOps, and marketing in the same room. Sales has to agree to follow up on A leads within the SLA, and marketing has to agree to stop sending unscored leads.
- Ignoring outbound leads. Prospects your SDRs source should also be scored for fit and data quality before they enter a sequence, not only inbound leads.
Ready to score leads you can actually reach?#
A lead quality scoring model is only as trustworthy as the contact data it runs on. If your top-scored leads keep bouncing, or your best-fit accounts have no named decision-maker attached, start with the reachability layer. The Tomba Email Finder finds professional email addresses by domain, name, or company, so every high-fit account in your model has a real, contactable person behind it. Pair it with verification before routing, and your A leads will actually reach an inbox. You can start on the free tier (25 searches a month) and scale to Starter at $49/mo once the model proves itself.
Related guides#
// get started
Find, verify and enrich your first contacts today
Start on the free plan with 25 searches a month, then scale when your team is ready.
Free plan · No credit card required · GDPR & CCPA
// about the author