Lead Scoring Case Studies: 6 Models, What Worked and Why
Six lead scoring case studies, from a SaaS team buried in MQLs to an ABM model built around buying committees. Here's what broke, what fixed it, and the data problem underneath most of them.
TL;DR
- Most lead scoring models don't fail because of weak math. They fail because of weak inputs: stale contacts, bounced emails, and firmographics that were never filled in.
- Below are six composite case studies: rules-based, negative scoring, predictive, data-quality-first, product-led, and account-based. Each one covers the problem, the fix, and the lesson you can reuse.
- Negative scoring and score decay are the two cheapest fixes, and teams skip them more than any others.
- Predictive scoring only beats a well-tuned rules model once you have several hundred closed-won deals and clean CRM history.
- Start by fixing your data (enrichment plus verification). Then tune the weights. Buy a predictive tool last.
A quick note on method: the case studies below are anonymized composites. Each one is built from deployment patterns that come up again and again in B2B sales and marketing ops teams. The numbers are there to show direction and scale. They are not audited results from one named company. If a vendor shows you a case study with a single perfect before/after number, ask what else changed that quarter.
What are lead scoring case studies actually good for?#
Lead scoring gives each lead a number based on how well it fits your ideal customer profile and how interested it seems. Sales then works the highest-value leads first. The Wikipedia entry on lead scoring describes the two classic dimensions: fit (who they are) and engagement (what they've done).
The idea is simple. Getting it to work is not. Case studies help because they show you where models break in practice:
- A score threshold set so low that sales stops trusting the marketing qualified lead label
- A model that rewards students and competitors for downloading whitepapers
- A "hot" lead whose email address bounces on the first touch
- A predictive model trained on 40 closed deals and sold as "AI-powered"
Read the cases below as failure-mode studies. Each one gives you a diagnostic question to ask about your own funnel.
How do the main lead scoring models differ?#
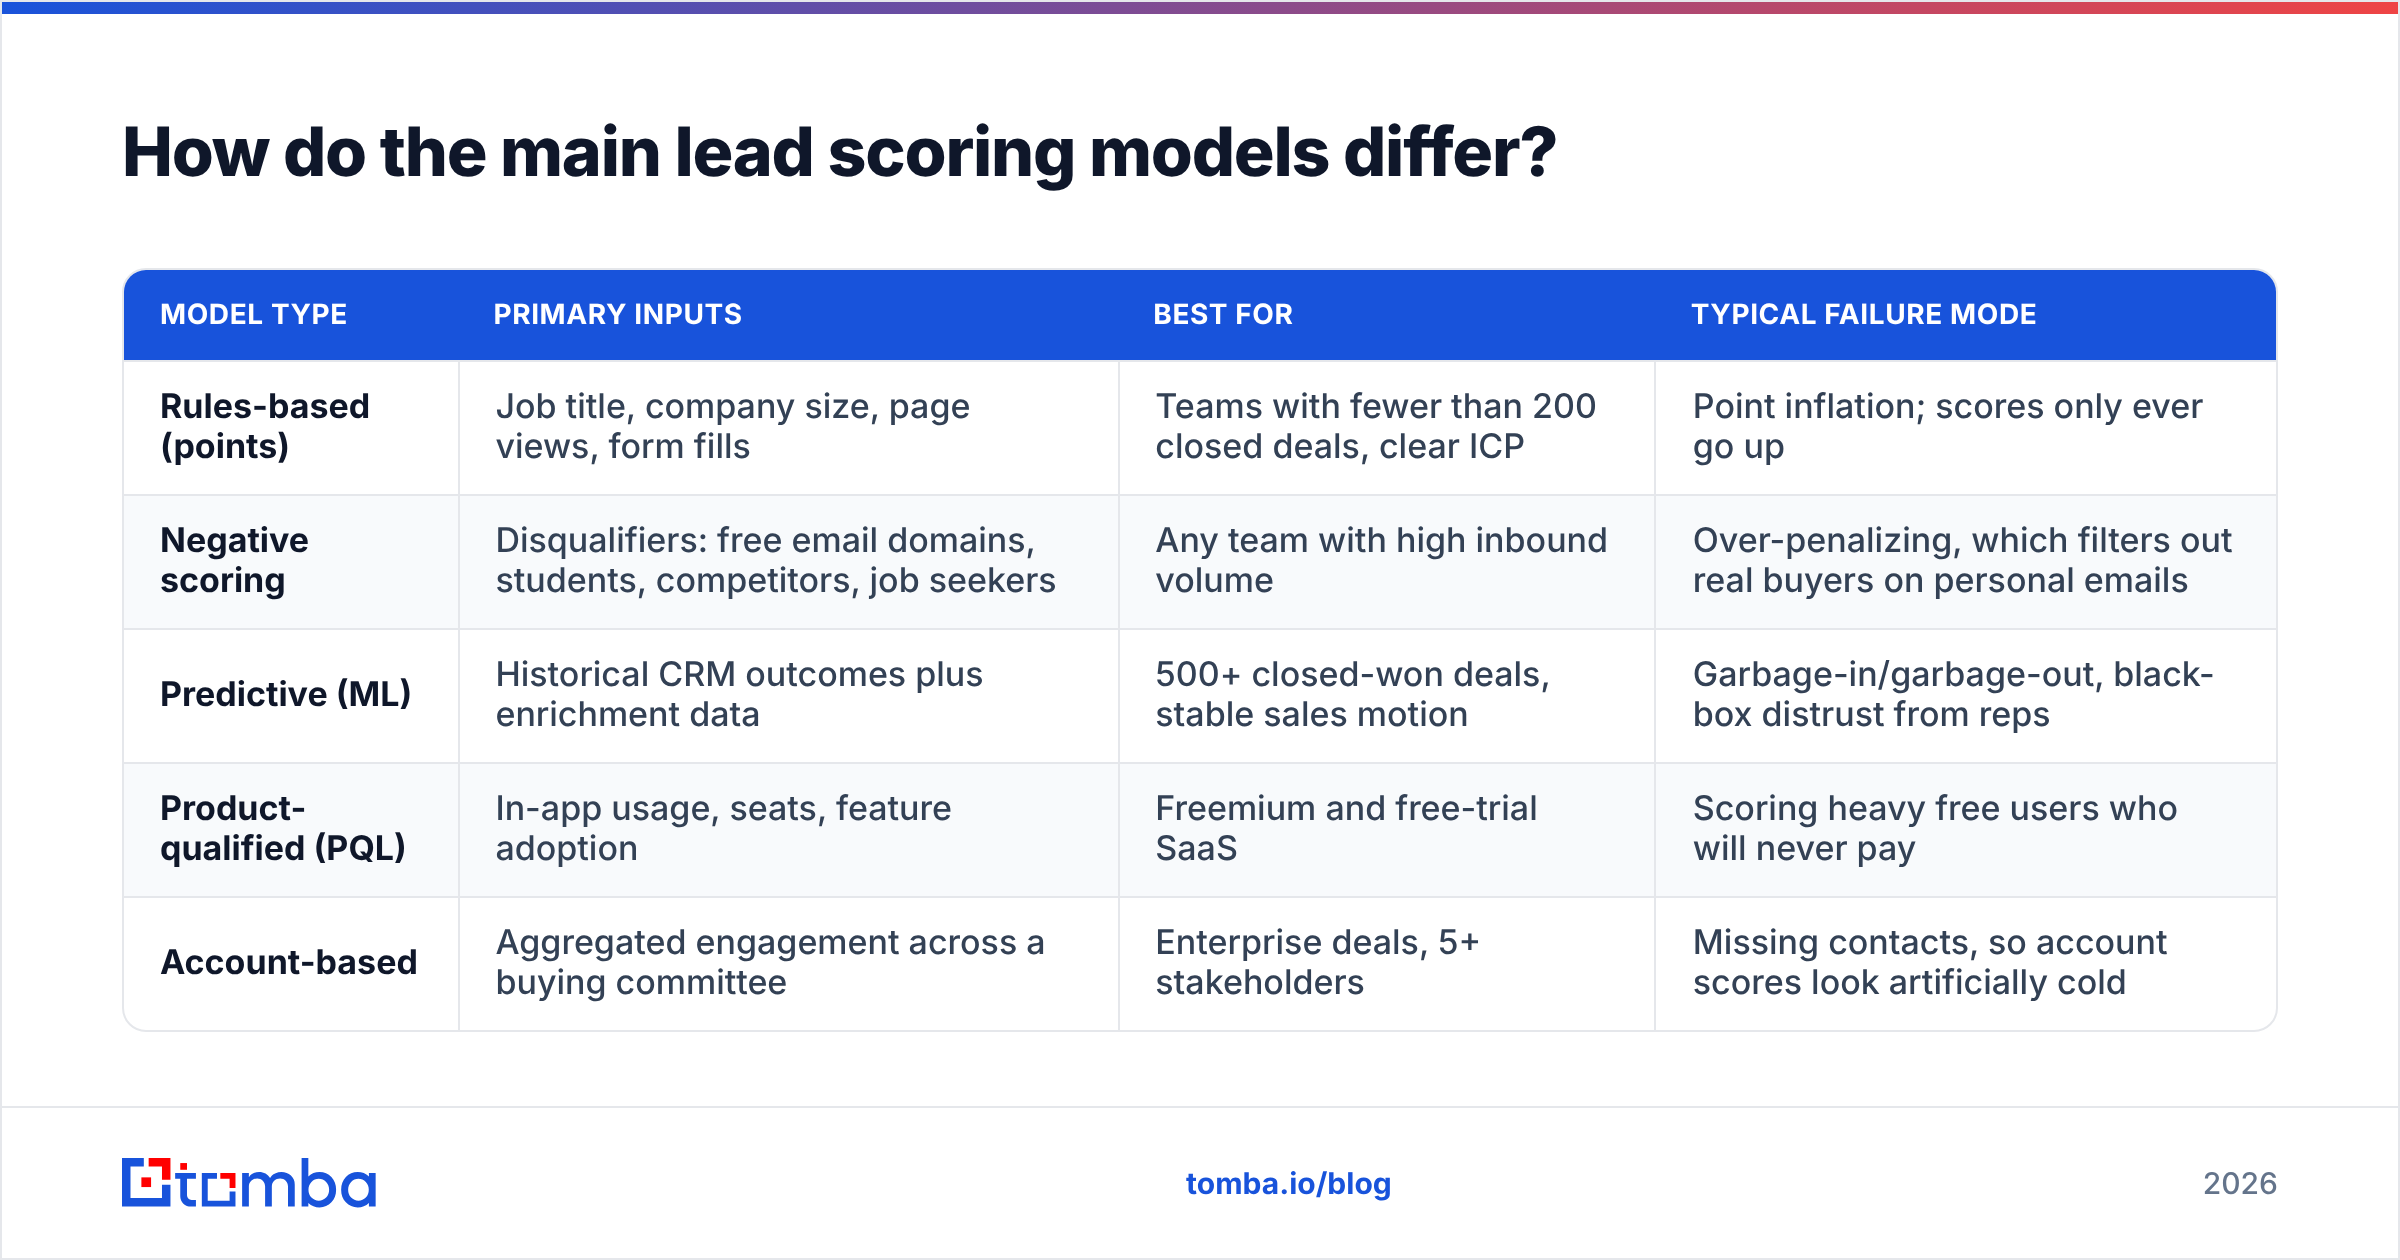
Before the cases, here's a map of the approaches they use. Most teams run a hybrid in the end, but it helps to know what each type is good and bad at.
| Model type | Primary inputs | Best for | Typical failure mode |
|---|---|---|---|
| Rules-based (points) | Job title, company size, page views, form fills | Teams with fewer than 200 closed deals, clear ICP | Point inflation; scores only ever go up |
| Negative scoring | Disqualifiers: free email domains, students, competitors, job seekers | Any team with high inbound volume | Over-penalizing, which filters out real buyers on personal emails |
| Predictive (ML) | Historical CRM outcomes plus enrichment data | 500+ closed-won deals, stable sales motion | Garbage-in/garbage-out, black-box distrust from reps |
| Product-qualified (PQL) | In-app usage, seats, feature adoption | Freemium and free-trial SaaS | Scoring heavy free users who will never pay |
| Account-based | Aggregated engagement across a buying committee | Enterprise deals, 5+ stakeholders | Missing contacts, so account scores look artificially cold |
Every row has the same weak point: the model can only score the contact data you actually have. Keep that in mind as you read.
Case study 1: Why did a SaaS team's MQL volume triple while pipeline stayed flat?#
Context. A mid-market HR software company ran a points-based model inside its marketing automation platform. Content downloads earned 10 points each, webinar attendance earned 15, and anyone above 50 became an MQL.
Problem. A new content program tripled MQL volume in one quarter. SQL conversion fell from roughly 1 in 4 to about 1 in 12, and pipeline did not move. Reps started calling the MQL queue "the spam folder."
Diagnosis. Scores never went down. If someone downloaded five ebooks over 18 months, they crossed the threshold with no sign of current buying intent. Engagement points outweighed fit points, so a student researching HR trends could outscore a VP of People who had visited the pricing page once.
Fix.
- Split the score into two axes: fit (0–50) and engagement (0–50). An MQL now needs a minimum on both.
- Added score decay: engagement points lose 25% of their value every 30 days without activity.
- Weighted high-intent pages (pricing, integrations, security docs) at three times the weight of top-of-funnel content.
Result. MQL volume fell by about half. SQL conversion recovered to roughly its original rate within two quarters, and reps started working the queue again.
Lesson. If your scores can only go up, you aren't measuring intent. You're measuring how long someone has been in your database.
Case study 2: How did negative scoring rescue a fintech's inbound funnel?#
Context. A B2B payments startup got heavy inbound from a well-ranked blog. A large share of form fills came from people who would never buy.
Problem. SDRs spent the first hour of each day disqualifying students, freelancers, job seekers, and at least a few competitors doing research. The model had no way to subtract points.
Fix. The team added a negative-scoring layer:
- -30 for free webmail domains on a "request demo" form. They chose not to penalize newsletter signups, because some real buyers use personal addresses there.
- -50 for known competitor domains
- -40 for job titles containing "student," "intern," or "candidate"
- -20 for visits concentrated on the careers page
Enrichment ran on form submission to fill in company size and industry. That meant fit scores no longer depended on prospects typing them in honestly.
Result. SDR disqualification time dropped sharply, and the demo-to-opportunity rate went up because the queue contained people who could actually buy.
Lesson. A negative score is the cheapest improvement you can make to a model. Most teams skip it because adding points feels like growth and subtracting them feels like loss.
Case study 3: Why did a "hot" lead list produce a 20% bounce rate?#
Context. An IT services firm built a solid hybrid model and fed its top-scoring leads straight into automated outbound sequences.
Problem. Sequences built for the highest-scoring leads had the worst deliverability in the company. Around one in five emails bounced. The sending domain's reputation dropped, and that dragged down every campaign, not just the scored ones.
Diagnosis. The scoring model gave points to contacts who had been engaged at some point, and many of those contacts had since changed jobs. The model rated a lead as "hot" based on activity from an email address that no longer existed. Nobody was checking whether the address could still receive mail.

Fix.
- Ran every lead above the MQL threshold through an email verifier before it could enter a sequence.
- Invalid addresses triggered a re-find workflow: take the person's name and new company domain and look up their current work email.
- Added a fit-score penalty for contacts with no verified email in the last 90 days.
Result. Bounce rate fell below 2%. Sender reputation recovered over several weeks. Part of the old "hot lead" list turned out to be champions at new companies, and those became warm outbound targets.
Lesson. A lead score describes a person, but you send the email to an address. If the address is dead, the score is worthless. Verification belongs in the scoring pipeline, not after it. For more on why this matters beyond one campaign, see how email deliverability compounds across a domain.
Case study 4: When did predictive scoring actually beat the rules model?#
Context. A marketing analytics vendor with roughly 900 closed-won deals over four years switched from a rules model to a predictive model built into its CRM.
Problem, round one. The first predictive model did worse than the old rules. When the team looked into it, they found that about a third of historical opportunities had empty industry and employee-count fields. The model learned that "unknown industry" predicted winning, because a batch of large deals had been imported without enrichment.
Fix.
- Backfilled firmographics on historical accounts with a data enrichment pass before retraining
- Removed features that leak the outcome, such as "had a second meeting," because they only get filled in after a deal is already progressing
- Ran the old and new models side by side for one quarter, with reps shown both scores
Result, round two. The retrained model ranked leads noticeably better than the rules model, especially in the middle band where rules models struggle. Reps trusted it because they had watched it win in the side-by-side test instead of being told to believe it.
Lesson. Predictive scoring is worth it when you have volume and clean history. Most CRM vendors, Salesforce included, need a meaningful base of historical outcomes before their predictive features become reliable. Below that, a well-tuned rules model is easier to explain and usually just as accurate.
Case study 5: How did a freemium product score users instead of form fills?#
Context. A collaboration tool with a generous free tier had tens of thousands of signups a month and a small sales team.
Problem. Marketing-style scoring (page views, email opens) meant nothing here, because everyone was already inside the product. The question was which free workspaces would turn into paid team plans.
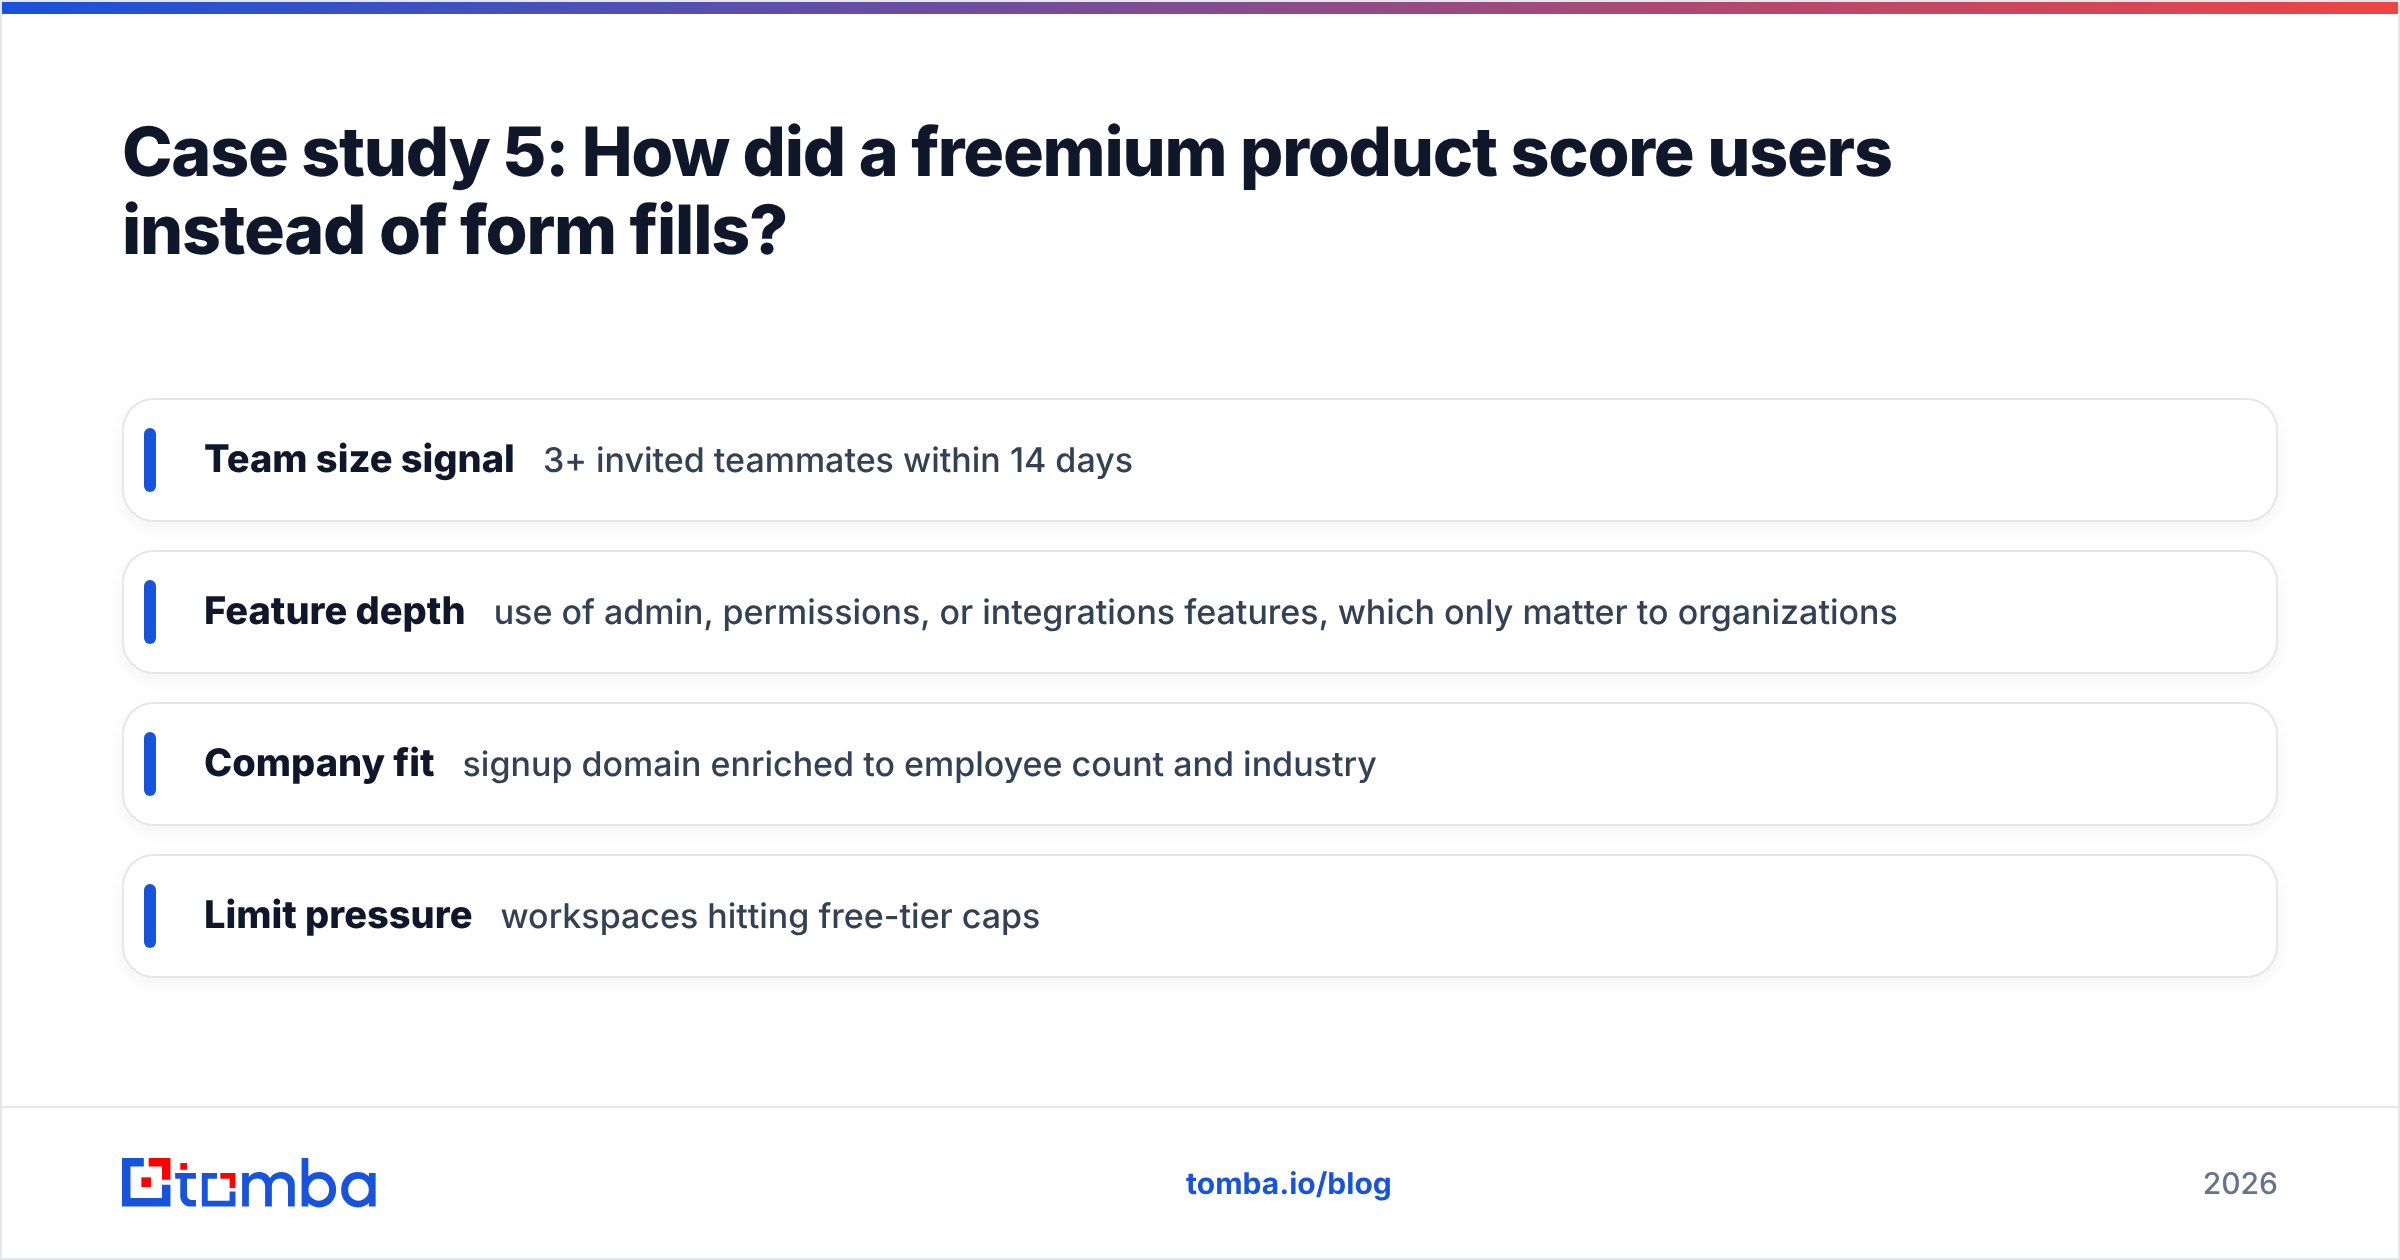
Fix. The team built a product-qualified lead (PQL) score from:
- Team size signal: 3+ invited teammates within 14 days
- Feature depth: use of admin, permissions, or integrations features, which only matter to organizations
- Company fit: signup domain enriched to employee count and industry
- Limit pressure: workspaces hitting free-tier caps
Personal-domain signups were not thrown out. Instead, the team tried to connect them to a company through domain and name matching. Some of the highest-value workspaces had been started by one engineer on a personal Gmail.
Result. Sales focused on a few hundred workspaces a month instead of tens of thousands. The sales-assisted conversion rate on those workspaces was many times higher than the self-serve baseline.
Lesson. For PLG, what people do in the product matters more than what they read. But you still need to know which company a user belongs to, or you can't tell whether an active user is inside a 5-person startup or a 5,000-person enterprise.
Case study 6: Why did account-based scoring show target accounts as "cold"?#
Context. An enterprise security vendor switched to account-level scoring. It aggregated engagement across everyone at a target account.
Problem. Several strategic accounts showed near-zero scores even though the team knew they were in active evaluation. Deals were progressing, but the dashboard said nothing was happening.
Diagnosis. The CRM held one or two contacts per account, usually whoever had filled in a form first. The real buying committee (CISO, security architects, procurement, IT ops) wasn't in the system. Their engagement happened, but it couldn't be attributed to anyone.
Fix. For each tier-one account, the team mapped the buying committee by role, found and verified work emails for the missing stakeholders, and tied anonymous site activity back to account domains. Account scores started to reflect reality within a few weeks.
Result. Forecasting got more accurate because account scores tracked real deal stages more closely. Multi-threaded outreach also cut the "single champion left the company" risk that had killed deals before.
Lesson. In ABM, an account score can only be as good as your coverage of that account. You can't score engagement from people you haven't identified.
What patterns show up across all six lead scoring case studies?#
Look at the six cases side by side and the same root causes keep showing up. None of them are about the algorithm.
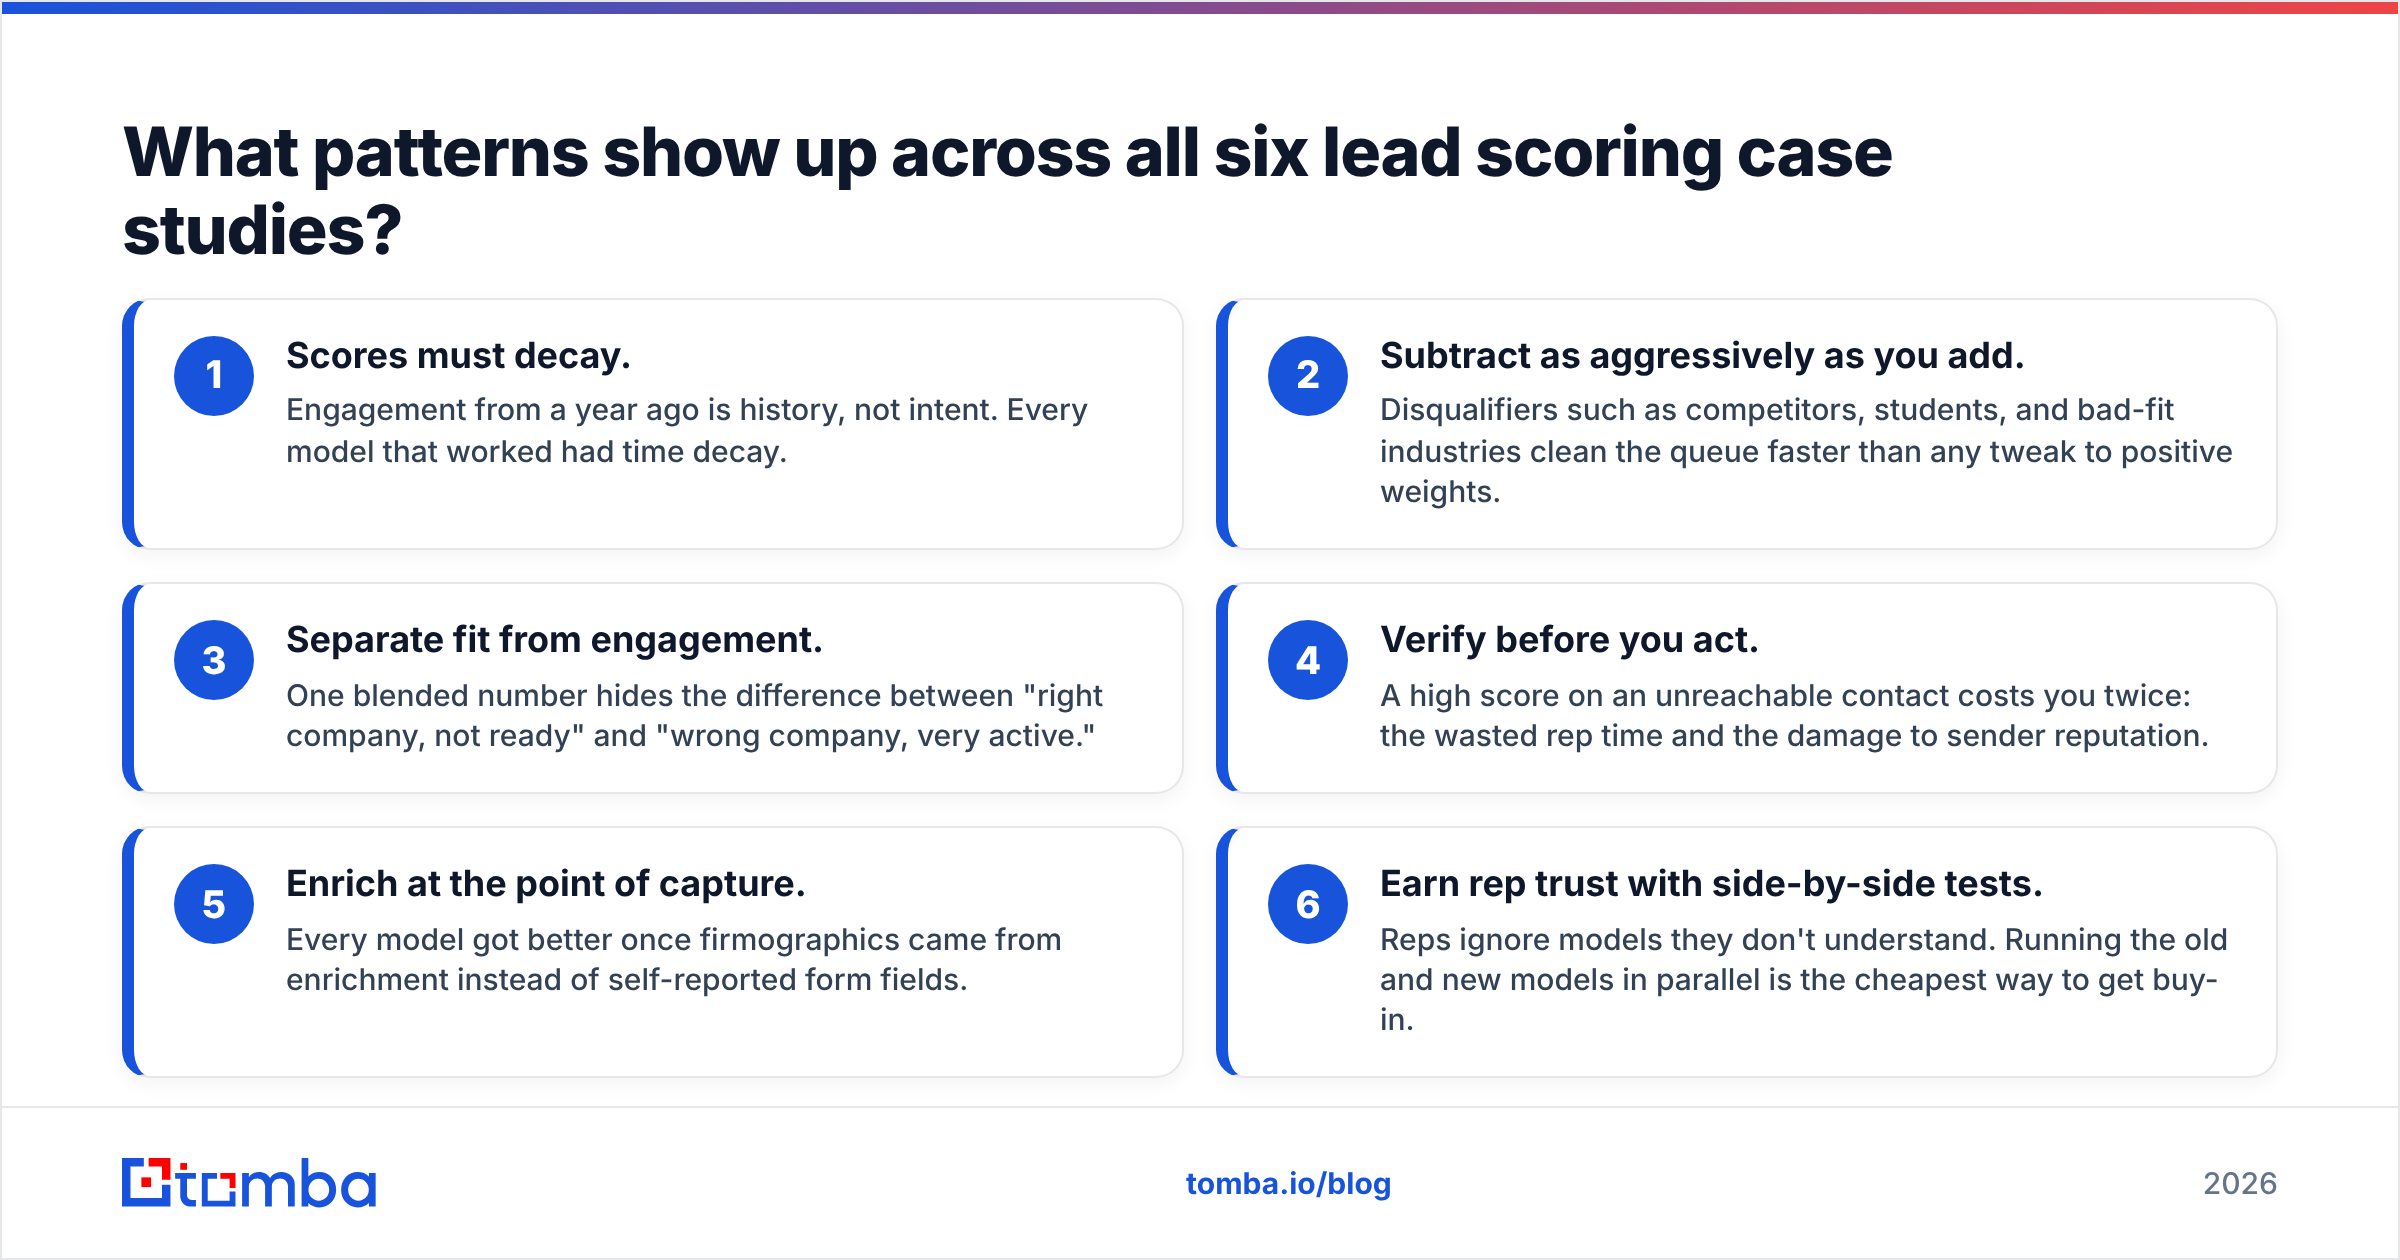
- Scores must decay. Engagement from a year ago is history, not intent. Every model that worked had time decay.
- Subtract as aggressively as you add. Disqualifiers such as competitors, students, and bad-fit industries clean the queue faster than any tweak to positive weights.
- Separate fit from engagement. One blended number hides the difference between "right company, not ready" and "wrong company, very active."
- Verify before you act. A high score on an unreachable contact costs you twice: the wasted rep time and the damage to sender reputation.
- Enrich at the point of capture. Every model got better once firmographics came from enrichment instead of self-reported form fields.
- Earn rep trust with side-by-side tests. Reps ignore models they don't understand. Running the old and new models in parallel is the cheapest way to get buy-in.

The uncomfortable conclusion is that in at least four of the six cases, the "scoring problem" was really a contact data problem. Gartner has long pointed to data quality as a top obstacle to sales analytics, and lead scoring is where that obstacle shows up first.
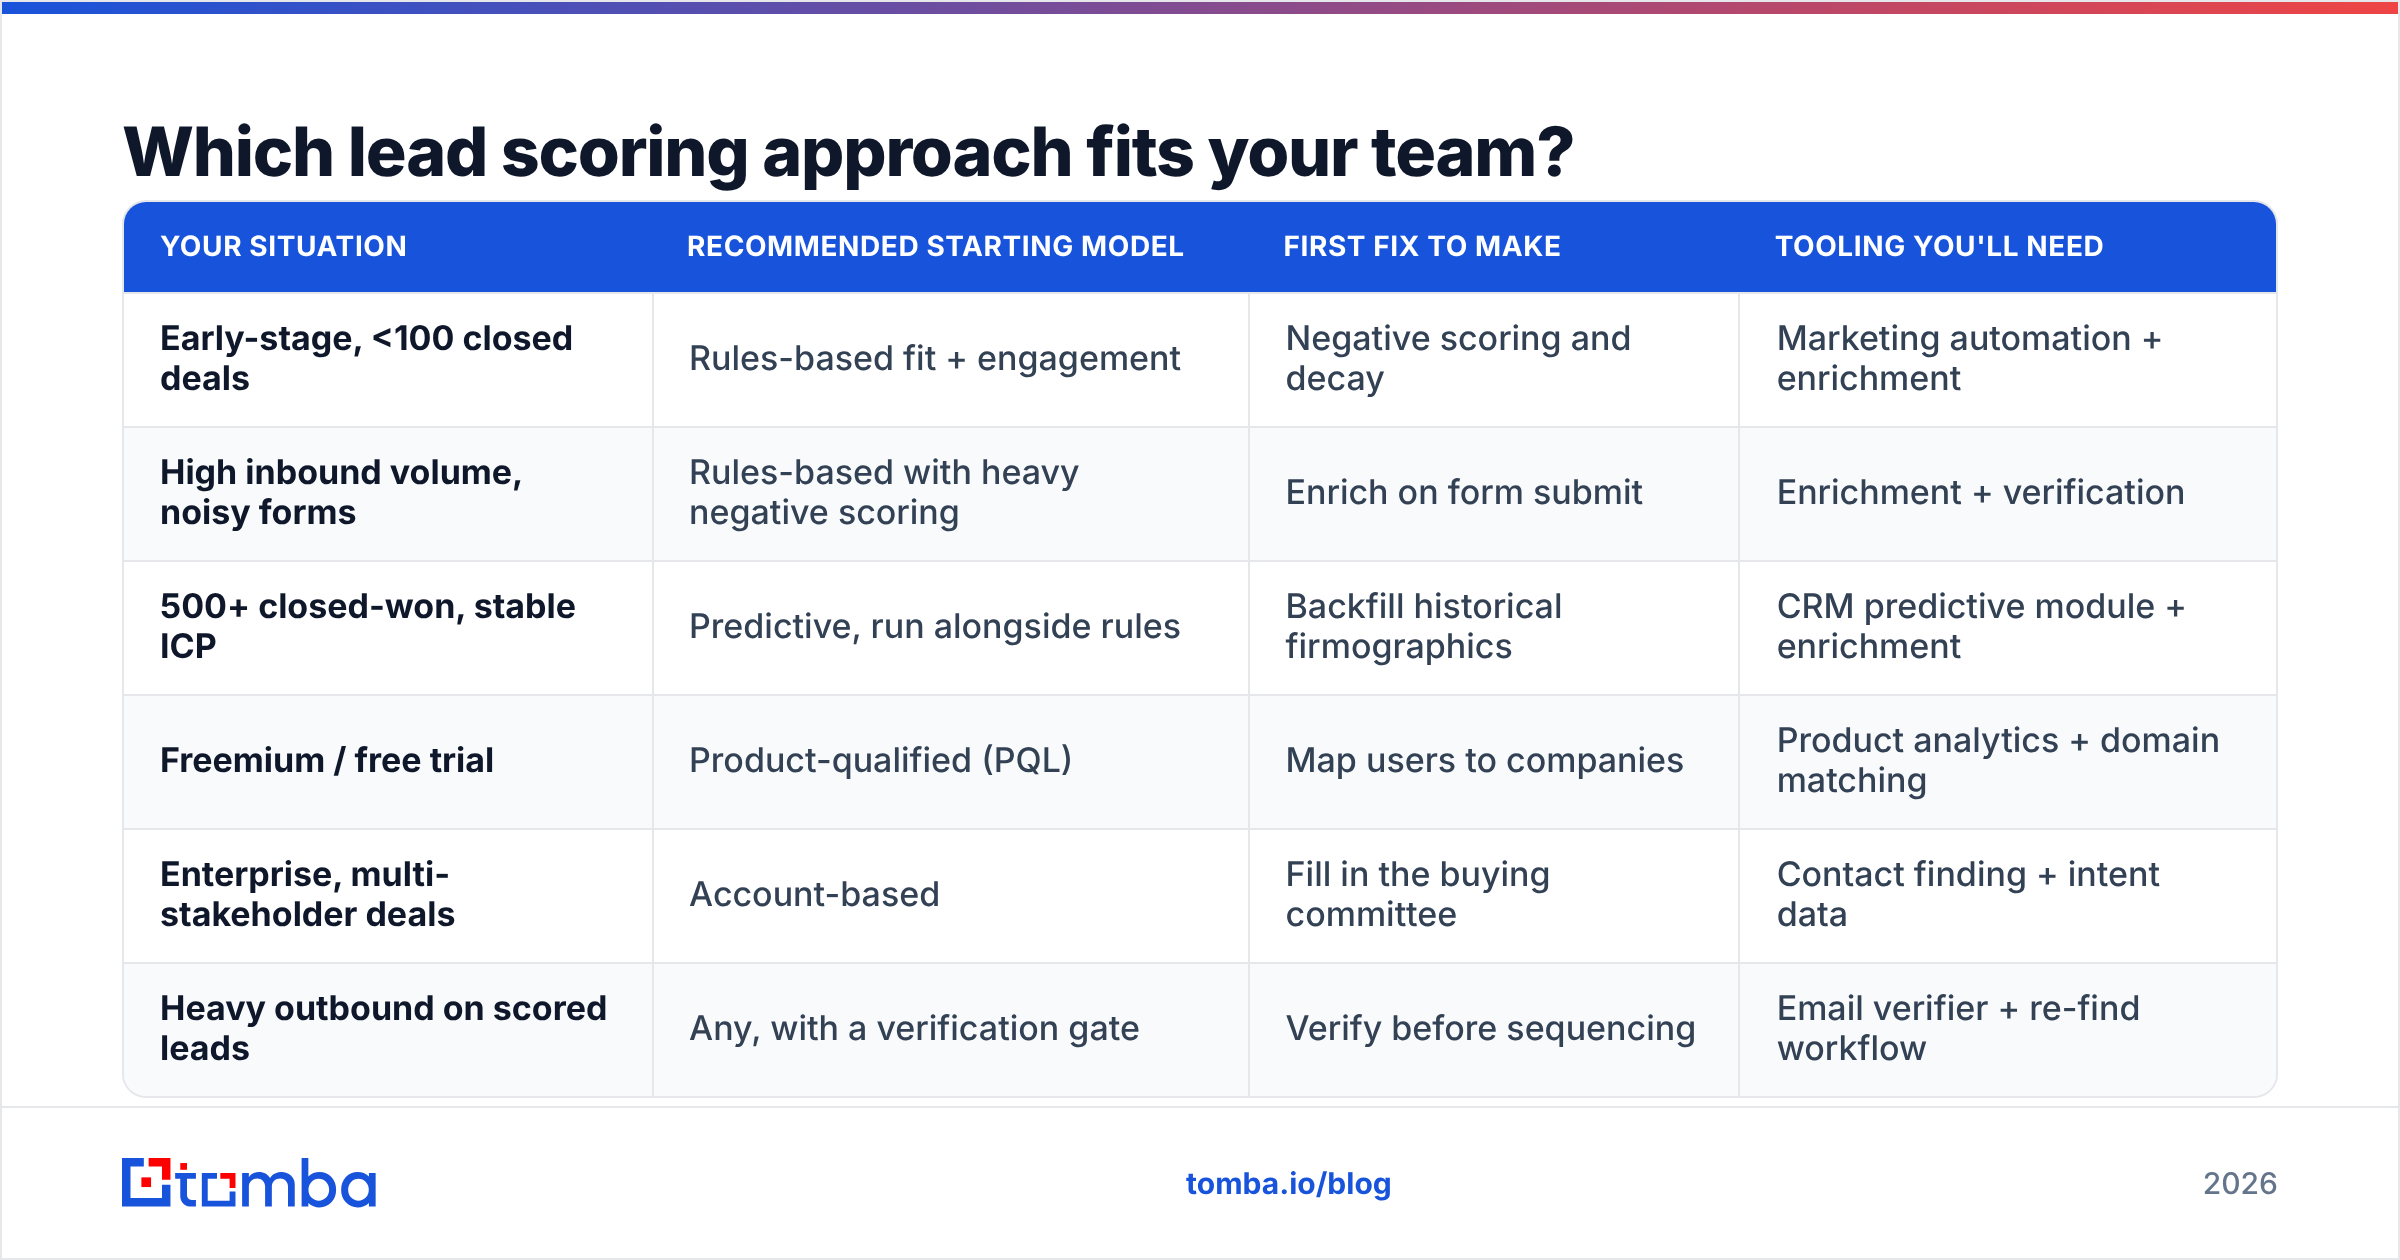
Which lead scoring approach fits your team?#
Use this as a starting point, not a rule:
| Your situation | Recommended starting model | First fix to make | Tooling you'll need |
|---|---|---|---|
| Early-stage, <100 closed deals | Rules-based fit + engagement | Negative scoring and decay | Marketing automation + enrichment |
| High inbound volume, noisy forms | Rules-based with heavy negative scoring | Enrich on form submit | Enrichment + verification |
| 500+ closed-won, stable ICP | Predictive, run alongside rules | Backfill historical firmographics | CRM predictive module + enrichment |
| Freemium / free trial | Product-qualified (PQL) | Map users to companies | Product analytics + domain matching |
| Enterprise, multi-stakeholder deals | Account-based | Fill in the buying committee | Contact finding + intent data |
| Heavy outbound on scored leads | Any, with a verification gate | Verify before sequencing | Email verifier + re-find workflow |
If you're comparing platforms, the G2 lead scoring category is a useful place to check real user reviews on setup effort and how hard the model is to explain. Those two things predict adoption better than feature lists do.
How do you apply these lessons to your own model this quarter?#
You don't need a full rebuild. A four-week plan based on the cases above:
Week 1: Audit inputs. Pull your current MQLs. What share have a verified email? A known company size? A known industry? If more than 20% are missing core fit fields, fix that first.
Week 2: Add subtraction and decay. Set up negative scores for obvious disqualifiers and a 30-day decay on engagement points. This one change usually cuts MQL noise more than anything else.
Week 3: Split the score. Show fit and engagement as separate numbers in the CRM. Define MQL as a minimum on both.
Week 4: Gate outbound with verification. No scored lead enters a sequence without a verified address. When an address fails, route it to a re-find step instead of deleting the lead. A contact who changed jobs is often a warmer lead at their new company.
Then measure one number: MQL-to-SQL conversion rate, month over month. If it rises while MQL volume falls, the model is working.
Frequently asked questions#
What is a good MQL-to-SQL conversion rate? It varies a lot by motion and deal size, so compare against your own trend rather than an industry average. The most useful signal is direction. If volume drops after a model change and conversion rises, you've removed noise.
How often should you recalibrate a lead scoring model? Review weights quarterly, and fully revisit the model whenever your ICP, pricing, or core product changes. Predictive models should be retrained on a set schedule, because deal patterns drift.
Should personal email addresses get a negative score? Only in context. Penalize them on high-intent forms like demo requests if your data shows they rarely convert. Don't penalize them automatically on product signups. As case study 5 showed, valuable accounts are sometimes started from a personal inbox.
Do you need predictive scoring software? Not until you have enough clean historical outcomes to train on. Before that, a rules model with decay, negative scoring, and verified contact data will usually match or beat it, and it's much easier to explain to reps.
Fix the contacts before you tune the scores#
Every case above ends in the same place: a scoring model is only as good as the contacts it scores. If your top leads bounce, if your target accounts are missing half their buying committee, or if the model can't tell which company a signup belongs to, adjusting the point values won't help. Tomba Email Finder lets you find and refresh verified work emails by name, domain, or company. You can re-find champions who changed jobs, fill in buying committees for account-based scoring, and give your model contacts it can actually reach. Start on the free tier, or compare Tomba plans if you're scoring at volume.
Related guides#
// get started
Find, verify and enrich your first contacts today
Start on the free plan with 25 searches a month, then scale when your team is ready.
Free plan · No credit card required · GDPR & CCPA
// about the author