Lead to Close Rate: How to Calculate, Benchmark and Improve It
Your lead to close rate shows how many leads end up as paying customers. Here's how to calculate it correctly, what a realistic benchmark looks like, and seven fixes that raise it without buying more leads.
TL;DR
- Lead to close rate = closed-won deals ÷ total leads in the same cohort × 100. If you divide this month's wins by this month's leads, your sales cycle will distort the number.
- Most B2B teams land somewhere between 1% and 6%, depending on channel. Referrals and inbound demo requests close far better than cold outbound or content downloads.
- A low rate usually points to one of three problems: bad-fit leads, bad contact data, or a slow and leaky handoff between marketing and sales. It rarely means the reps can't sell.
- Before you spend more on leads, fix the data and the handoff. Verified contacts and a response time under an hour are usually the cheapest improvements you can make.
- Track the rate by channel and by cohort. A single blended company-wide number hides where the leak is.
What is lead to close rate?#
Lead to close rate is the share of leads that become paying customers. It is the most complete funnel metric you have, because every stage between "someone raised their hand" and "the contract is signed" feeds into it: qualification, discovery, demo, proposal, negotiation.
Think of it as the batting average for your whole revenue engine. Win rate tells you how reps do once a deal is real. MQL-to-SQL tells you how good marketing's filter is. Lead to close rate is the one number the CFO cares about, because it shows how many of the leads you paid for turned into revenue.
The basic formula:
Lead to close rate = (Closed-won deals from a lead cohort ÷ Total leads in that cohort) × 100
If you generated 800 leads in Q1 and 24 of those specific leads had closed by the end of Q3, your lead to close rate for the Q1 cohort is 3%.
How do you calculate lead to close rate correctly?#
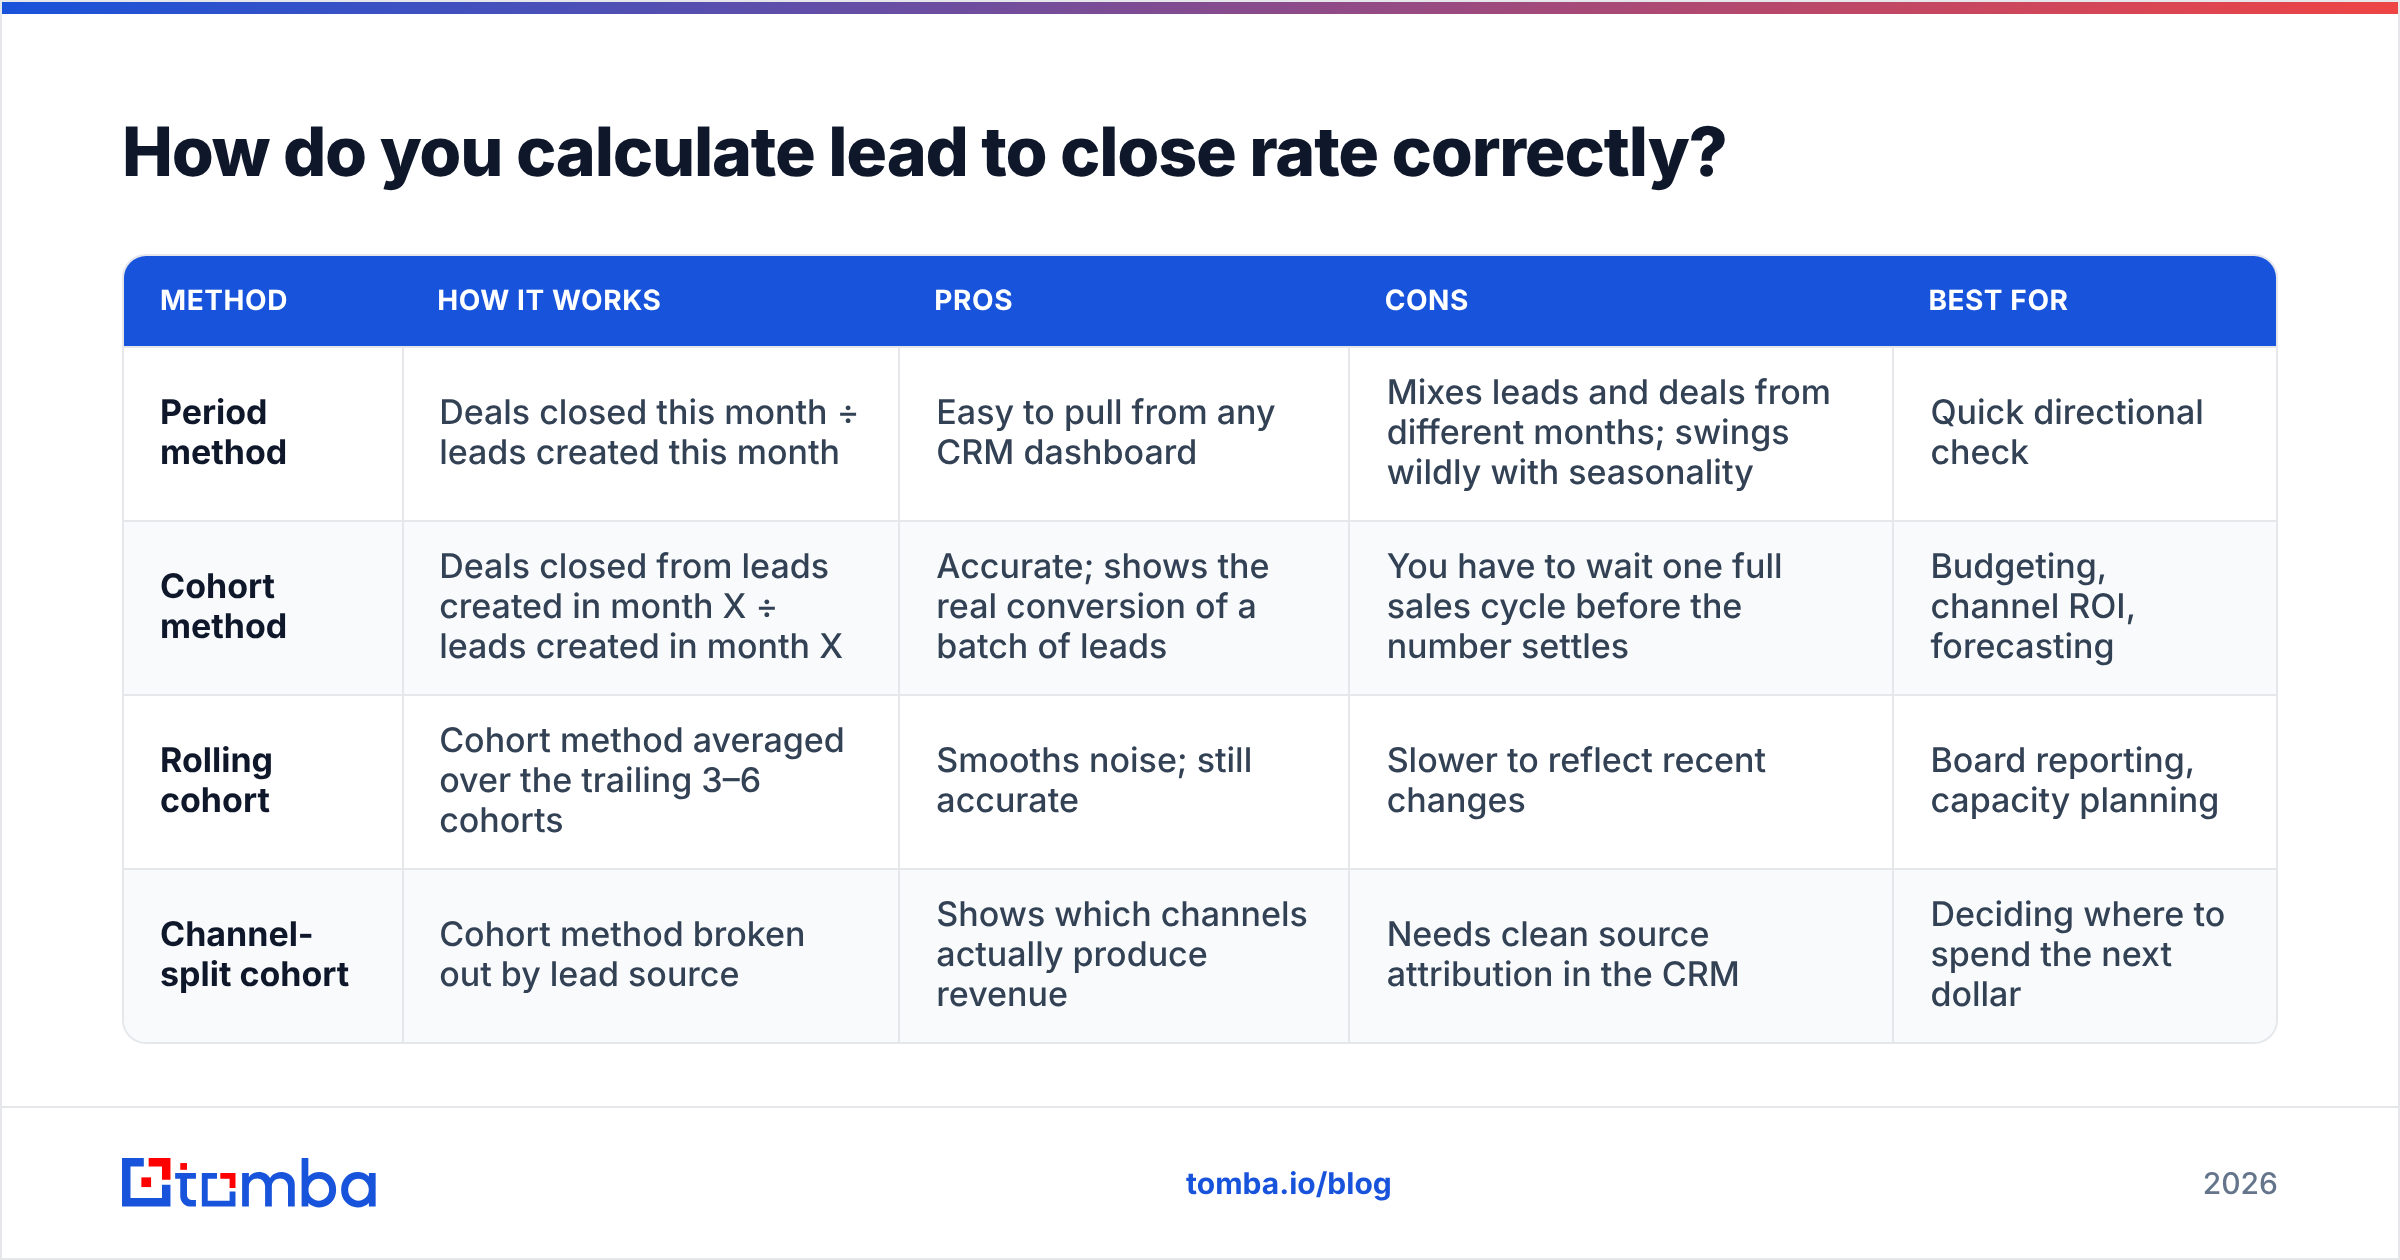
Most teams don't get the formula wrong. They get the time window wrong. There are two ways to measure it, and only one gives you a number you can act on.
| Method | How it works | Pros | Cons | Best for |
|---|---|---|---|---|
| Period method | Deals closed this month ÷ leads created this month | Easy to pull from any CRM dashboard | Mixes leads and deals from different months; swings wildly with seasonality | Quick directional check |
| Cohort method | Deals closed from leads created in month X ÷ leads created in month X | Accurate; shows the real conversion of a batch of leads | You have to wait one full sales cycle before the number settles | Budgeting, channel ROI, forecasting |
| Rolling cohort | Cohort method averaged over the trailing 3–6 cohorts | Smooths noise; still accurate | Slower to reflect recent changes | Board reporting, capacity planning |
| Channel-split cohort | Cohort method broken out by lead source | Shows which channels actually produce revenue | Needs clean source attribution in the CRM | Deciding where to spend the next dollar |
Say your average sales cycle is 90 days. The period method then compares this month's closed deals, which came from leads created three months ago, against this month's leads, which haven't had time to close. If lead volume doubled last month, your "close rate" halves overnight even though nothing got worse.
Use the cohort method. In HubSpot's CRM or Salesforce, that means filtering deals by the associated contact's create date, not by the deal's close date. Most platforms support this with a custom report, but it's rarely the default dashboard.
Three rules that keep the number honest:
- Define "lead" once and stick to it. If a newsletter subscriber counts as a lead in January and doesn't in February, the trend line is meaningless.
- Deduplicate before counting. A contact who downloads three ebooks should be one lead, not three.
- Only count closed-won deals. Leave out deals that are still open, and don't count renewals of accounts that were already customers.
What is a good lead to close rate in B2B?#
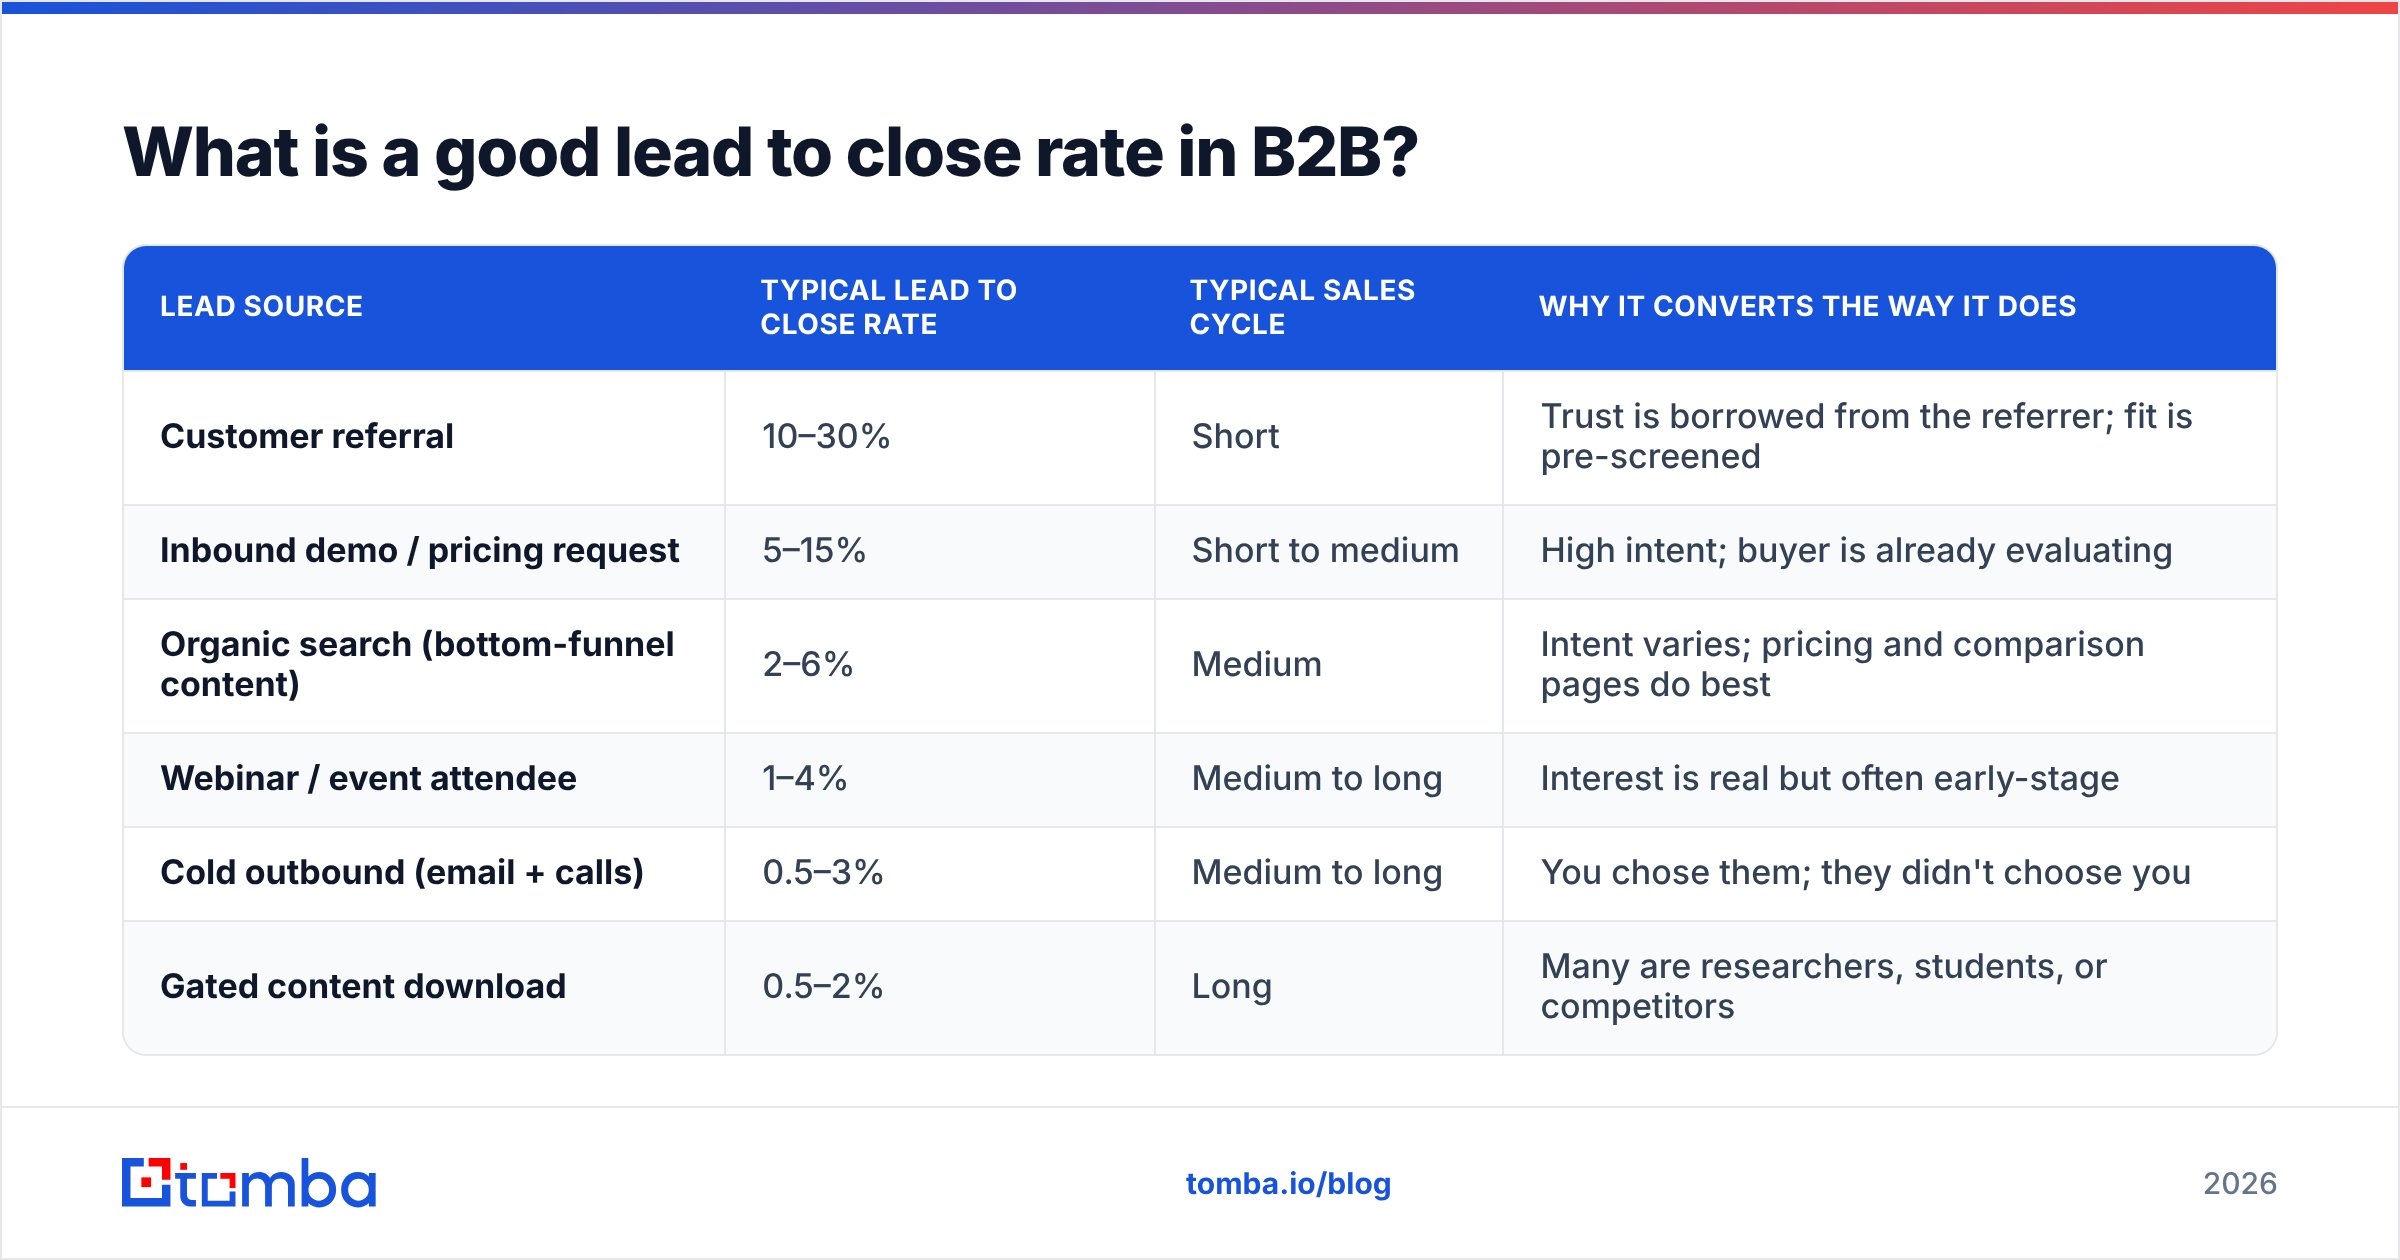
There's no single good number. It depends on your deal size, sales motion and, above all, where the lead came from. Published benchmarks vary a lot because every company defines "lead" differently. Treat the ranges below as orientation, not targets.
| Lead source | Typical lead to close rate | Typical sales cycle | Why it converts the way it does |
|---|---|---|---|
| Customer referral | 10–30% | Short | Trust is borrowed from the referrer; fit is pre-screened |
| Inbound demo / pricing request | 5–15% | Short to medium | High intent; buyer is already evaluating |
| Organic search (bottom-funnel content) | 2–6% | Medium | Intent varies; pricing and comparison pages do best |
| Webinar / event attendee | 1–4% | Medium to long | Interest is real but often early-stage |
| Cold outbound (email + calls) | 0.5–3% | Medium to long | You chose them; they didn't choose you |
| Gated content download | 0.5–2% | Long | Many are researchers, students, or competitors |
Two patterns hold almost everywhere:
- Deal size and close rate move in opposite directions. A $500/month self-serve tool can close 5%+ of trial leads. A $150k enterprise platform may close under 1% of all leads and still be very profitable.
- The blended average misleads. Say 70% of your leads come from content downloads that close at 1% and 5% come from referrals that close at 20%. The blended rate will look mediocre, and it hides the fact that one channel is a gold mine and another is noise.
If you want a trustworthy benchmark, the best one is your own trailing 6-cohort average, split by channel. Beat that.
How is lead to close rate different from win rate and other funnel metrics?#
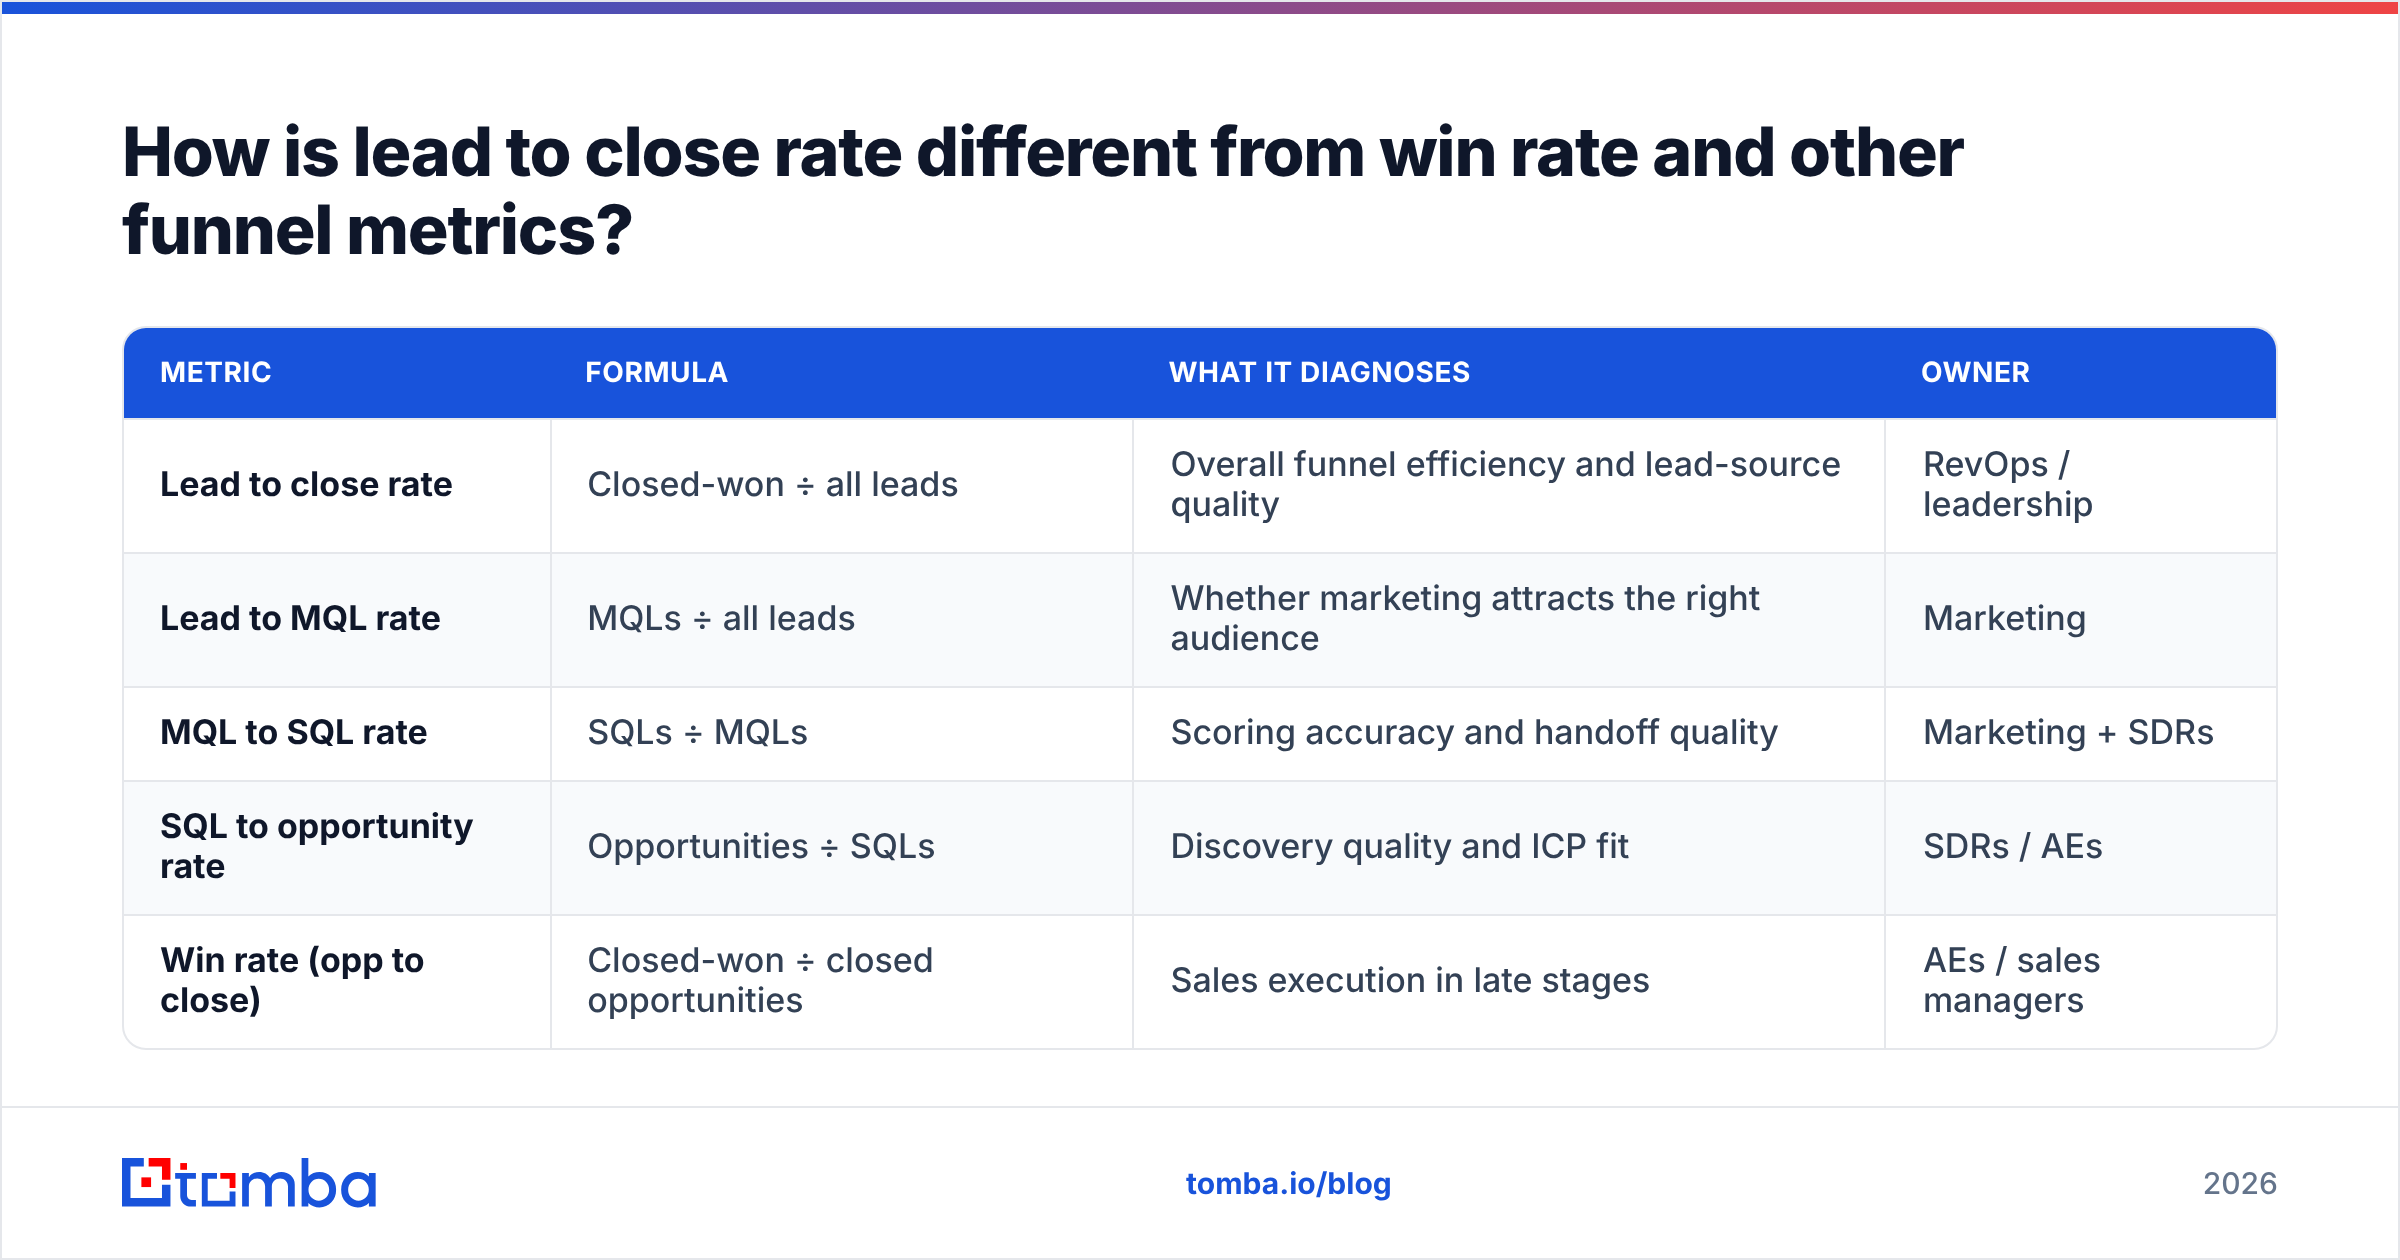
These metrics get used interchangeably in pipeline reviews, and that causes a lot of confused decisions. Each one measures a different slice of the funnel.
| Metric | Formula | What it diagnoses | Owner |
|---|---|---|---|
| Lead to close rate | Closed-won ÷ all leads | Overall funnel efficiency and lead-source quality | RevOps / leadership |
| Lead to MQL rate | MQLs ÷ all leads | Whether marketing attracts the right audience | Marketing |
| MQL to SQL rate | SQLs ÷ MQLs | Scoring accuracy and handoff quality | Marketing + SDRs |
| SQL to opportunity rate | Opportunities ÷ SQLs | Discovery quality and ICP fit | SDRs / AEs |
| Win rate (opp to close) | Closed-won ÷ closed opportunities | Sales execution in late stages | AEs / sales managers |
If your sales win rate is healthy at 25–30% but lead to close rate is under 1%, the problem is upstream. Deals are being lost before they ever reach an AE. If win rate is low but earlier stages convert well, the problem is in discovery, demos, pricing or competitive positioning.
Knowing where your marketing qualified lead threshold sits matters here too. A loose MQL definition inflates the top of the funnel and pushes lead to close rate down without anyone getting worse at their job. For a broader view of how these stage conversions fit together, the Wikipedia overview of conversion marketing is a decent primer on the vocabulary.
Why is your lead to close rate low?#
Most low close rates come down to a small set of root causes. Before you rework the sales playbook, check each one:
- Bad-fit leads. The ICP is fuzzy, so marketing optimizes for volume and sales wastes cycles on companies that were never going to buy.
- Bad contact data. Emails bounce, phone numbers go to the switchboard, and the "decision-maker" left the company eight months ago. You can't close a lead you can't reach.
- Slow speed-to-lead. An inbound request sits in a queue for a day. By then the buyer has booked demos with two competitors.
- Leaky handoff. Marketing passes the lead with no context, the SDR asks the same qualifying questions the form already answered, and the buyer loses patience.
- Weak follow-up cadence. One email and one call, then the lead is marked "unresponsive." Many deals close after the fifth touch or later.
- No nurture path. Leads that aren't ready now get discarded instead of recycled, so next quarter's buyers get thrown away.
Problems 1, 2 and 3 cause most of the damage in most funnels, and they are also the cheapest to fix.
How can you improve your lead to close rate? (7 fixes)#
1. Tighten the ICP before you touch anything else#
Pull your last 50 closed-won deals and your last 50 closed-lost deals. Compare company size, industry, tech stack, buyer title and lead source. You'll usually find two or three attributes that separate winners from losers clearly. Put those in your lead scoring and routing rules, and stop letting non-fit leads count toward sales targets.
2. Verify contact data at the point of entry#
Every lead that enters your CRM with a dead email address is a lead your reps can't close. Your lead to close rate is capped by how many leads you can actually reach. Run new leads through an email verifier before they're routed, and re-verify older records before any outbound push. It's a small cost per contact, and it removes a whole category of "unresponsive" leads that were never reachable in the first place.
3. Fill in the missing decision-maker#
Inbound leads often come from a researcher or junior team member, not the buyer. Instead of waiting for them to escalate internally, use an email finder or domain-level search to identify the actual economic buyer at the same account and run a parallel, account-based track. This multithreading is one of the most reliable ways to lift late-stage conversion, because a deal that relies on one contact stalls when that person goes quiet.
4. Get speed-to-lead under one hour#
Route high-intent leads (demo requests, pricing page submissions) straight to a named rep with an SLA. Automate the first response so it goes out in minutes, with a booking link and not a generic "we'll be in touch." Track time-to-first-touch as a KPI next to close rate. If it goes up, conversion goes down.
5. Hand over context, not just a name#
Every lead that reaches sales should carry its source, pages viewed, content consumed, form answers and firmographic data. Enriched records let the first conversation start at "I saw you compared us to X, what's driving the evaluation?" instead of "So, tell me about your company." That shortens discovery and buyers notice the difference.
6. Build a multi-touch follow-up sequence#
Plan at least 6–8 touches over 2–3 weeks across email, phone and LinkedIn before a lead is marked unresponsive. Vary the angle: a case study, a relevant question, a short video, a direct ask. Track your email response rate at each step so you can cut the touches that never get replies.
7. Recycle, don't discard#
Leads that say "not now" should go into a nurture track with a re-engagement trigger (new funding, new hire in the buying role, repeat visit to the pricing page). Then measure the lead to close rate of recycled leads as its own cohort. In mature funnels, recycled leads often account for a meaningful share of closed-won revenue that would otherwise be written off.
How does data quality affect lead to close rate?#
This deserves its own section because it's the variable teams most often leave out of their funnel math.
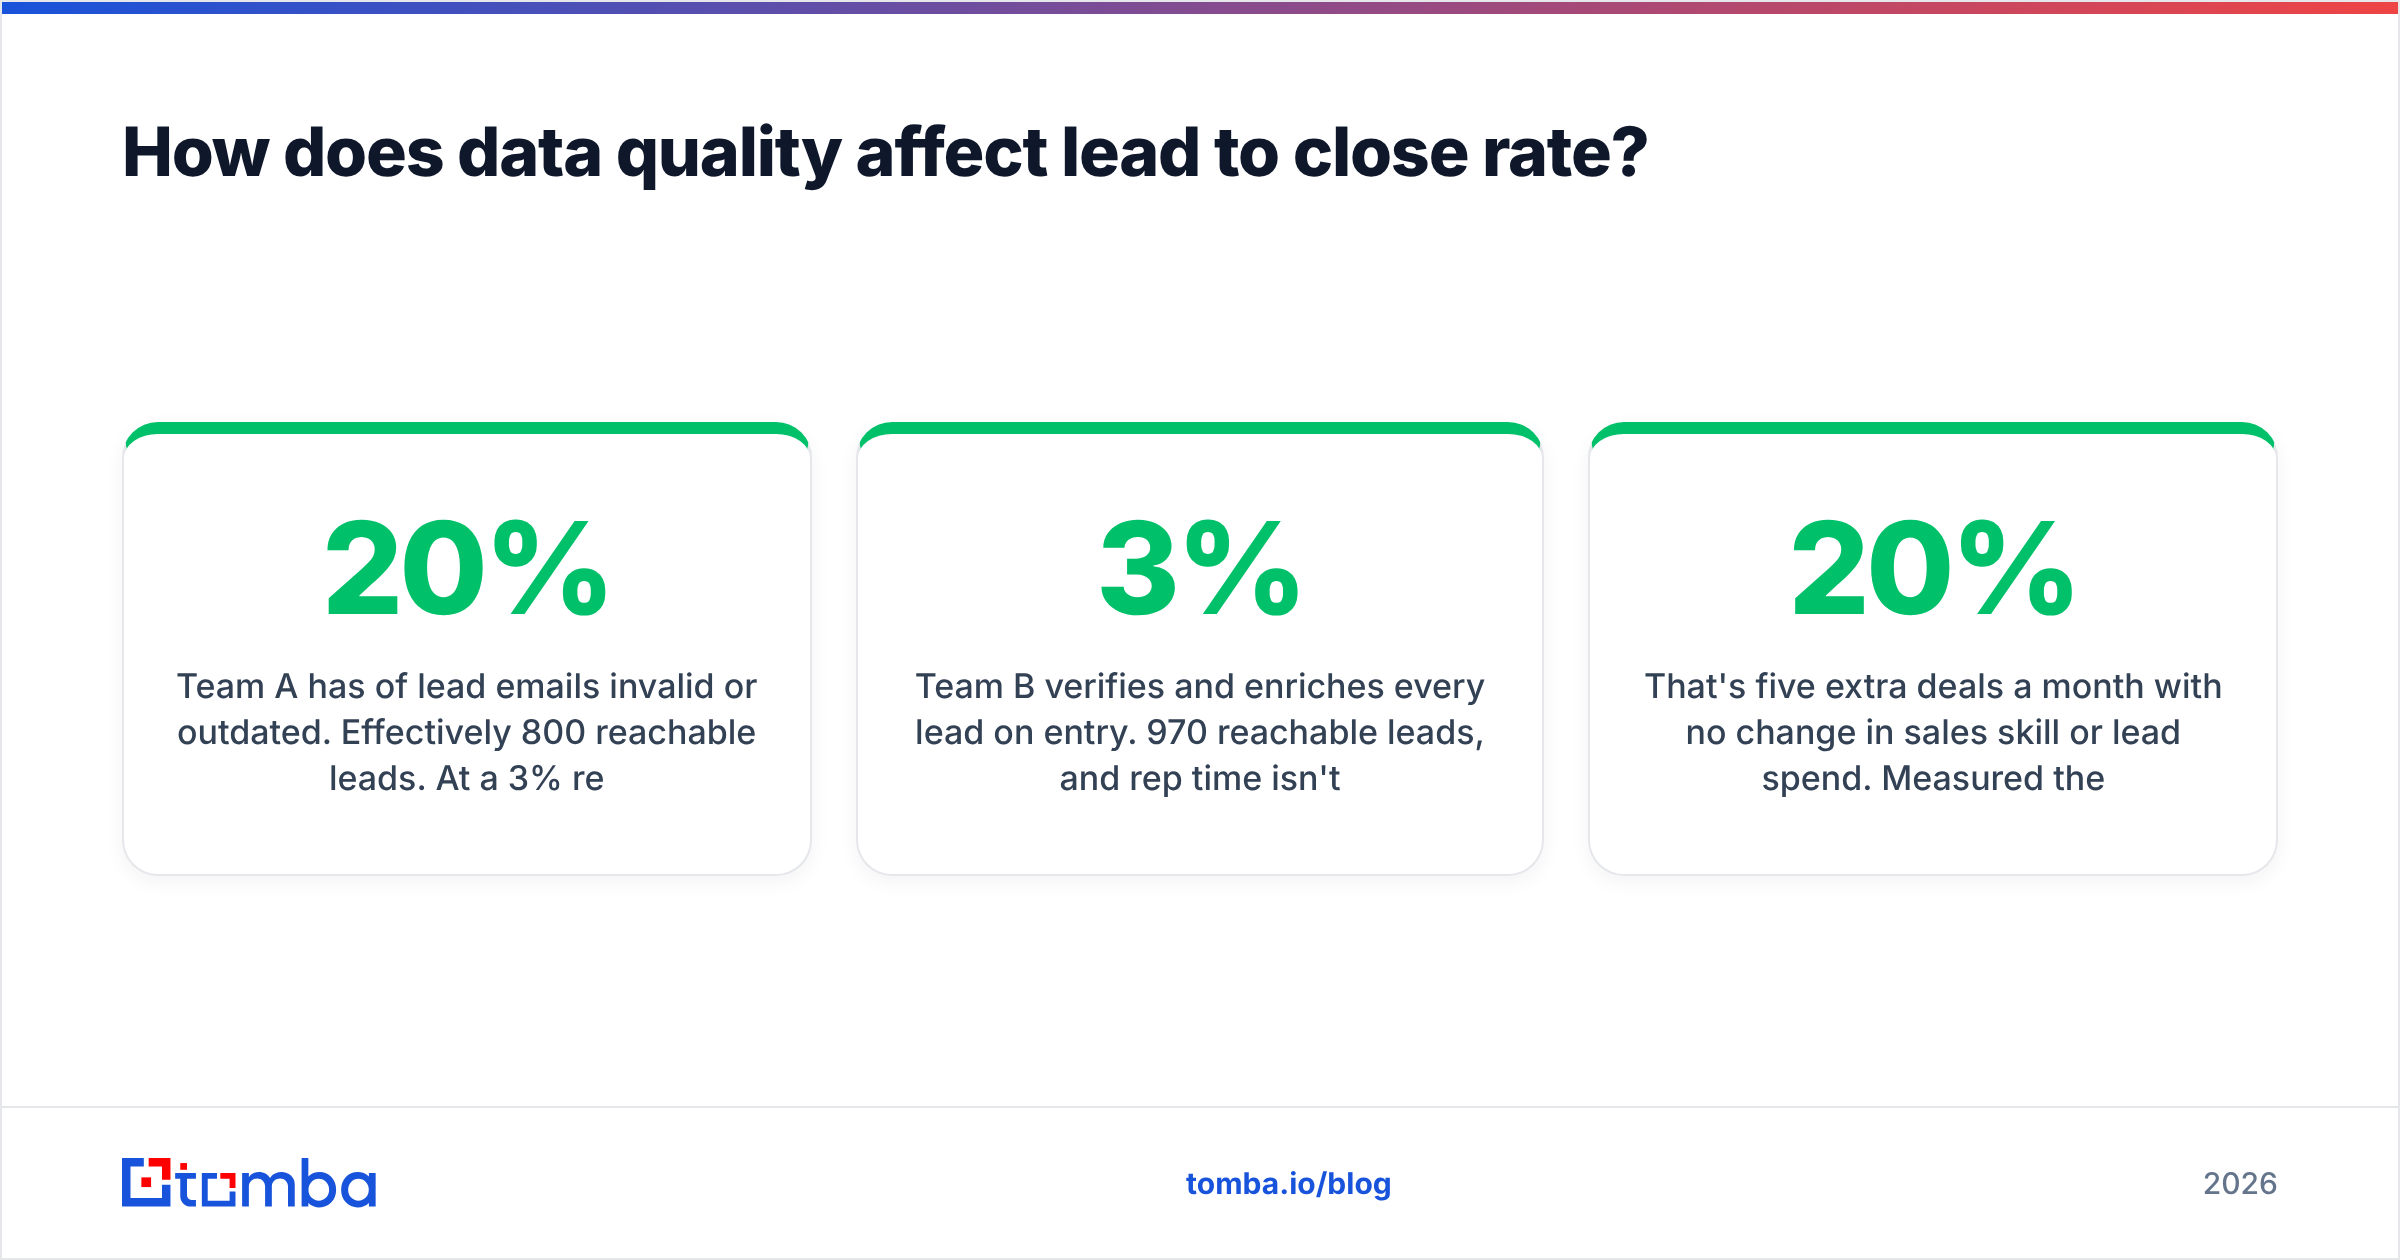
Imagine two teams with identical reps, identical pricing and identical 1,000-lead monthly volume:
- Team A has 20% of lead emails invalid or outdated. Effectively 800 reachable leads. At a 3% reachable-close rate, 24 deals.
- Team B verifies and enriches every lead on entry. 970 reachable leads, and rep time isn't wasted on bounces. Same 3% reachable-close rate: 29 deals.
That's five extra deals a month with no change in sales skill or lead spend. Measured the usual way, Team B's lead to close rate looks roughly 20% better, and the whole difference comes from data. High bounce rates also damage your sending domain's sender reputation, which lowers inbox placement for every future email, including the ones sent to good leads.
This is also why the "just buy more leads" reflex usually backfires. If you pour more unverified contacts into a leaky funnel, lead volume goes up, close rate goes down, and cost per acquisition doesn't improve.
How should you report lead to close rate to leadership?#
Keep the report simple and easy to act on. A good monthly view has:
- Cohort lead to close rate, trailing 6 cohorts, as a line chart. This is the headline trend.
- Split by channel, as a table. This drives budget reallocation.
- Stage-by-stage conversion for the latest mature cohort. This shows where the leak is.
- Time-to-first-touch and data-bounce rate as leading indicators. These move weeks before close rate does.
For outside context on how analyst firms frame funnel and pipeline metrics, Gartner's sales research hub regularly covers pipeline conversion and B2B buying behavior. It's useful when you need to justify a benchmark to a skeptical board.
Avoid reporting one blended number with no channel breakdown. It looks tidy on a slide but gives nobody anything to act on.
What is the fastest win if you only fix one thing?#
For most B2B teams, verifying and enriching lead data at entry pays off fastest. You don't need new headcount or a new playbook, and you don't have to wait a quarter to see if it worked. Reachable leads convert, and unreachable ones don't. Fixing reachability raises the ceiling for every other improvement on this list.
After that, speed-to-lead and multithreading into the real decision-maker are the next biggest levers.
If you're rebuilding your funnel around cleaner, reachable leads, start with Tomba Email Finder. It finds verified professional emails by name, domain or company, so your reps can reach the actual buyer instead of a dead inbox or a gatekeeper. The free tier covers 25 searches a month, which is enough to test it on your next batch of inbound leads, and paid plans start at $49/month. See Tomba pricing to find the plan that fits your lead volume, then compare your next cohort's lead to close rate against the last one.
Related guides#
// get started
Find, verify and enrich your first contacts today
Start on the free plan with 25 searches a month, then scale when your team is ready.
Free plan · No credit card required · GDPR & CCPA
// about the author