Lead to MQL Conversion Rate: Benchmarks, Formula, and Fixes
Your lead to MQL conversion rate says as much about your scoring model and data quality as it does about your marketing. Here are realistic benchmarks by channel, the right formula, and seven fixes that raise the rate.
TL;DR
- Lead to MQL conversion rate is the share of new leads that meet your marketing-qualified criteria within a set time window. B2B teams commonly land somewhere between 15% and 40%, but the spread by channel is much wider than that.
- A "good" rate depends on how strict your MQL definition is. A high rate with a loose definition does more harm than a modest rate with a strict one.
- Look at the rate by source, by cohort, and next to MQL-to-SQL acceptance. The blended number on its own hides most of what matters.
- Most teams gain more from fixing data (missing titles, bad emails, unknown company size) than from rewriting nurture copy.
- Enriching and verifying leads when they come in is usually the cheapest way to raise the rate without lowering the bar.
What is lead to MQL conversion rate?#
Lead to MQL conversion rate measures what share of your raw leads become marketing qualified leads. Raw leads include form fills, webinar registrants, content downloads, event badge scans and imported lists. A marketing qualified lead, or MQL, is a lead that has passed the threshold your marketing and sales teams agreed on. That threshold is usually a mix of fit (right company, right role) and engagement (enough meaningful activity).
Think of a nightclub door. Leads are everyone in the queue, and MQLs are the people the bouncer lets in. The conversion rate tells you how many got through. It doesn't say whether the bouncer is doing a good job. If the door policy is "anyone with shoes," the rate looks great and the club fills with people who never buy anything. If the policy is too strict, the room stays empty.
That is why this metric is both useful and easy to game. It sits between marketing's volume goals and sales' quality goals, and a lot of funnel arguments start there.
How do you calculate lead to MQL conversion rate?#
The basic formula is simple:
Lead to MQL conversion rate = (Leads that became MQLs ÷ Total new leads) × 100
If 1,200 new leads came in during Q2 and 312 of them reached MQL status, your rate is 26%.
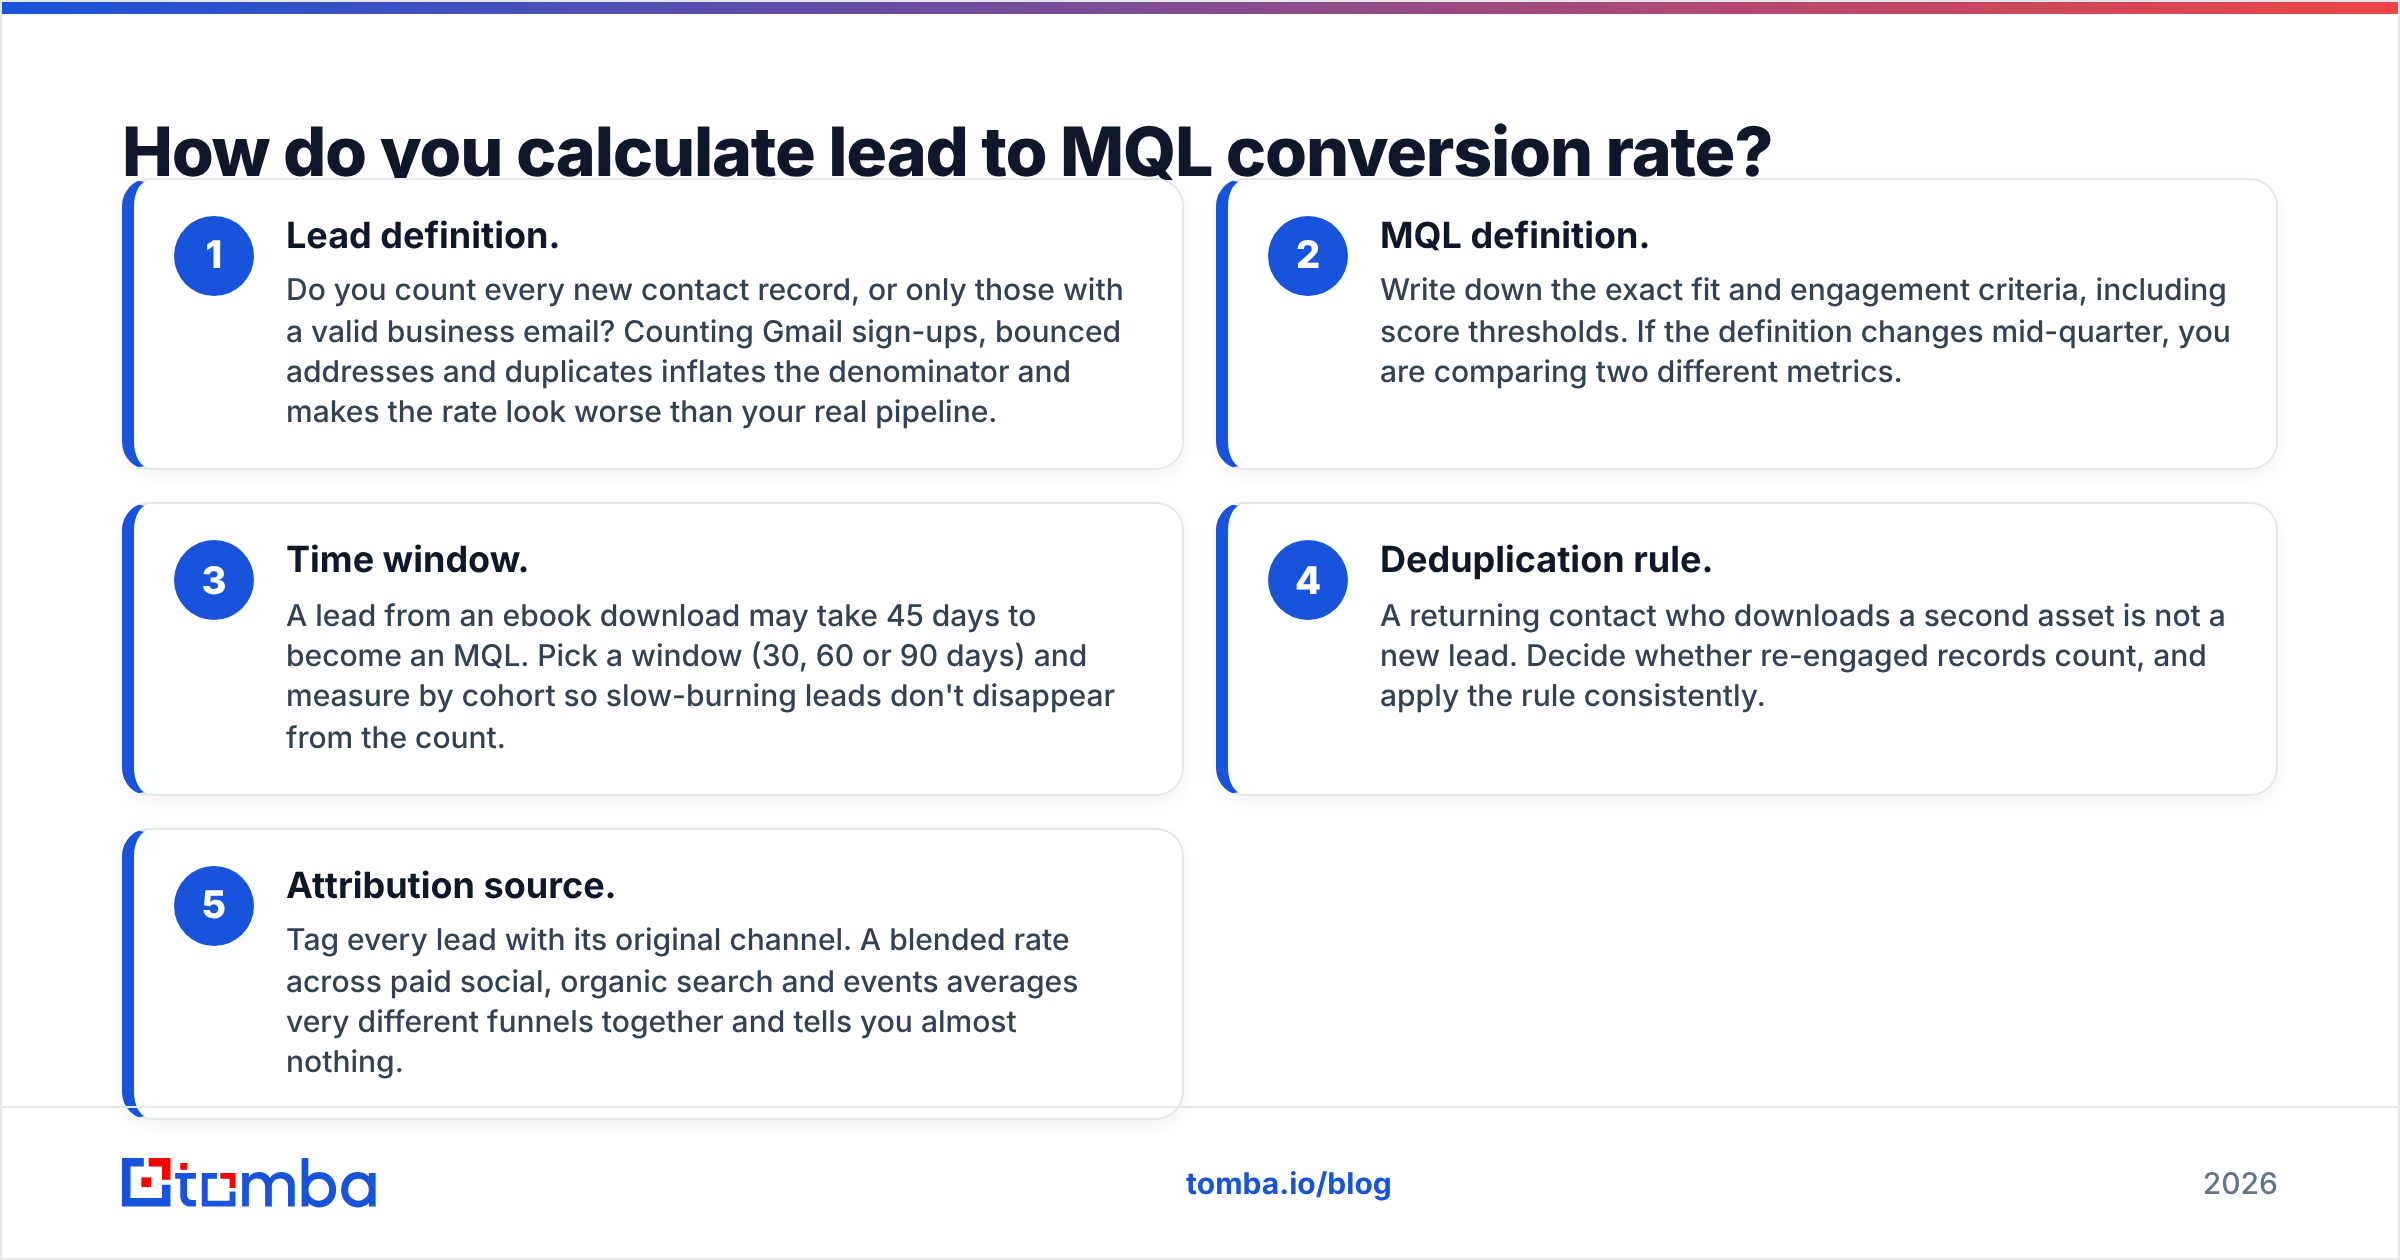
The formula is easy. The inputs are where it goes wrong. Before you trust the number, agree on these five components:
- Lead definition. Do you count every new contact record, or only those with a valid business email? Counting Gmail sign-ups, bounced addresses and duplicates inflates the denominator and makes the rate look worse than your real pipeline.
- MQL definition. Write down the exact fit and engagement criteria, including score thresholds. If the definition changes mid-quarter, you are comparing two different metrics.
- Time window. A lead from an ebook download may take 45 days to become an MQL. Pick a window (30, 60 or 90 days) and measure by cohort so slow-burning leads don't disappear from the count.
- Deduplication rule. A returning contact who downloads a second asset is not a new lead. Decide whether re-engaged records count, and apply the rule consistently.
- Attribution source. Tag every lead with its original channel. A blended rate across paid social, organic search and events averages very different funnels together and tells you almost nothing.
Most CRMs can report this once the fields exist. In HubSpot you would build it on lifecycle stage date properties. In Salesforce it's usually a lead report grouped by source, with a formula field on MQL date. If your CRM doesn't timestamp stage changes, fix that first, because cohort measurement isn't possible without it.
What is a good lead to MQL conversion rate in 2026?#
No single benchmark is correct. Published numbers vary widely because every company defines "lead" and "MQL" differently. The ranges below are directional. They reflect patterns commonly reported in B2B benchmark studies and practitioner data, not a single authoritative source. Use them to check whether you're in a reasonable range, not as a target to hit.
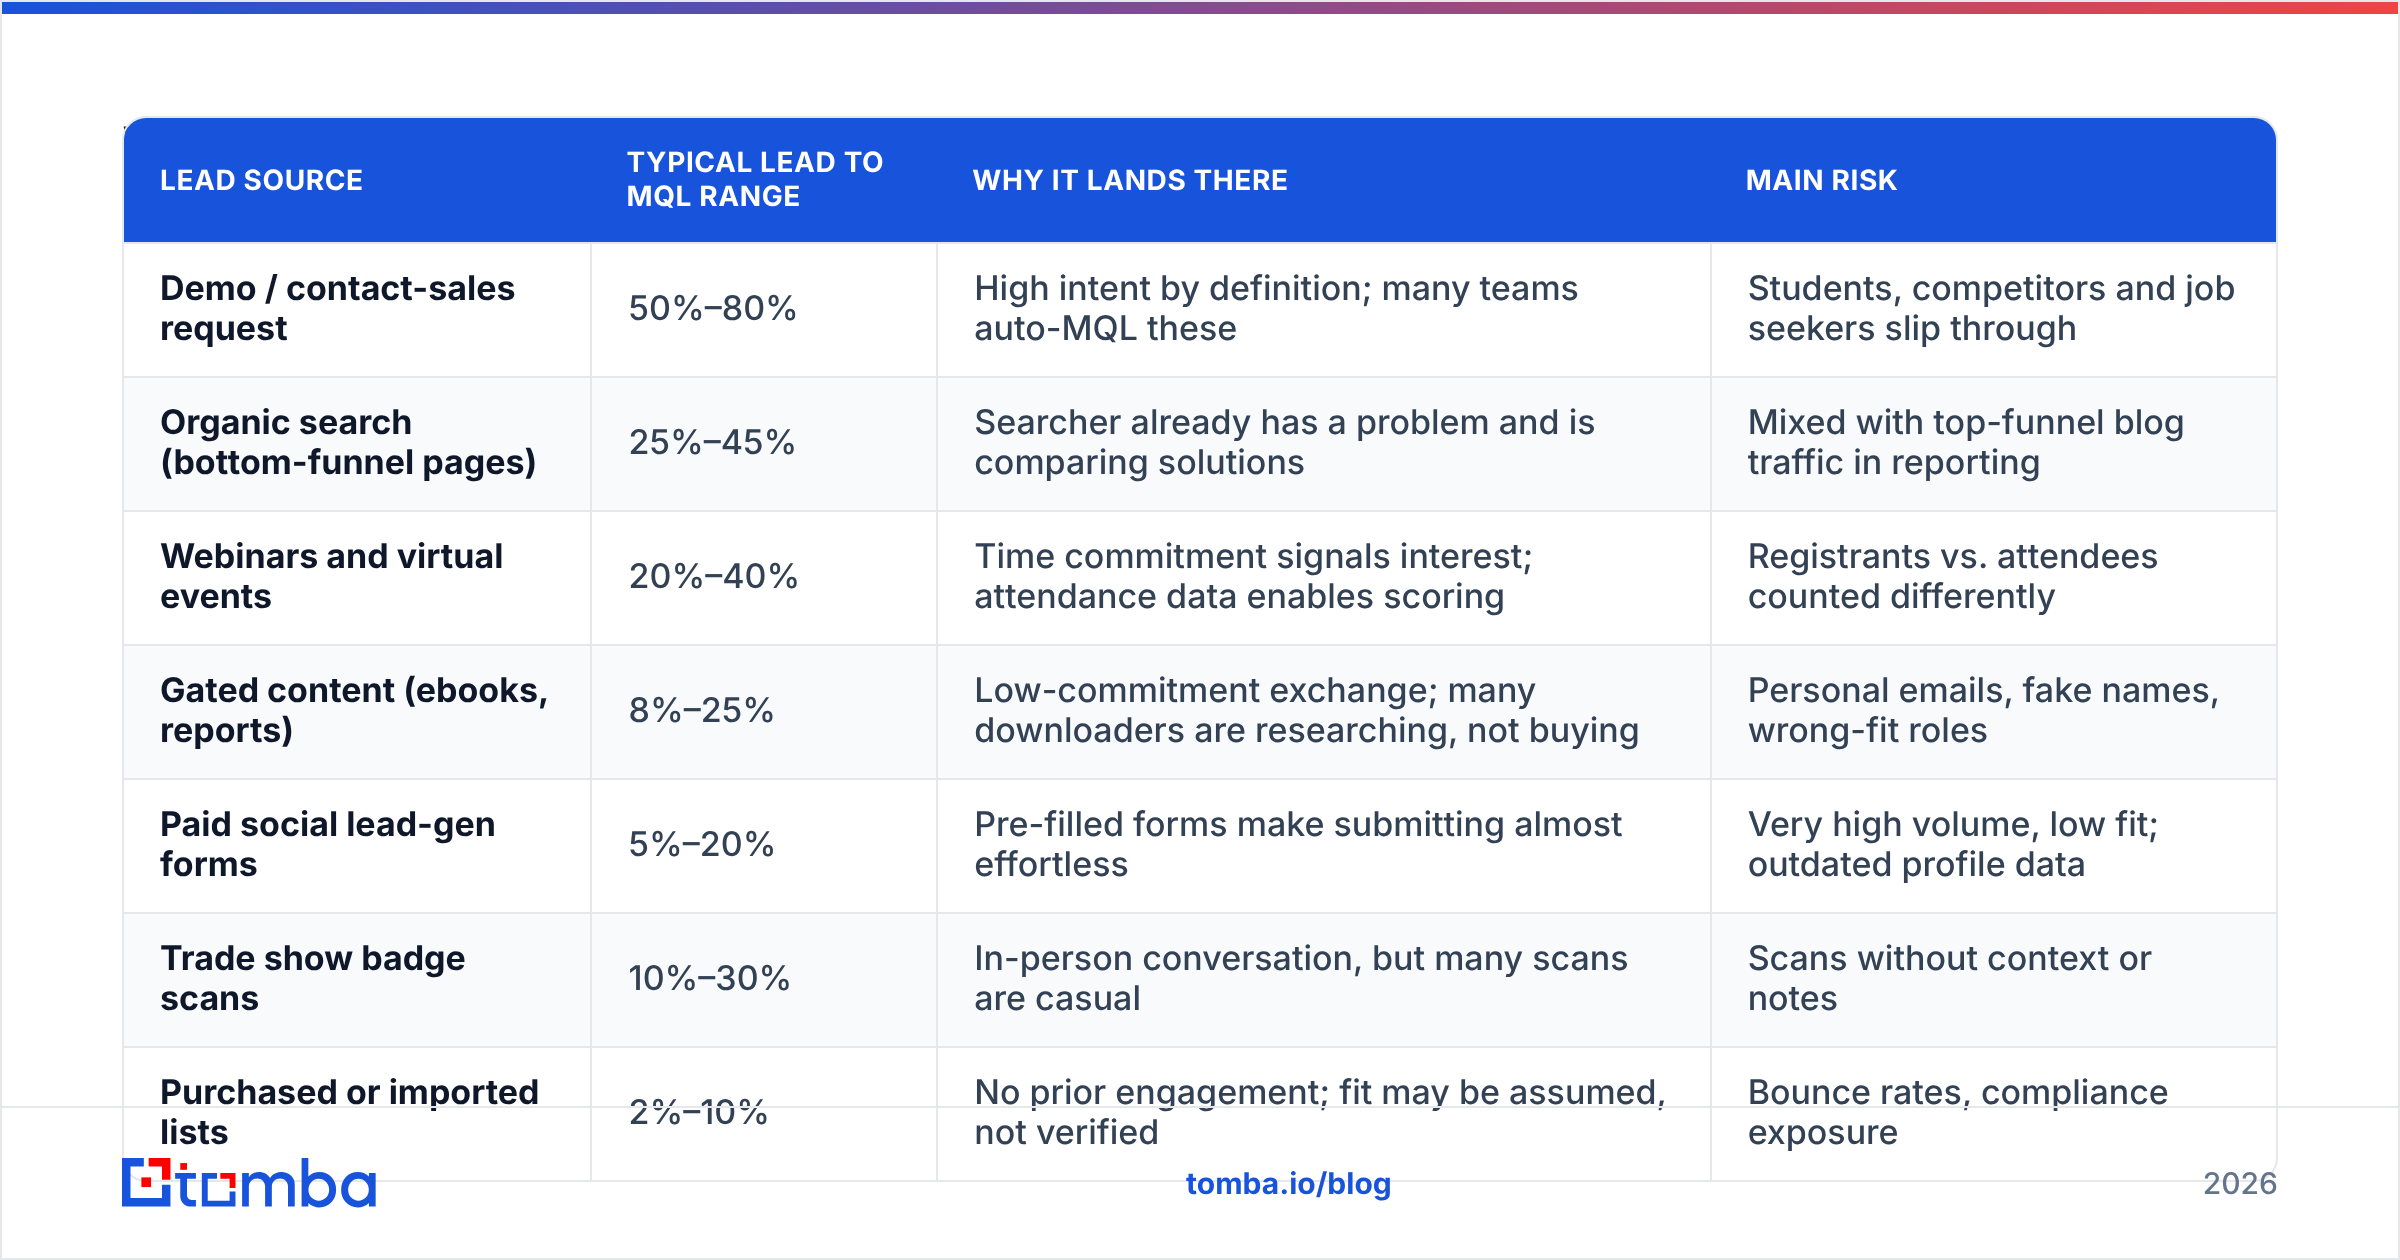
| Lead source | Typical lead to MQL range | Why it lands there | Main risk |
|---|---|---|---|
| Demo / contact-sales request | 50%–80% | High intent by definition; many teams auto-MQL these | Students, competitors and job seekers slip through |
| Organic search (bottom-funnel pages) | 25%–45% | Searcher already has a problem and is comparing solutions | Mixed with top-funnel blog traffic in reporting |
| Webinars and virtual events | 20%–40% | Time commitment signals interest; attendance data enables scoring | Registrants vs. attendees counted differently |
| Gated content (ebooks, reports) | 8%–25% | Low-commitment exchange; many downloaders are researching, not buying | Personal emails, fake names, wrong-fit roles |
| Paid social lead-gen forms | 5%–20% | Pre-filled forms make submitting almost effortless | Very high volume, low fit; outdated profile data |
| Trade show badge scans | 10%–30% | In-person conversation, but many scans are casual | Scans without context or notes |
| Purchased or imported lists | 2%–10% | No prior engagement; fit may be assumed, not verified | Bounce rates, compliance exposure |
A blended B2B rate of roughly 20%–30% is common for teams with a balanced channel mix and a reasonably strict MQL definition. If yours is well above 40% across all channels, check whether the definition is too loose. If it's below 10%, the problem is usually lead quality or data completeness, not the scoring threshold.
HubSpot's marketing statistics roundup is a useful starting point for broader funnel benchmarks. Read every figure there with the same caveat: definitions vary by company.
Why is a high lead to MQL conversion rate sometimes a bad sign?#
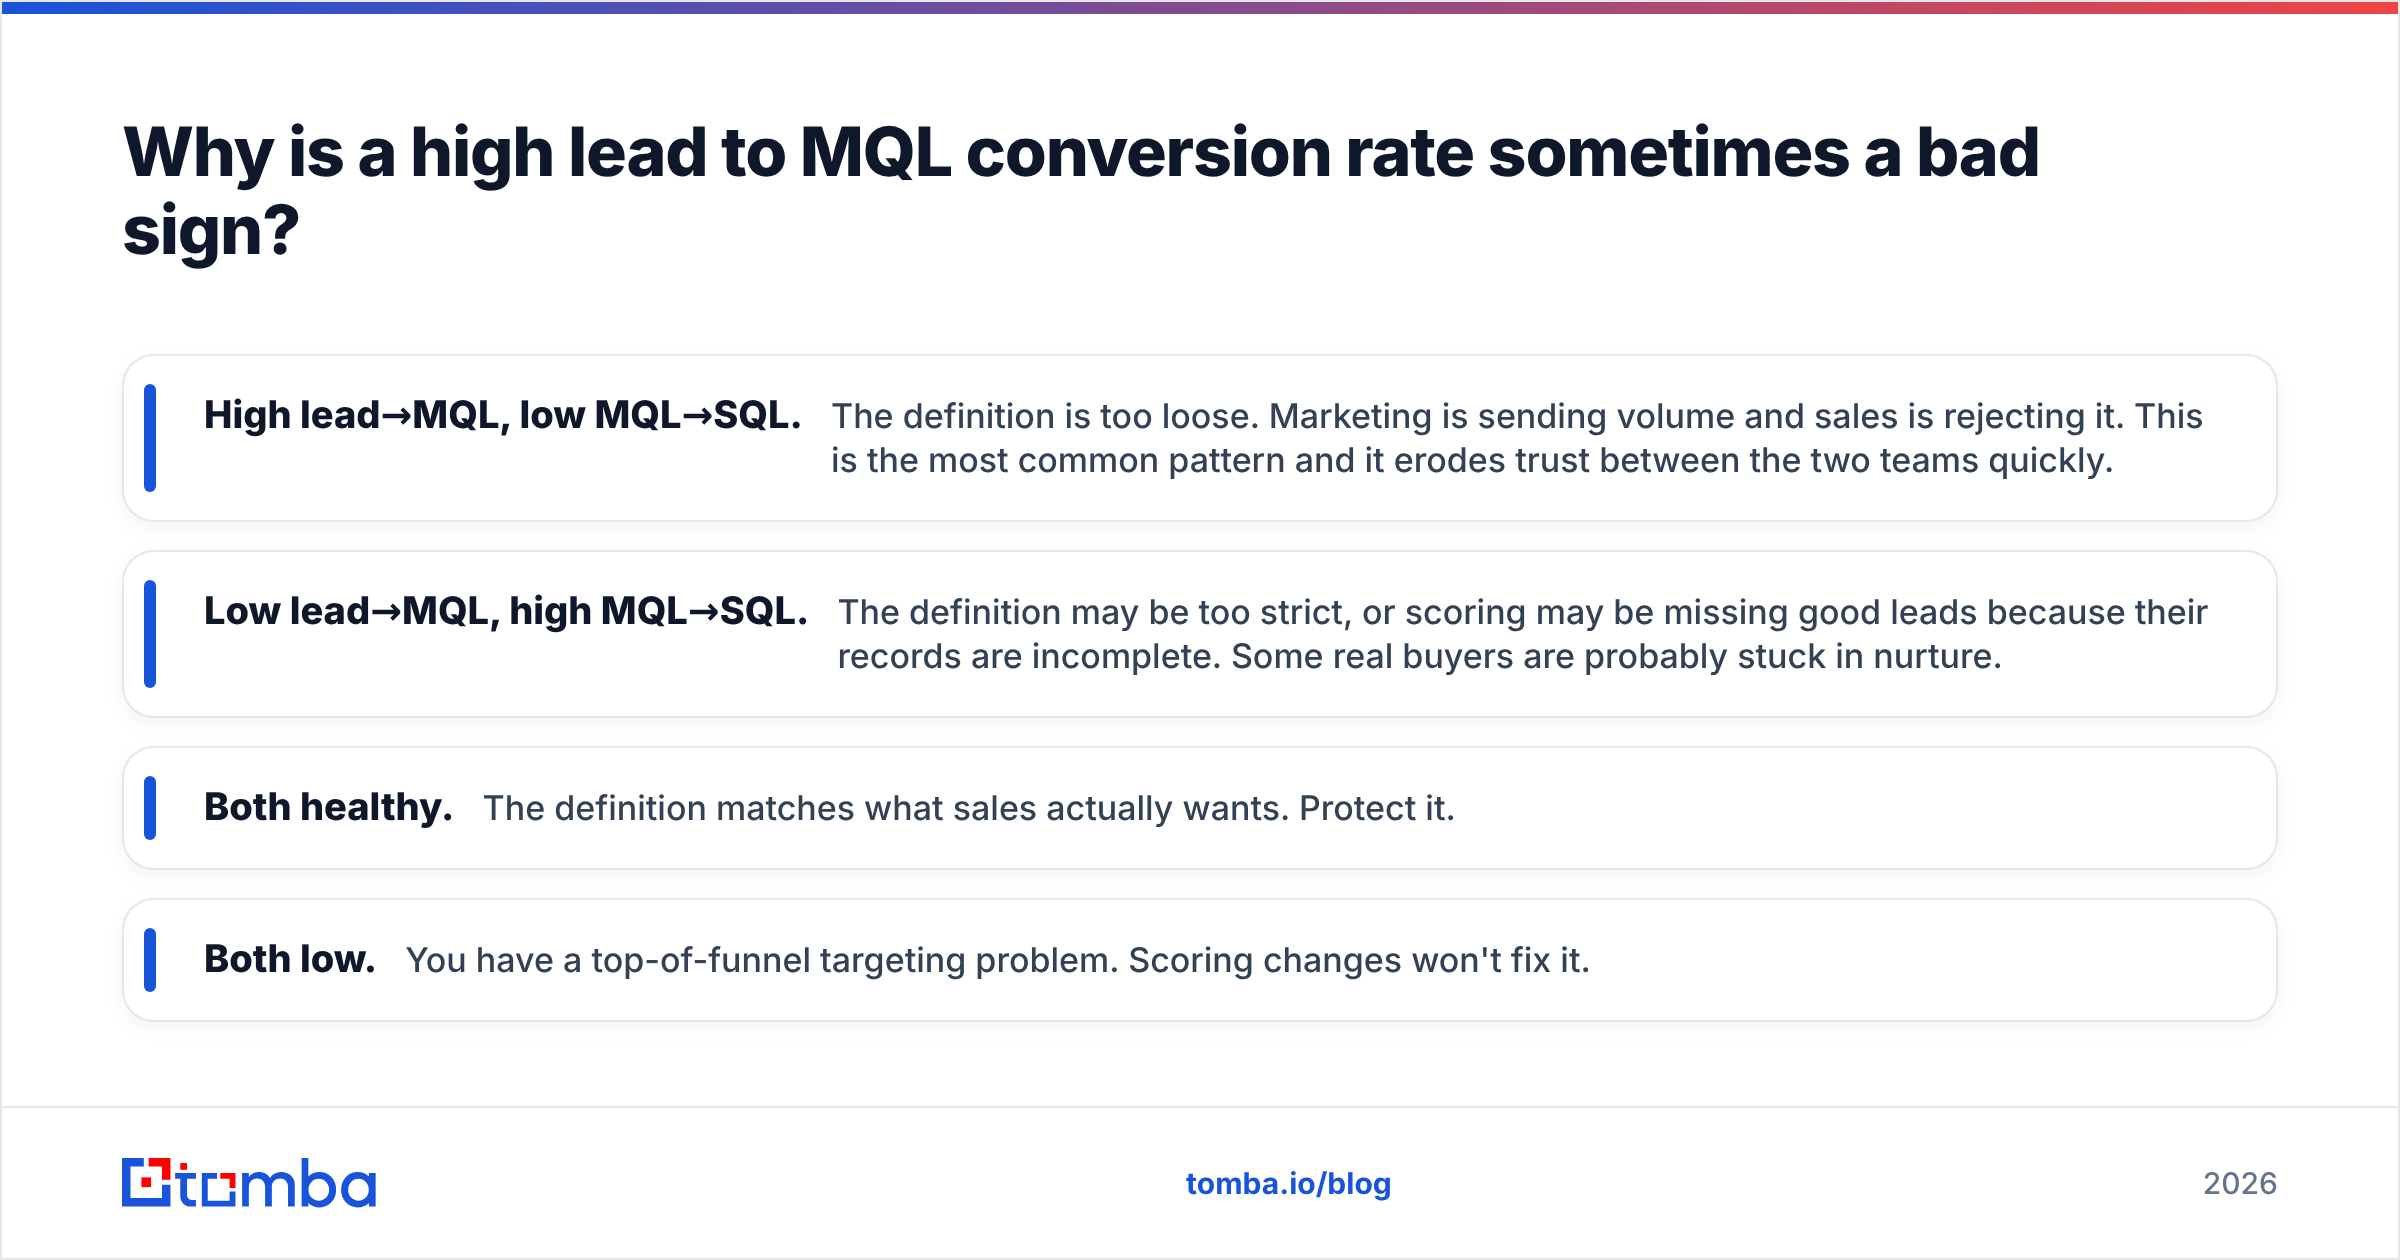
A high rate can be a bad sign when the MQLs don't hold up downstream. The best test is to put your lead-to-MQL rate next to your MQL-to-SQL acceptance rate:
- High lead→MQL, low MQL→SQL. The definition is too loose. Marketing is sending volume and sales is rejecting it. This is the most common pattern and it erodes trust between the two teams quickly.
- Low lead→MQL, high MQL→SQL. The definition may be too strict, or scoring may be missing good leads because their records are incomplete. Some real buyers are probably stuck in nurture.
- Both healthy. The definition matches what sales actually wants. Protect it.
- Both low. You have a top-of-funnel targeting problem. Scoring changes won't fix it.
The main failure is scoring on engagement alone. A student who opens every email, downloads three guides and visits the pricing page twice can easily score above an ideal-fit VP who filled out one form. Engagement shows interest. Fit shows whether that interest can turn into revenue. A model that only measures one of them will mislead you.
What drives lead to MQL conversion rate up or down?#
Five variables account for most of the movement:
1. Channel mix. When you shift budget from demo-request ads to top-funnel gated content, your blended rate drops even though nothing broke. Always segment by source before you react to a change.
2. MQL definition drift. A new marketing leader tightens the score threshold, or sales asks for a job-title filter. The rate drops overnight. Record definition changes with dates so trend lines stay interpretable.
3. Data completeness. This one gets underestimated. If 40% of your leads are missing company size, industry or job title, your fit score can't fire for them. They sit below threshold because the data is missing, not because they're poor fits. Lead scoring models are only as good as the fields they read.
4. Email validity. Leads with typo'd, disposable or role-based addresses (info@, admin@) can't be nurtured. They drag the denominator up and never convert. They also hurt your sender reputation when nurture emails bounce.
5. Speed and relevance of follow-up. A lead that gets a relevant nurture sequence within an hour engages far more than one that waits for next week's batch newsletter. More engagement means more scoring points, so more leads reach the MQL threshold.
How can you improve your lead to MQL conversion rate?#
These are ordered roughly by impact relative to effort. Most teams should start at the top.
1. Enrich every lead at the point of capture. Keep forms short (name and work email) and fill in company, size, industry, title and seniority automatically. Short forms convert more visitors, and enrichment gives your fit score the fields it needs. A data enrichment step that runs on form submit or via webhook to your CRM often lifts the rate noticeably on its own, because leads that were stuck at "unknown fit" become scorable.
2. Verify emails before they enter the funnel. Run new leads through an email verifier so invalid, disposable and risky addresses are flagged or suppressed. This removes dead leads from the denominator and keeps nurture sequences from damaging deliverability. It's a measurement fix and a funnel fix in one step.
3. Split fit scoring and engagement scoring. Use two scores, or a matrix (A1 to D4), instead of one number. An MQL should need a minimum fit grade and a minimum engagement level. This one change usually does the most to align marketing and sales on what "qualified" means.
4. Add negative scoring. Subtract points for competitor domains, student emails, careers-page visits, unsubscribes and job titles outside your buying committee. Negative scoring cleans the pool without raising the threshold for everyone.
5. Match nurture tracks to the entry asset. Someone who downloaded a pricing comparison guide shouldn't get the same five emails as someone who registered for a beginner webinar. Build two or three tracks based on the intent signal of the first conversion.
6. Re-score stale leads quarterly. Titles change, companies grow and prospects switch jobs. A lead that was a poor fit 18 months ago may be an ideal fit now. Re-enrich and re-score the database on a schedule, not just at capture.
7. Close the loop with sales rejection reasons. Make "reason for rejection" a required picklist when SDRs disqualify an MQL. Review it monthly. If "wrong company size" is the top reason, the fix belongs in the fit score, not in marketing copy.
Which fixes should you prioritize first?#
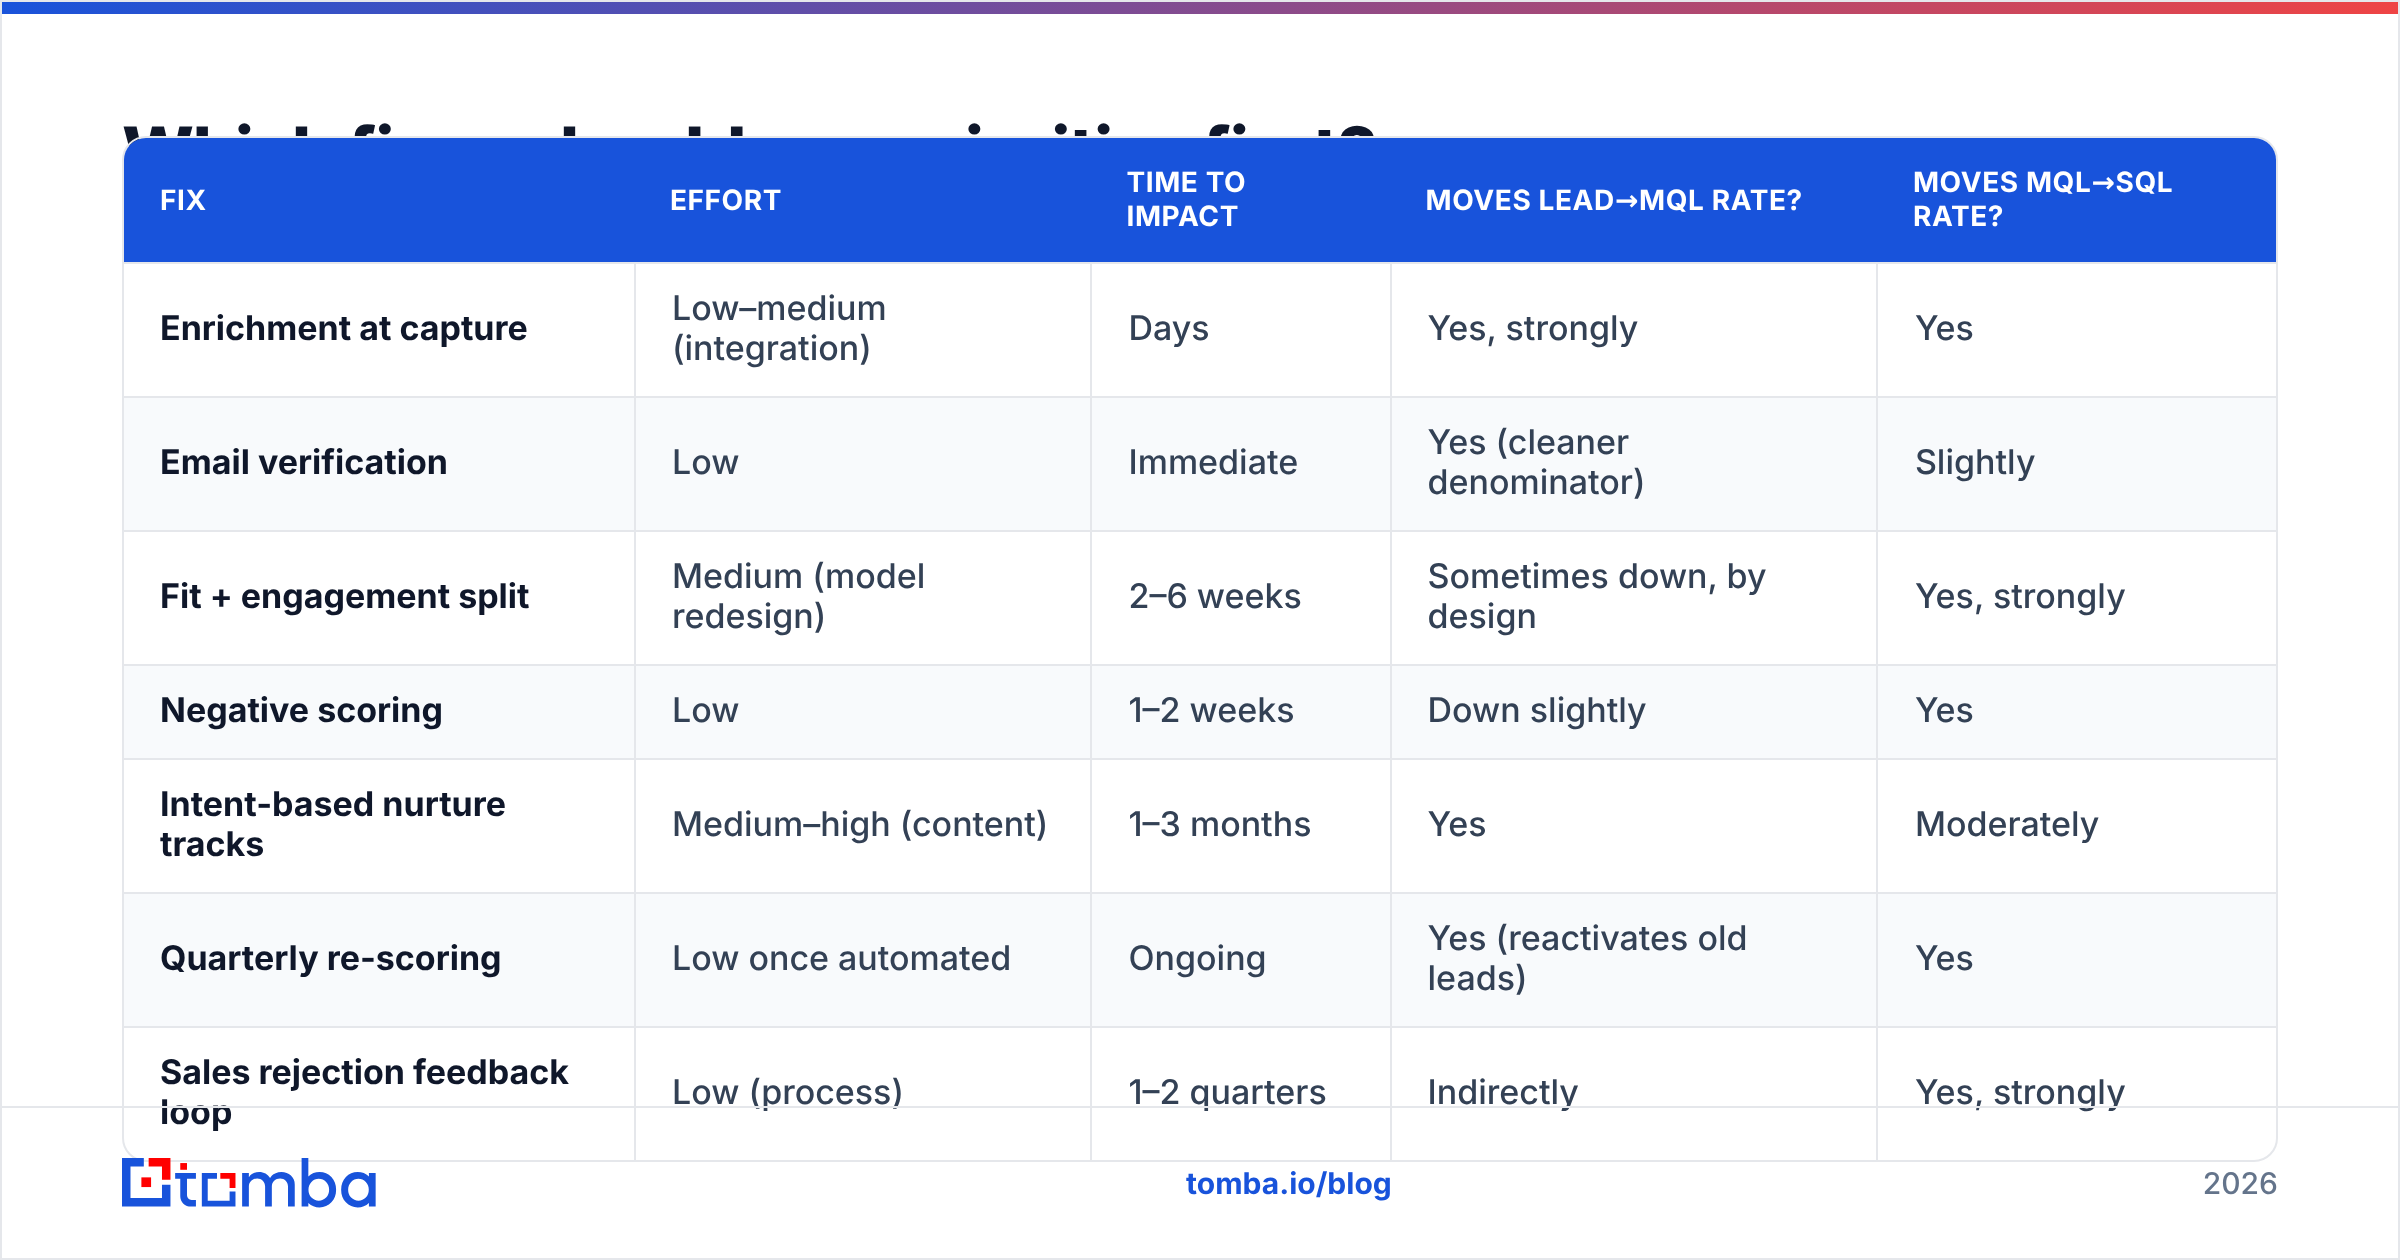
Here's how the fixes compare on effort, speed and the metric each one moves:
| Fix | Effort | Time to impact | Moves lead→MQL rate? | Moves MQL→SQL rate? |
|---|---|---|---|---|
| Enrichment at capture | Low–medium (integration) | Days | Yes, strongly | Yes |
| Email verification | Low | Immediate | Yes (cleaner denominator) | Slightly |
| Fit + engagement split | Medium (model redesign) | 2–6 weeks | Sometimes down, by design | Yes, strongly |
| Negative scoring | Low | 1–2 weeks | Down slightly | Yes |
| Intent-based nurture tracks | Medium–high (content) | 1–3 months | Yes | Moderately |
| Quarterly re-scoring | Low once automated | Ongoing | Yes (reactivates old leads) | Yes |
| Sales rejection feedback loop | Low (process) | 1–2 quarters | Indirectly | Yes, strongly |
Some good fixes lower the lead-to-MQL rate on purpose. Splitting fit from engagement and adding negative scoring remove weak MQLs, so the rate can fall while pipeline goes up. Tell leadership this before you roll out the change, or you'll spend the next QBR defending a drop that is actually progress.
If you're evaluating scoring tools as part of this, G2's lead scoring category is a reasonable place to compare options by company size and CRM compatibility.
How should you report lead to MQL conversion rate to leadership?#
Report it as one of three numbers, not a standalone KPI:
- Volume: new leads this period, by source.
- Qualification: lead to MQL conversion rate by source, cohort-based (e.g. leads created in April, measured at 60 days).
- Acceptance: MQL to SQL rate, plus the top three sales rejection reasons.
Also show a pipeline per lead figure (pipeline generated ÷ total leads) by channel. This is the number that settles the "our volume is up, why isn't pipeline?" argument. It connects top-of-funnel spend to revenue without depending on any single stage definition.
Avoid week-over-week comparisons for lead-to-MQL rate. The time lag between lead creation and qualification makes weekly numbers noisy. Monthly cohorts, reviewed at a fixed age, are far more stable.
What are common mistakes when tracking this metric?#
- Measuring in the same period instead of by cohort. Counting "MQLs this month ÷ leads this month" mixes leads from different periods and distorts the rate whenever volume swings.
- Letting auto-MQL rules pile up. Every "demo request = instant MQL" or "event attendee = MQL" shortcut feels harmless. Stack five of them and your scoring model stops doing anything.
- Ignoring invalid contacts. If a large share of your database bounces, the rate is being calculated partly on people who can never receive your nurture emails.
- Changing the definition silently. Every definition change needs a date and a note in the dashboard. Without that, year-over-year trend lines are meaningless.
- Optimizing the rate instead of the outcome. The goal is qualified pipeline. The lead to MQL conversion rate is a diagnostic, not the destination.
Does lead to MQL conversion rate still matter in 2026?#
Yes, though its role has changed. Many revenue teams now use buying-group and account-level qualification alongside, or instead of, individual MQLs. Analysts at firms like Gartner have written about the move toward buying-group-centric demand models for years. Even so, the individual lead is still where data enters your system, and the conversion rate at that first gate still tells you whether your capture, data and scoring are working.
What has changed is where the gains come from. Nurture copy and lead magnets are mature at most B2B companies, so there's little left to gain there. The underused lever is data quality at the point of entry. When every record arrives with a verified email, a real job title and a known company size, scoring works, sales trusts the MQLs, and the conversion rate reflects actual buying interest.
How can Tomba help raise your lead to MQL conversion rate?#
If your MQL problem is really a data problem, and for most teams at least part of it is, fix the inputs first. The Tomba Email Finder finds and fills in verified professional email addresses by name, domain or company. That lets you run short, high-converting forms, recover leads who entered personal or typo'd addresses, and give your scoring model complete, trustworthy records to work with. You can start on the free tier (25 searches a month) to test it on a sample of stuck leads, then move to Starter at $49/mo when you're ready to connect it to your capture flow. See Tomba pricing for the full plan breakdown.
Related guides#
// get started
Find, verify and enrich your first contacts today
Start on the free plan with 25 searches a month, then scale when your team is ready.
Free plan · No credit card required · GDPR & CCPA
Get the Tomba newsletter
Product and data updates
// about the author