Lead to Opportunity Conversion Rate: Formula, Benchmarks, Fixes
Most teams track lead volume and win rate but lose deals in between. Learn how to calculate lead to opportunity conversion rate, what good looks like by channel, and seven fixes that lift it.
TL;DR
- Lead to opportunity conversion rate = (new opportunities created ÷ leads in the same cohort) × 100. It shows how much of your top-of-funnel actually turns into pipeline.
- Directional 2026 ranges: roughly 1–5% for cold outbound lists, 10–20% for inbound form fills, and 30–50%+ for referrals and demo requests. Your own trend line matters more than any industry average.
- The usual causes of a low rate are loose lead definitions, slow follow-up, bad contact data, and a weak handoff between marketing and sales. Channel mix is rarely the real culprit.
- Measure it by cohort (leads created in month X, and how many became opportunities within 90 days), not as a raw period ratio. Otherwise lag distorts every chart.
- Fix the data layer first. If your emails bounce or reach the wrong person, nothing downstream can convert.
What is lead to opportunity conversion rate?#
Lead to opportunity conversion rate is the share of leads that become qualified sales opportunities. An opportunity means a deal record with an amount, a stage, and a real buying conversation behind it. The metric sits in the middle of your funnel. Traffic and form fills come before it, and win rate and revenue come after it.
It matters because it's where most B2B funnels leak. Marketing can hit its lead target and sales can hold a healthy win rate while pipeline still comes up short, because too few leads ever become deals. When you track this one number, both teams have to agree on what a lead is worth.
In the sales process, it measures the jump from "someone showed interest" to "someone agreed to evaluate buying." That jump is expensive. It usually takes a human conversation, which makes it the most resource-heavy step you can measure early.
How do you calculate lead to opportunity conversion rate?#
The formula is simple:
Lead to opportunity conversion rate = (Opportunities created from leads ÷ Total leads) × 100
Worked example: in Q1 you generated 1,200 leads, and 150 of them became opportunities. 150 ÷ 1,200 = 0.125, so your rate is 12.5%.
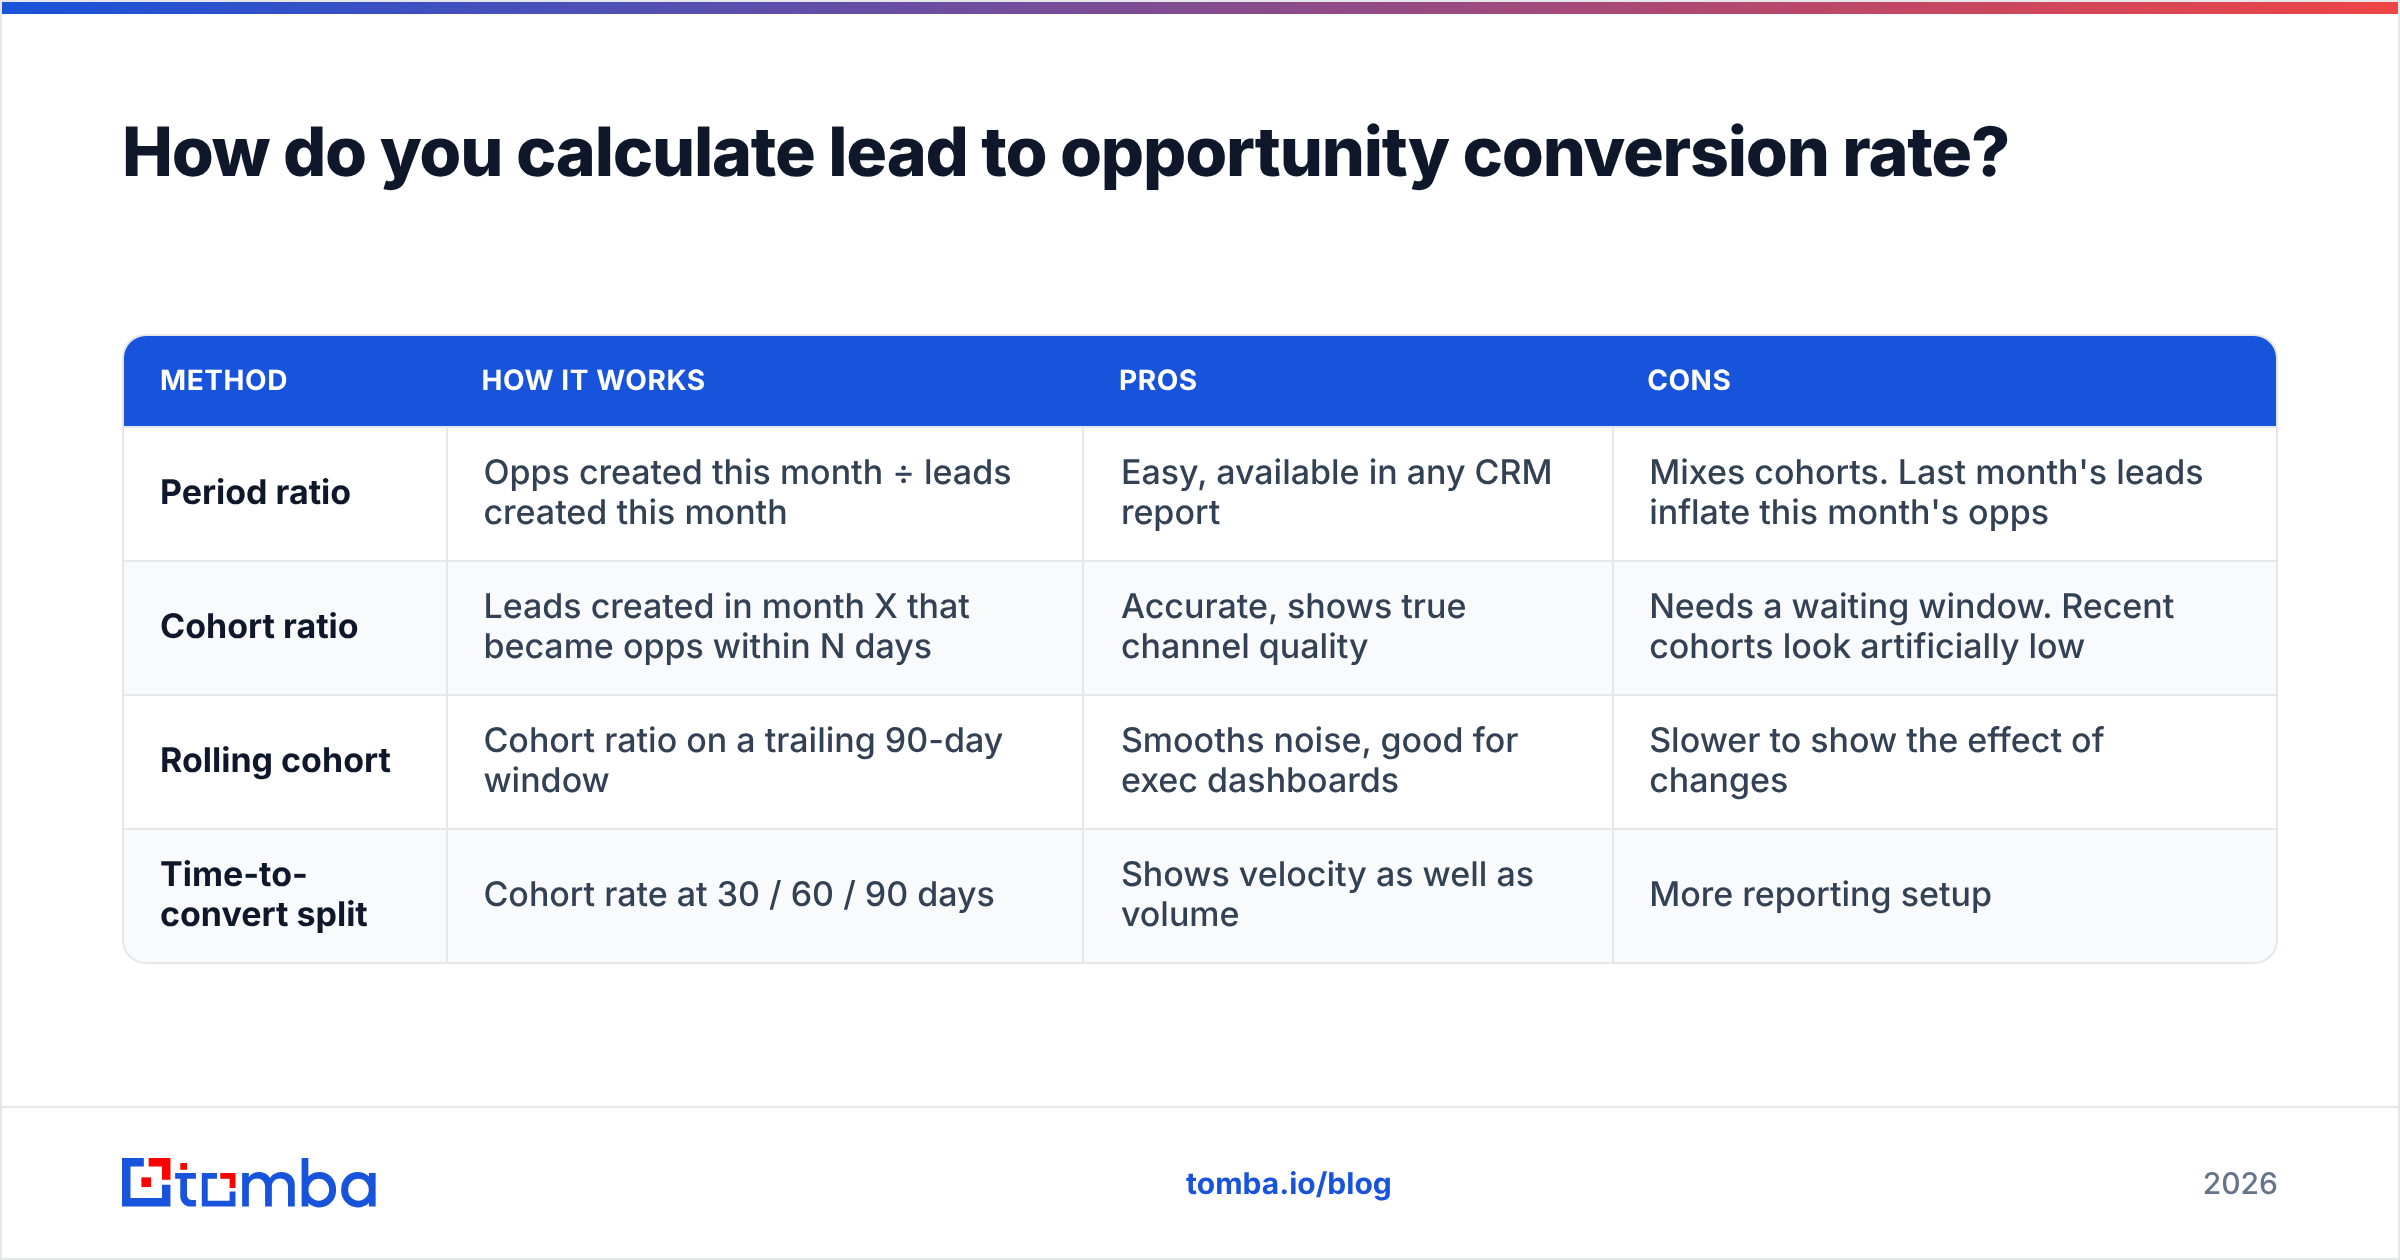
The hard part is deciding which leads and which opportunities go in the formula. There are two common approaches:
| Method | How it works | Pros | Cons |
|---|---|---|---|
| Period ratio | Opps created this month ÷ leads created this month | Easy, available in any CRM report | Mixes cohorts. Last month's leads inflate this month's opps |
| Cohort ratio | Leads created in month X that became opps within N days | Accurate, shows true channel quality | Needs a waiting window. Recent cohorts look artificially low |
| Rolling cohort | Cohort ratio on a trailing 90-day window | Smooths noise, good for exec dashboards | Slower to show the effect of changes |
| Time-to-convert split | Cohort rate at 30 / 60 / 90 days | Shows velocity as well as volume | More reporting setup |
Use the cohort method for any decision that matters. If your median time from lead to opportunity is 21 days, a period ratio run on the 1st of the month is mostly measuring last month's marketing.
A practical setup: add a "Lead Created Date" and an "Opportunity Created Date" to the contact or deal in your CRM, then report conversions within a fixed 90-day window. Both HubSpot and Salesforce support this with native lifecycle stage history, so you don't need a BI tool to start.
What exactly counts as a "lead" and an "opportunity"?#
Most bad benchmarks come from mismatched definitions. A company that counts every newsletter signup as a lead will report 2%. A company that counts only demo requests will report 40%. Both numbers are correct, and comparing them tells you nothing.
Write your definitions down before you measure anything:
- Raw lead – Any identified contact: form fill, event scan, list import, or chatbot conversation. High volume, low intent.
- Marketing qualified lead (MQL) – A lead that meets fit plus engagement thresholds. See the marketing qualified lead definition if your team hasn't formalized one.
- Sales accepted lead (SAL) – A rep has reviewed the lead and agreed it's worth working.
- Sales qualified lead (SQL) – A discovery conversation confirmed need, authority, or timing.
- Opportunity – A deal record with an estimated amount, a close date, and a next step both sides agreed to.
Pick one denominator and keep it. Most revenue teams report MQL → opportunity as the headline and keep raw lead → opportunity as a secondary check on list quality. If you change the definition mid-year, restate the history. Otherwise your trend line becomes fiction.
What is a good lead to opportunity conversion rate in 2026?#
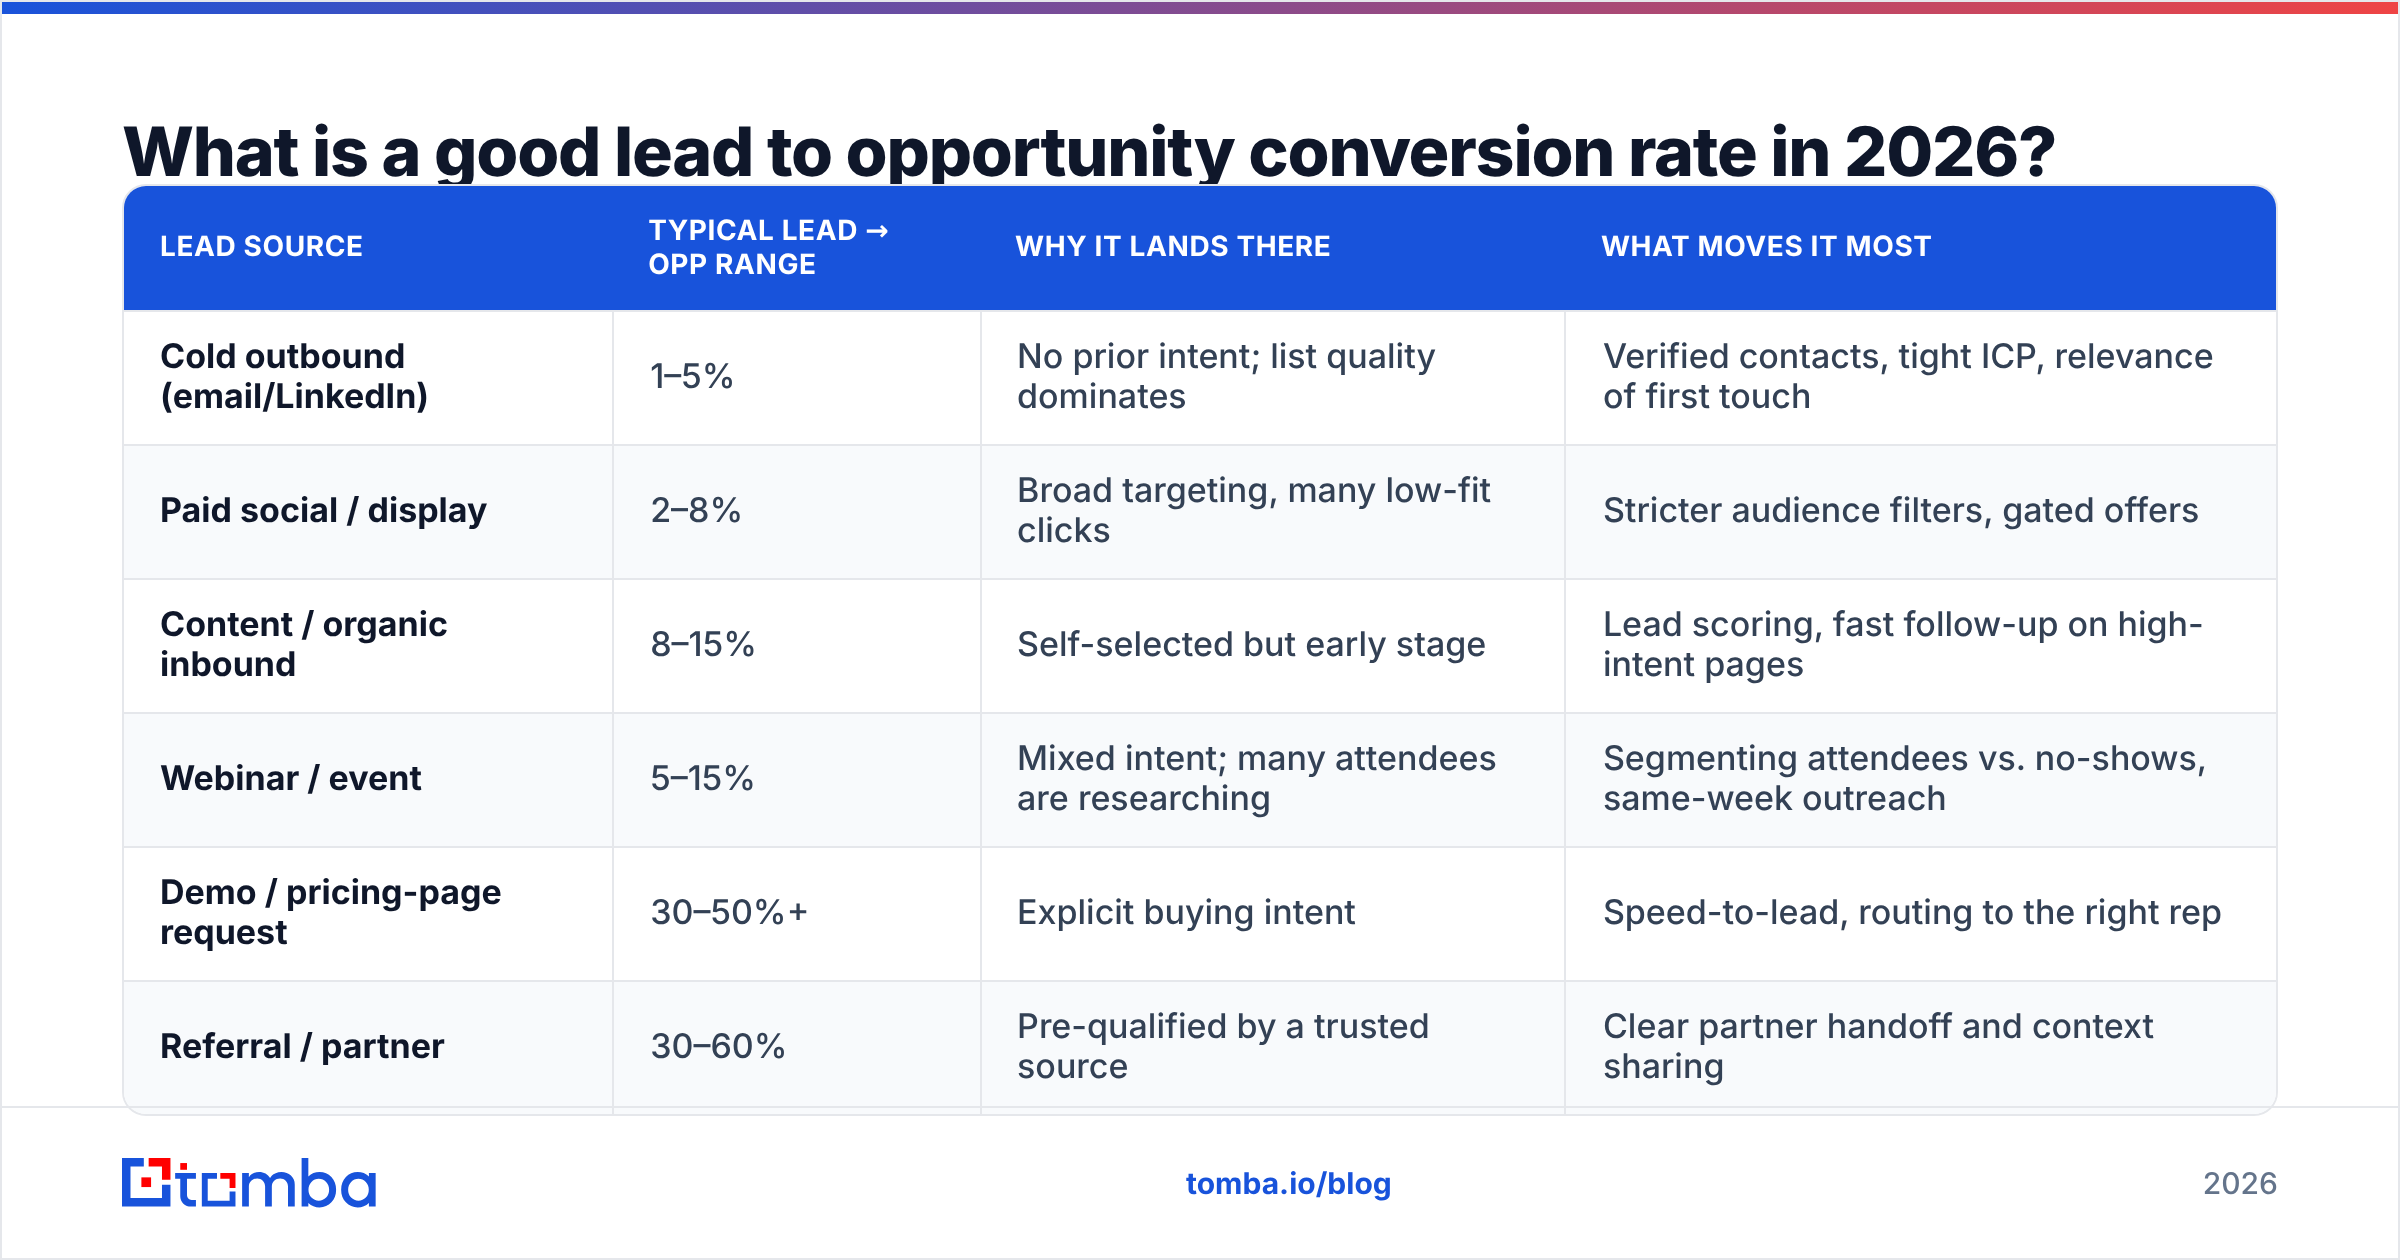
There's no universal "good" number. Rates depend on channel, deal size, and definition. The ranges below are directional, pulled from commonly published SaaS funnel reports and practitioner data. Treat them as sanity checks, not targets.
| Lead source | Typical lead → opp range | Why it lands there | What moves it most |
|---|---|---|---|
| Cold outbound (email/LinkedIn) | 1–5% | No prior intent; list quality dominates | Verified contacts, tight ICP, relevance of first touch |
| Paid social / display | 2–8% | Broad targeting, many low-fit clicks | Stricter audience filters, gated offers |
| Content / organic inbound | 8–15% | Self-selected but early stage | Lead scoring, fast follow-up on high-intent pages |
| Webinar / event | 5–15% | Mixed intent; many attendees are researching | Segmenting attendees vs. no-shows, same-week outreach |
| Demo / pricing-page request | 30–50%+ | Explicit buying intent | Speed-to-lead, routing to the right rep |
| Referral / partner | 30–60% | Pre-qualified by a trusted source | Clear partner handoff and context sharing |
Two practical takeaways:
- Blended rates hide the truth. A 9% blended rate can mean excellent inbound and a broken outbound program. Always split the rate by source.
- Compare against yourself. Research firms like Gartner consistently find that B2B buyers now do most of their research before talking to sales. So your ratio shifts as buyer behavior shifts, whatever you do. A steady quarter-over-quarter improvement in your own cohort data is a better goal than hitting someone else's average.
Why is your lead to opportunity conversion rate low?#
When the number drops, teams usually blame the channel. In practice, one of these five causes is almost always behind it:
- Bad contact data – Emails bounce, phone numbers go to reception desks, and titles are two jobs out of date. Reps can't convert a lead they can't reach. If more than 3–5% of your outbound bounces, your conversion rate problem starts as a data problem. Run lists through an email verifier before they hit a sequence.
- Slow speed-to-lead – High-intent inbound leads cool off fast. If a demo request waits a day for a reply, a competitor who answered in minutes has probably already booked the call.
- Loose MQL criteria – Scoring that rewards clicks and page views over fit sends sales a flood of students, job seekers, and competitors. Reps stop trusting MQLs and quietly stop working them.
- Broken handoff – The lead arrives with no context: no source, no content consumed, no firmographics. The rep's first message is generic, and the prospect disengages.
- Missing follow-up – Many reps stop after one or two touches. Most conversions from cold or lukewarm leads happen on later touches, so thin cadences cap your rate.
Notice that none of these is "we need more leads." More volume through a leaky process mostly lowers the ratio and burns rep time.
How does it compare with other funnel metrics?#
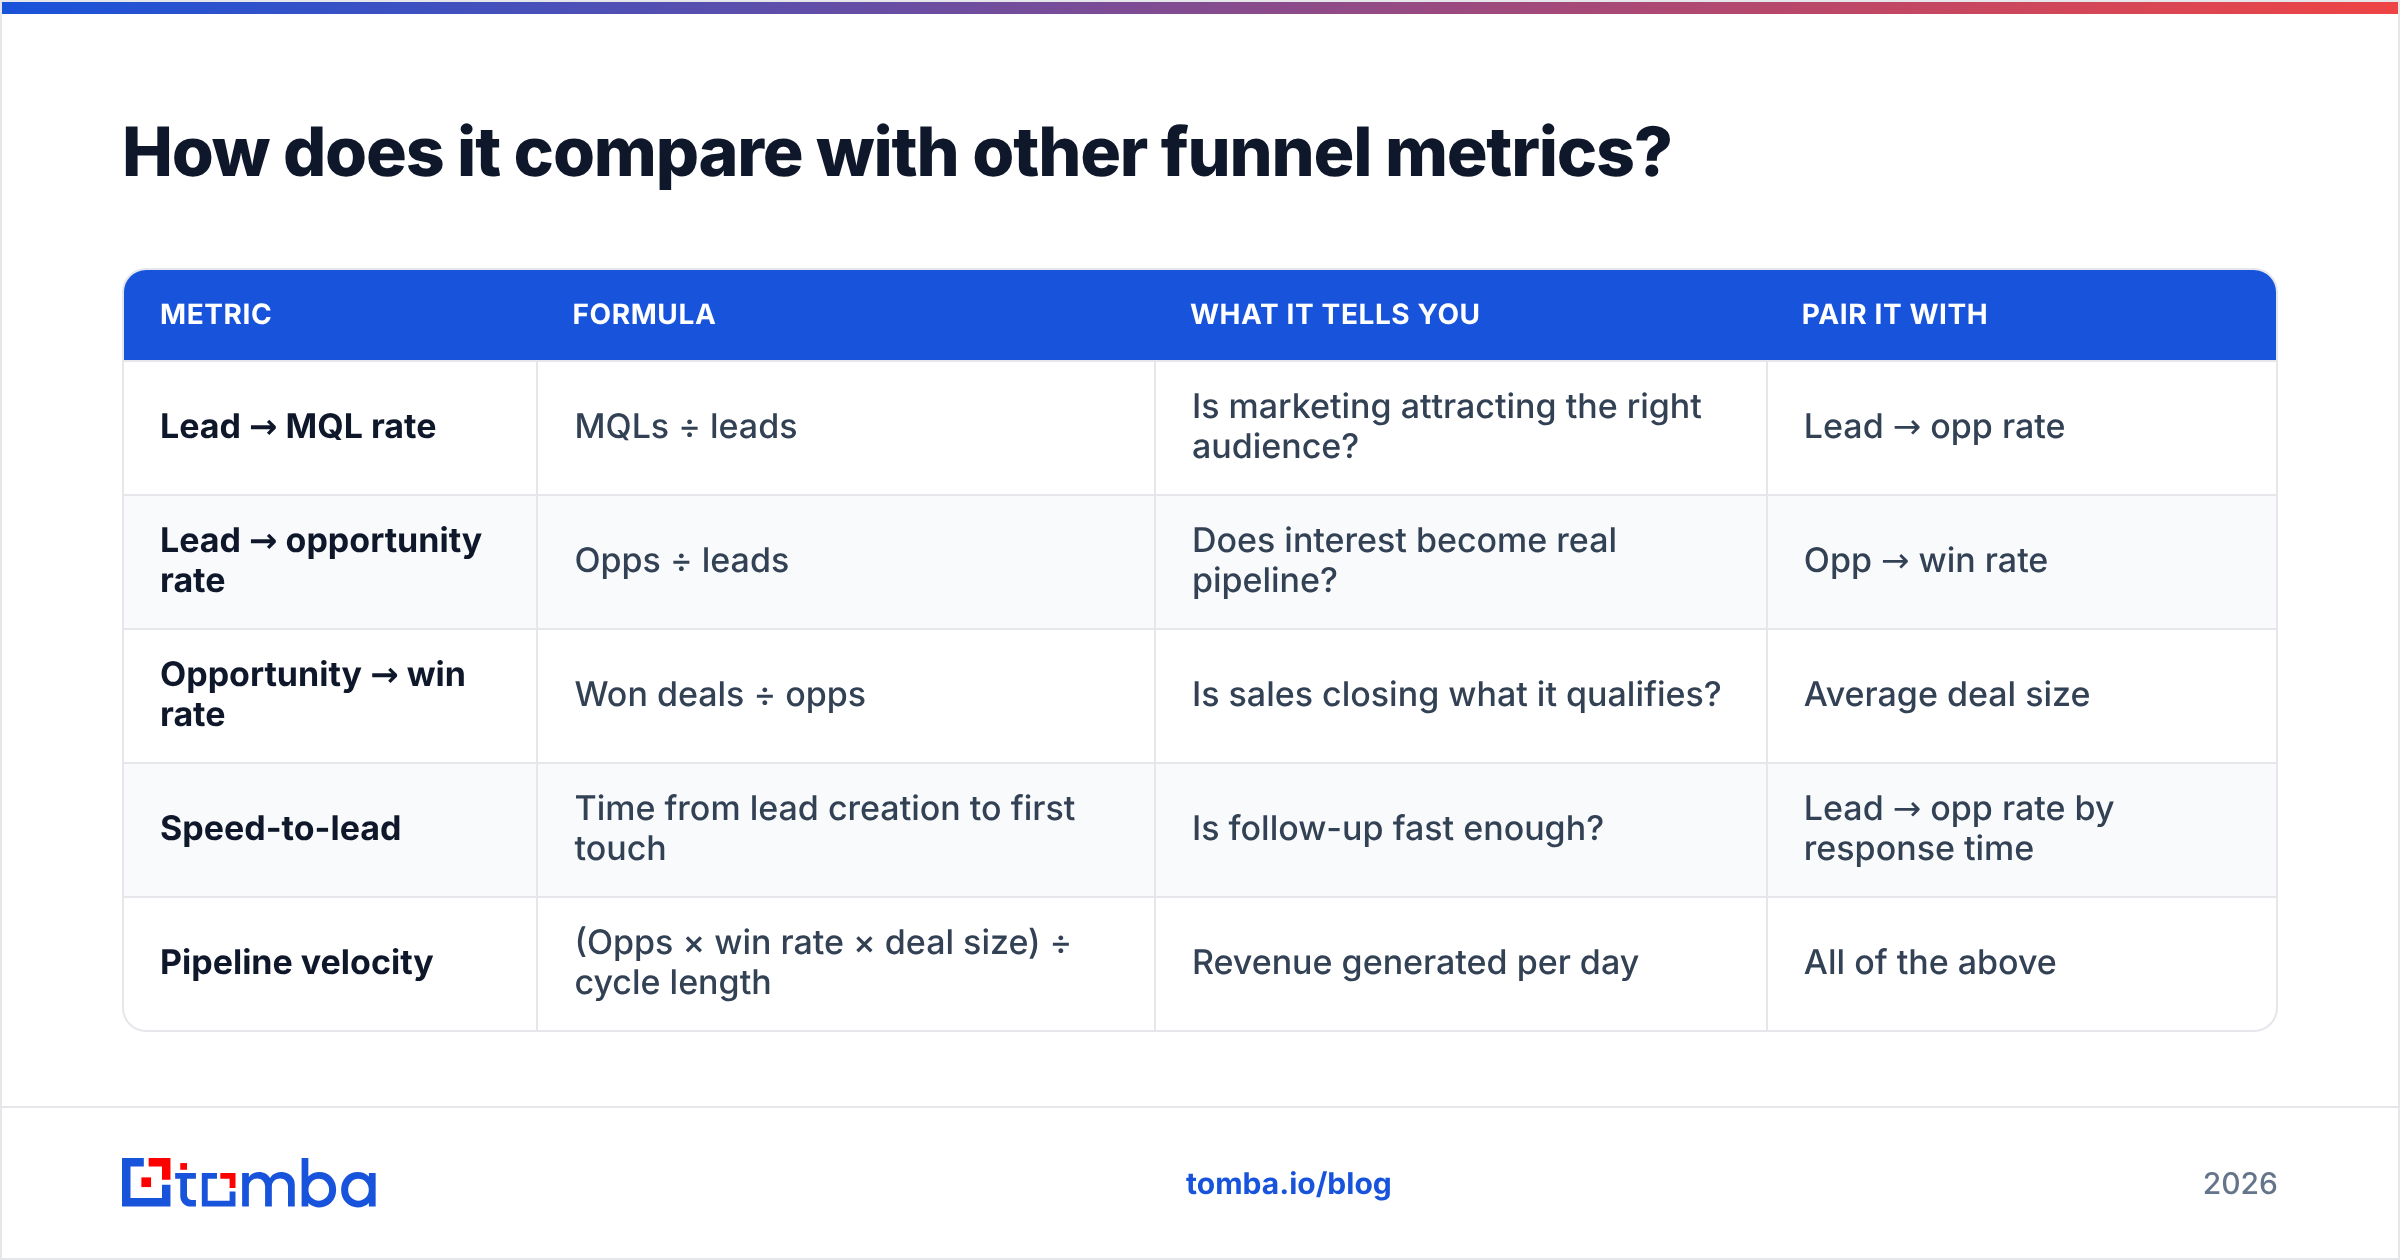
Lead to opportunity conversion rate works best alongside the metrics on either side of it. Tracked alone, it can be gamed. For example, you can inflate it by creating low-quality opportunities that never close.
| Metric | Formula | What it tells you | Pair it with |
|---|---|---|---|
| Lead → MQL rate | MQLs ÷ leads | Is marketing attracting the right audience? | Lead → opp rate |
| Lead → opportunity rate | Opps ÷ leads | Does interest become real pipeline? | Opp → win rate |
| Opportunity → win rate | Won deals ÷ opps | Is sales closing what it qualifies? | Average deal size |
| Speed-to-lead | Time from lead creation to first touch | Is follow-up fast enough? | Lead → opp rate by response time |
| Pipeline velocity | (Opps × win rate × deal size) ÷ cycle length | Revenue generated per day | All of the above |
A useful sanity check: if lead → opp goes up while win rate drops sharply, your team is probably converting leads into opportunities too early. Tighten the opportunity entry criteria before you celebrate.
How can you improve your lead to opportunity conversion rate? Seven fixes#
These are ordered by typical impact per hour of effort. Start at the top.
1. Clean and verify your contact data#
Every other fix assumes you can reach the lead. Run new and existing leads through verification, drop invalid addresses, and flag catch-all domains for lower-priority handling. For outbound, fill gaps with a dedicated email finder rather than guessing formats. A rep sending to a valid, current address beats a rep sending a brilliant message to a dead inbox.
2. Enrich leads before routing#
A form fill with only an email tells a rep almost nothing. Add company size, industry, role, seniority, and tech stack automatically so routing rules and reps can prioritize. Data enrichment at the moment of capture also lets you shorten forms, which usually raises form completion without hurting quality.
3. Set a speed-to-lead SLA and enforce it#
Commit to a response time for high-intent leads, often under an hour and ideally minutes for demo requests. Route to the right rep automatically and alert through Slack or your CRM. Report conversion rate by response-time bucket. The chart usually makes the case for you.
4. Rebuild lead scoring around fit first#
Weight firmographic fit (ICP match, role, company size) more heavily than behavioral signals. A VP at a target-fit company who visited once is usually worth more than an intern who downloaded five ebooks. Review closed-won deals from the last 12 months to reverse-engineer which attributes actually predict opportunities.
5. Standardize the handoff#
Create a required context block on every lead passed to sales: source, key pages or content consumed, fit score, and any stated need. Reps who open with specific context convert noticeably better than reps who open with "Just checking in."
6. Extend and personalize follow-up#
Build a cadence of 6–10 touches across email, phone, and LinkedIn over two to three weeks for qualified leads. Personalize the first two touches heavily, and let the rest be lighter reminders with new value, such as a relevant case study or benchmark.
7. Align on definitions in a written SLA#
Marketing commits to lead volume and quality criteria. Sales commits to follow-up speed and a minimum number of touches. Review lead → opp rate by source every month together. This single meeting fixes more conversion problems than any tool, because it ends the "your leads are bad" / "you never call them" loop.

Which tools help at each stage?#
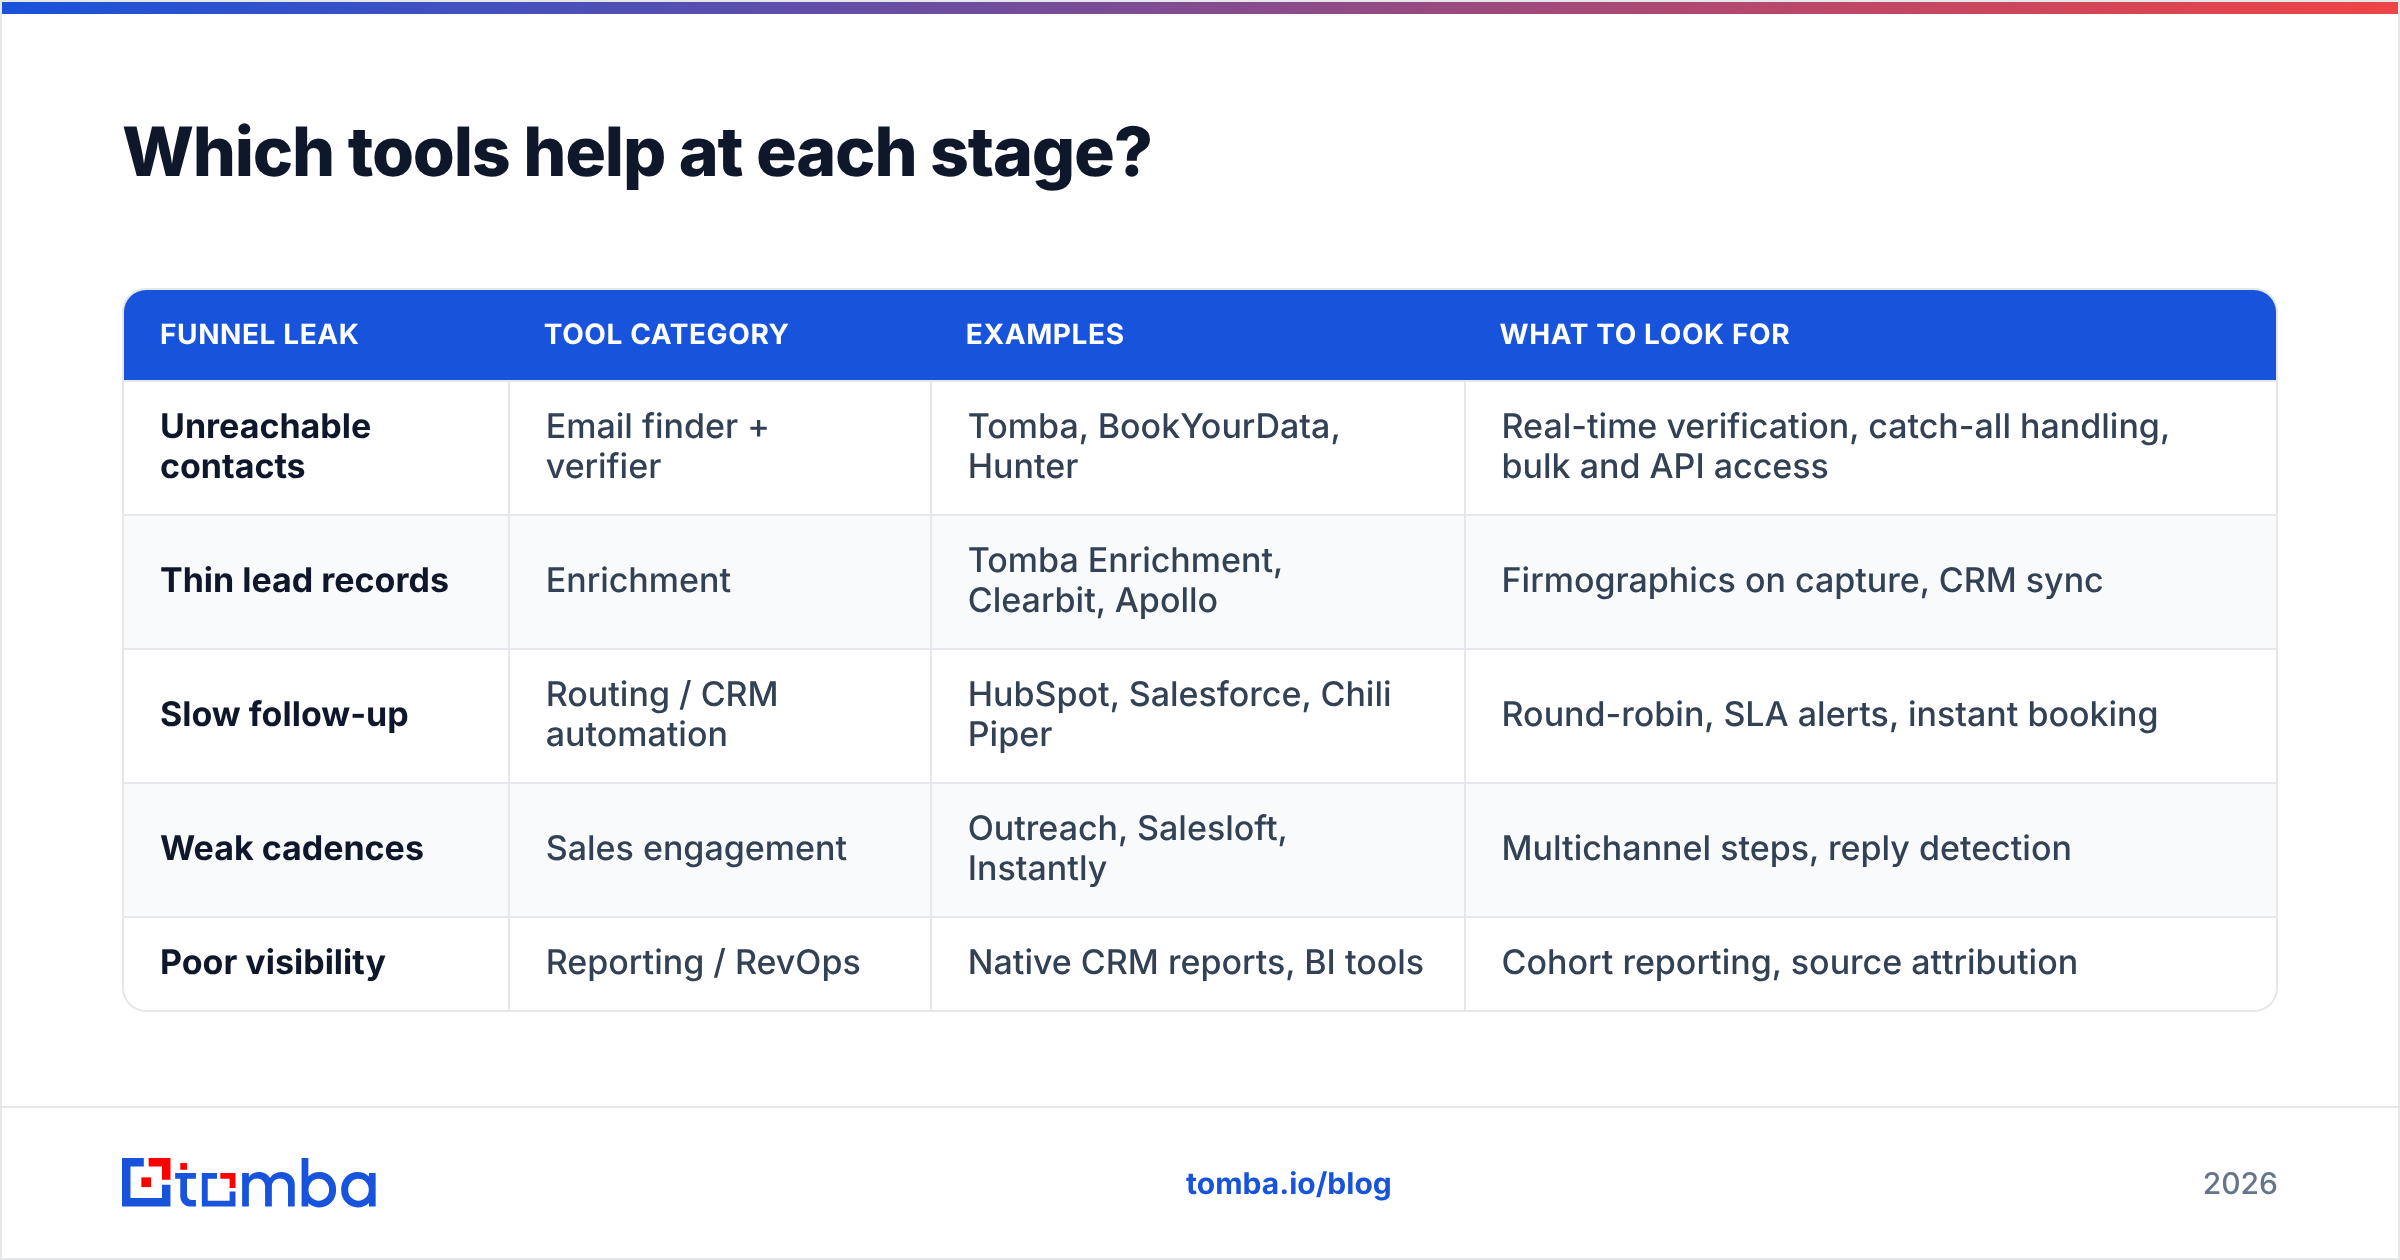
You don't need a large stack to move this metric. Match each tool to the specific leak you found.
| Funnel leak | Tool category | Examples | What to look for |
|---|---|---|---|
| Unreachable contacts | Email finder + verifier | Tomba, BookYourData, Hunter | Real-time verification, catch-all handling, bulk and API access |
| Thin lead records | Enrichment | Tomba Enrichment, Clearbit, Apollo | Firmographics on capture, CRM sync |
| Slow follow-up | Routing / CRM automation | HubSpot, Salesforce, Chili Piper | Round-robin, SLA alerts, instant booking |
| Weak cadences | Sales engagement | Outreach, Salesloft, Instantly | Multichannel steps, reply detection |
| Poor visibility | Reporting / RevOps | Native CRM reports, BI tools | Cohort reporting, source attribution |
BookYourData is a solid option if you want pre-built, filterable B2B lists with verified contacts. Tomba fits teams that need to find and verify emails for specific named accounts and domains, including through the API and CRM integrations. Plenty of teams use a list provider and a finder/verifier together.
Peer reviews on sites such as G2 are worth a skim before you buy. Pay particular attention to comments about data freshness in your target region, since accuracy varies a lot by geography.
How should you report lead to opportunity conversion rate?#
A dashboard that actually changes behavior usually contains:
- Cohort rate by month, with a 90-day conversion window and immature cohorts clearly marked.
- Split by source (outbound, inbound organic, paid, events, referrals, partners).
- Split by segment (SMB vs. mid-market vs. enterprise), because enterprise leads often convert at lower rates but carry larger deals.
- Split by response time, to show the payoff from speed-to-lead.
- Paired with opportunity → win rate, so nobody gets credit for inflating the top of pipeline.
Review it monthly with marketing and sales leaders in the same room. Look for trend changes of two or more points in either direction, then dig into one source at a time.
Frequently asked questions#
Is lead to opportunity conversion rate the same as MQL to SQL rate?#
No. MQL to SQL measures qualification. Lead to opportunity measures pipeline creation. Many companies treat SQL and opportunity as the same stage, which makes the two numbers match. If your process separates them, the opportunity rate will be lower.
How long should the conversion window be?#
Use roughly 1.5–2× your median time from lead to opportunity. For most SMB and mid-market SaaS, 60–90 days covers the large majority of conversions. Enterprise may need 120–180 days.
Should outbound and inbound be reported together?#
Only as a secondary blended view. They behave so differently that a blended number mostly reflects your channel mix rather than your execution.
Can a conversion rate be too high?#
Yes. A rate far above your peers often means opportunities are being created too early, before real qualification. Check whether win rate and average opportunity age are getting worse at the same time.
Where should you start?#
Pull your last two quarters of leads, split them by source, and compute a 90-day cohort rate for each. Then check the bounce rate and the contact coverage on the lowest-converting source. In most teams, that's where the quickest gains are, because reps are working leads they can't reach.
If your outbound or account-based leads are stuck at the low end of the range, start with the data layer. Tomba Email Finder finds professional email addresses by name, domain, or company and verifies them before they go into a sequence, so every lead your team works is one they can actually reach. You can test it on the free tier (25 searches a month), then compare plans on the Tomba pricing page once you've measured the lift in your own funnel.
Related guides#
// get started
Find, verify and enrich your first contacts today
Start on the free plan with 25 searches a month, then scale when your team is ready.
Free plan · No credit card required · GDPR & CCPA
// about the author