Lead Velocity Rate: How to Calculate, Benchmark, and Grow It
Lead velocity rate shows whether next quarter's revenue is on track before that revenue lands. Here is the formula, realistic benchmarks, and how to keep the number honest.

TL;DR
- Lead velocity rate (LVR) is the month-over-month growth rate of your qualified leads. The formula is (this month's qualified leads − last month's) ÷ last month's × 100.
- It's a leading indicator. Revenue tells you what already happened. LVR tells you what your pipeline will probably look like in one or two quarters.
- LVR is not sales velocity. Sales velocity measures how fast deals turn into money. LVR measures how fast your supply of qualified demand is growing.
- The metric only means something if "qualified" is defined strictly and stays the same from month to month. Otherwise you are measuring noise.
- To raise LVR sustainably, grow the qualified top of funnel: tighter ICP targeting, verified contact data, and faster lead routing. Buying bigger lists doesn't get you there.
What is lead velocity?#
Lead velocity is the growth rate of qualified leads over time, usually measured month over month. Its formal name is lead velocity rate (LVR). SaaS investor Jason Lemkin of SaaStr made it popular as a metric that predicts future revenue better than current revenue does.
Here's why. Monthly recurring revenue, bookings, and closed-won deals all describe work that finished weeks or months ago. By the time revenue flattens, the pipeline problem behind it is already a quarter old. LVR sits upstream. If qualified leads stop growing in March, revenue will usually show it in June or July, depending on your sales cycle.
The formula:
LVR = (Qualified leads this month − Qualified leads last month) ÷ Qualified leads last month × 100
Example: last month you generated 200 qualified leads and this month you generated 230.
(230 − 200) ÷ 200 × 100 = 15% LVR
That single number tells you whether the engine that feeds your sales team is speeding up, holding steady, or stalling.
Why does lead velocity matter more than lead volume?#
Lead volume answers "how many?" Lead velocity answers "is it getting better?", and the second question is the one your board, your CRO, and your hiring plan depend on.
Say a team produces 500 leads every month for six months. The volume looks healthy, but LVR is 0%. If your revenue targets assume 40% year-over-year growth, a flat qualified-lead count means one of three things has to happen:
- Win rates improve significantly
- Average deal size grows
- You miss the target
LVR shows that tension early. A flat or negative LVR is a warning you get months before the revenue miss shows up on a dashboard.
LVR also sets growth teams and sales teams on the same goal. Marketing can't hit its number by flooding the CRM with junk, because only qualified leads count. Sales can't blame "bad leads" when the qualification criteria were agreed on in advance.

How is lead velocity different from sales velocity and other pipeline metrics?#
This is the most common confusion in the category, and it matters, because the two metrics call for completely different fixes.
Sales velocity measures how quickly your pipeline turns into revenue:
Sales velocity = (Number of opportunities × Average deal size × Win rate) ÷ Sales cycle length (days)
Lead velocity rate measures how quickly your supply of qualified leads is growing. One is about throughput and the other is about growth.
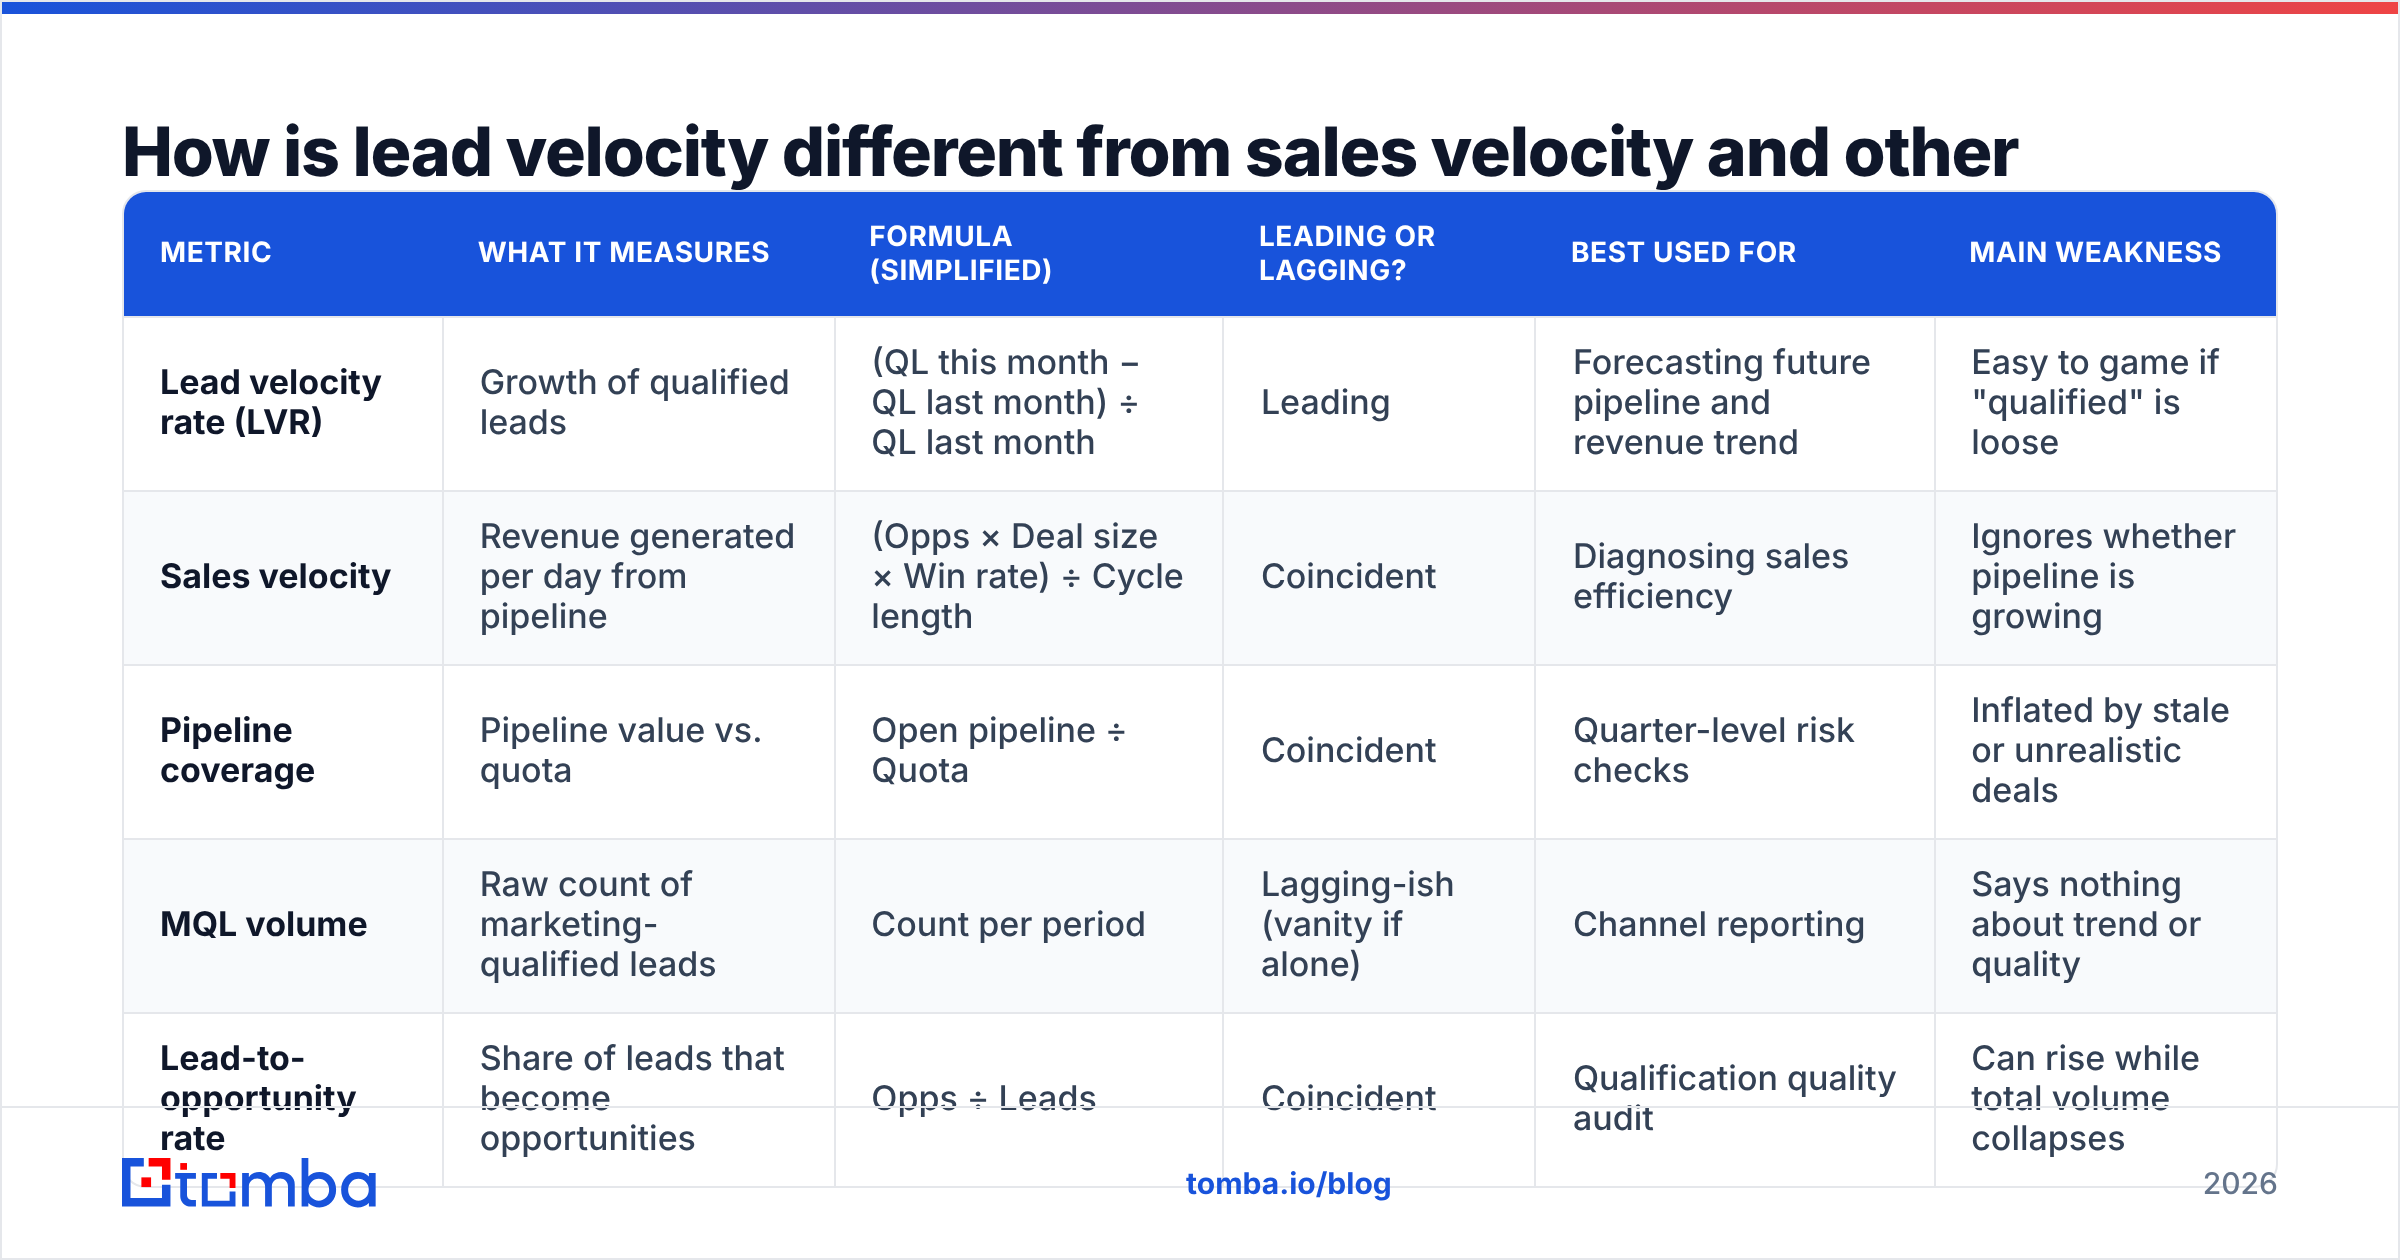
Here's how the four pipeline metrics RevOps teams usually track compare:
| Metric | What it measures | Formula (simplified) | Leading or lagging? | Best used for | Main weakness |
|---|---|---|---|---|---|
| Lead velocity rate (LVR) | Growth of qualified leads | (QL this month − QL last month) ÷ QL last month | Leading | Forecasting future pipeline and revenue trend | Easy to game if "qualified" is loose |
| Sales velocity | Revenue generated per day from pipeline | (Opps × Deal size × Win rate) ÷ Cycle length | Coincident | Diagnosing sales efficiency | Ignores whether pipeline is growing |
| Pipeline coverage | Pipeline value vs. quota | Open pipeline ÷ Quota | Coincident | Quarter-level risk checks | Inflated by stale or unrealistic deals |
| MQL volume | Raw count of marketing-qualified leads | Count per period | Lagging-ish (vanity if alone) | Channel reporting | Says nothing about trend or quality |
| Lead-to-opportunity rate | Share of leads that become opportunities | Opps ÷ Leads | Coincident | Qualification quality audit | Can rise while total volume collapses |
Here's how to read the table. If LVR is healthy but sales velocity is dropping, the problem is in your sales process (slow follow-up, weak discovery, pricing friction). If sales velocity is strong but LVR is flat, you have a demand-generation problem, and coaching reps harder won't fix it.
What counts as a "qualified" lead for LVR?#
This decision determines whether LVR is useful or just decoration. Lemkin's original framing counts qualified leads, not raw form fills. Most teams use one of these definitions:
- Marketing-qualified lead (MQL). A lead that meets fit and engagement thresholds. See the marketing qualified lead definition if your team hasn't formalized one.
- Sales-accepted lead (SAL). An MQL a rep has reviewed and accepted. It's stricter and harder to inflate.
- Sales-qualified lead (SQL). A lead that passed discovery and has budget, need, and timing. It's the most predictive, but volumes are small and noisy for early-stage teams.
- Meetings booked with ICP accounts. A popular outbound-first variant. It's simple and hard to fake.
Pick one, write down the criteria, and don't change them mid-year. If you tighten your MQL definition in Q3, your LVR will crash that month even if nothing real changed. When you do have to change definitions, restate the historical months under the new criteria before comparing.
A practical rule: use the most downstream definition that still gives you at least 50–100 leads a month. Below that, one conference or one viral LinkedIn post will swing the percentage wildly.
What is a good lead velocity rate?#
There's no universal benchmark, and anyone quoting a precise industry average without a source is guessing. Some grounded rules of thumb:
- Your LVR should roughly match or exceed your target revenue growth rate. If you plan to grow revenue 3x this year, qualified leads have to grow at a similar pace unless you have credible plans to raise win rate or deal size.
- Early-stage B2B companies often aim for double-digit monthly LVR, because they're growing from a small base.
- Mid-market and enterprise teams with large existing pipelines usually see low single-digit monthly LVR. That can still be healthy when compounded: 3% a month is about 43% a year.
- Negative LVR for one month is not a crisis. Negative LVR for three consecutive months is.
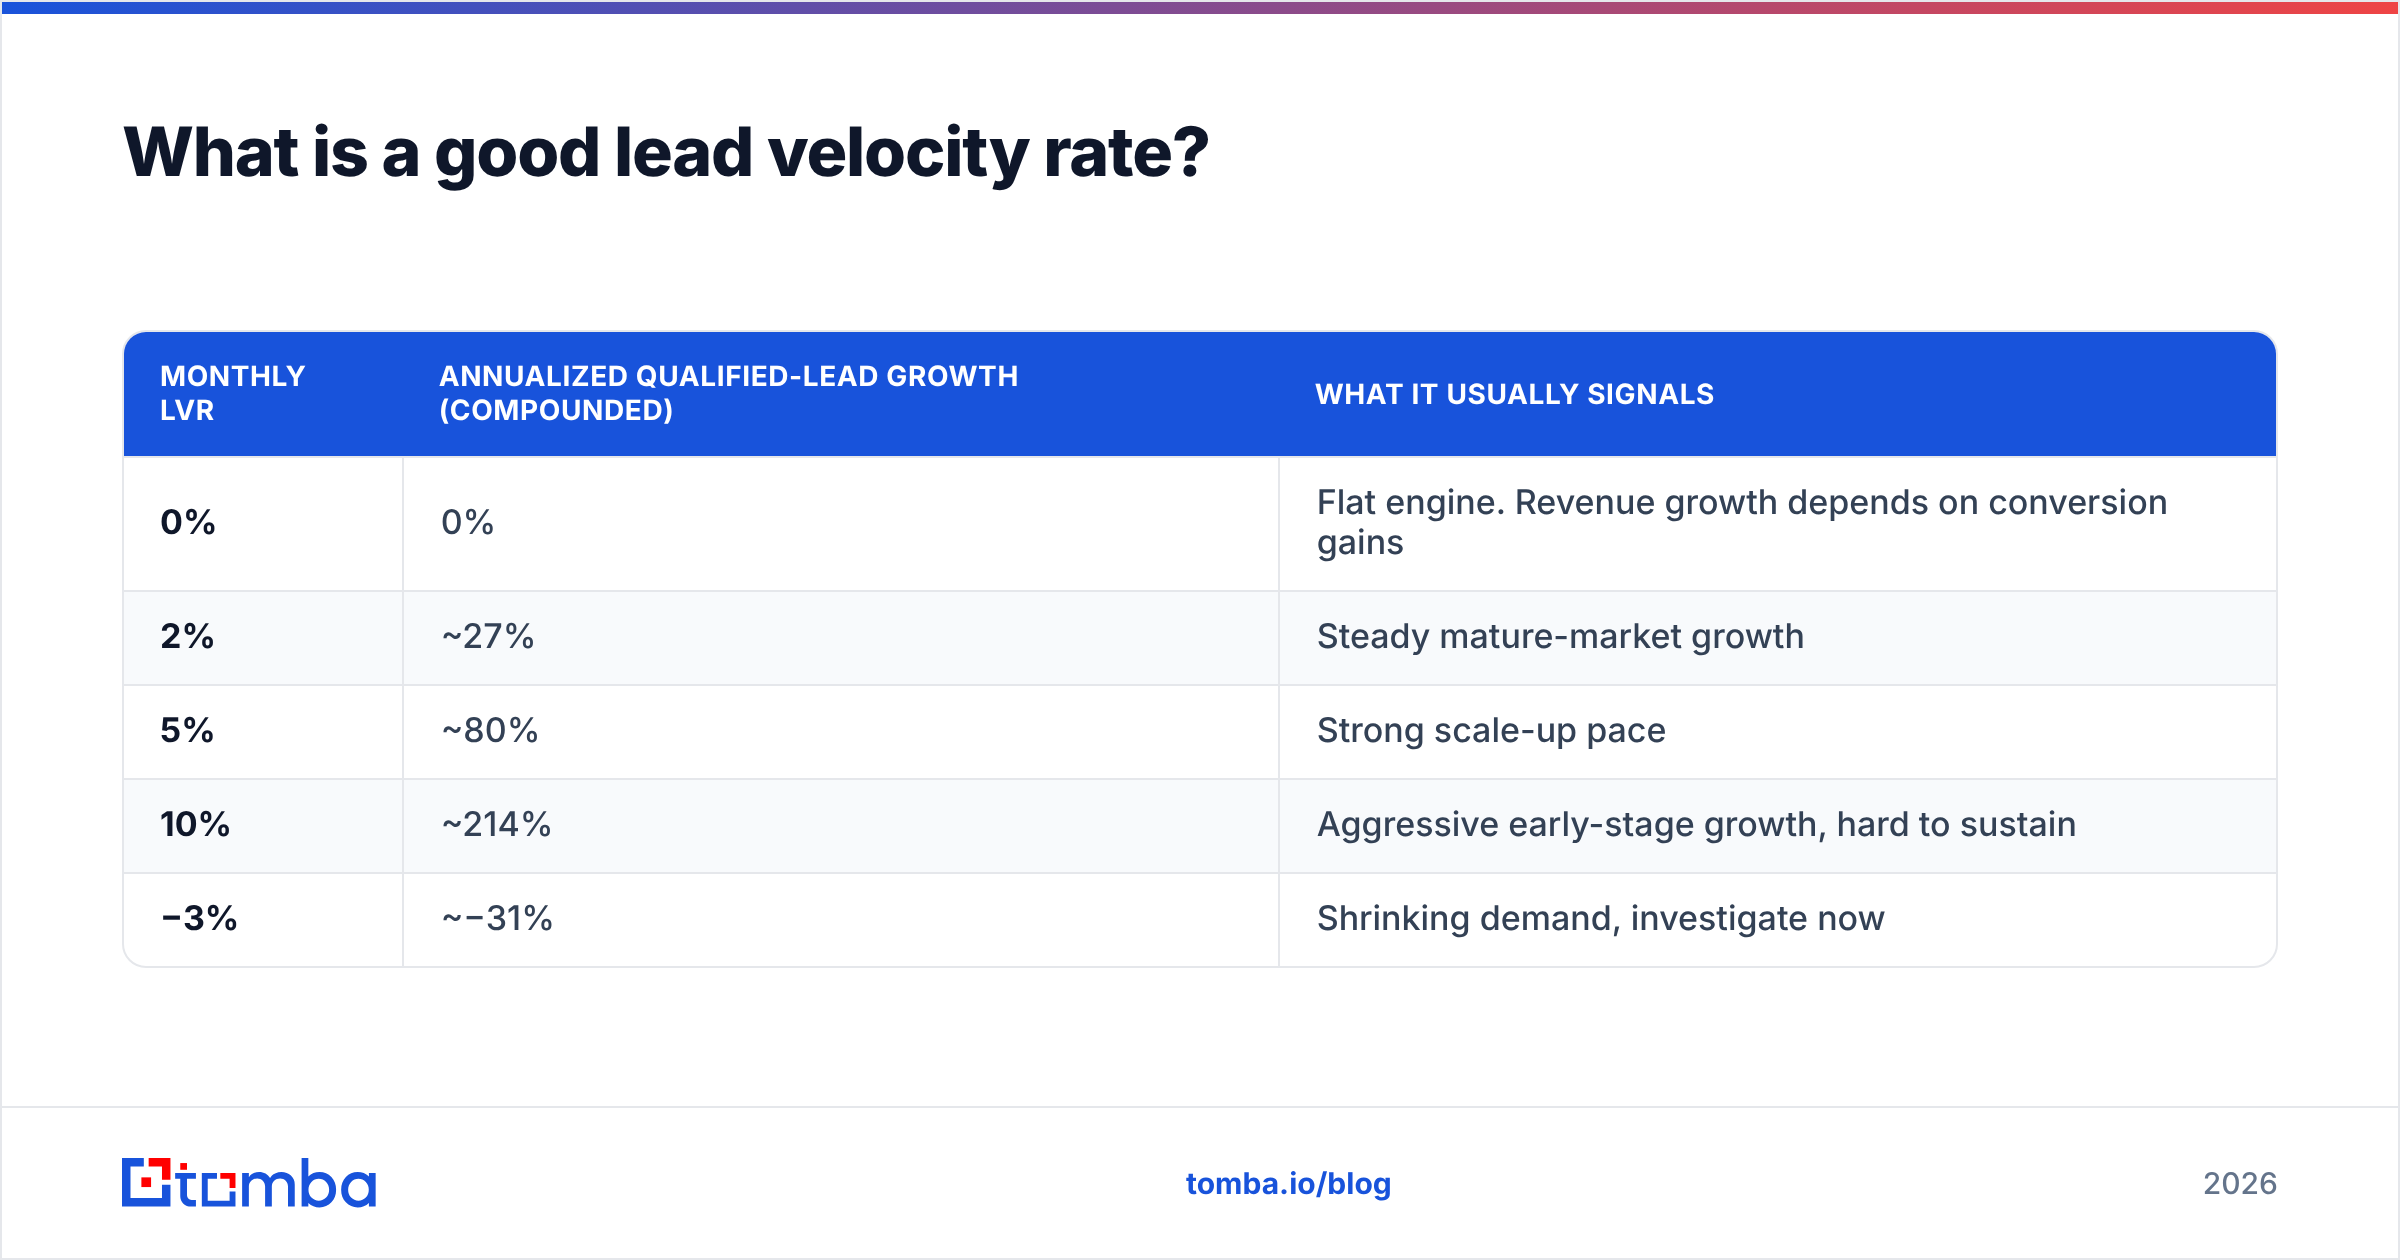
Compound growth is easy to underestimate. Monthly LVR adds up quickly:
| Monthly LVR | Annualized qualified-lead growth (compounded) | What it usually signals |
|---|---|---|
| 0% | 0% | Flat engine. Revenue growth depends on conversion gains |
| 2% | ~27% | Steady mature-market growth |
| 5% | ~80% | Strong scale-up pace |
| 10% | ~214% | Aggressive early-stage growth, hard to sustain |
| −3% | ~−31% | Shrinking demand, investigate now |
Always check LVR against a 3-month rolling average as well. Seasonality (December slowdowns, August in Europe, fiscal-year budget cycles) will distort single-month readings.
How do you calculate lead velocity correctly?#
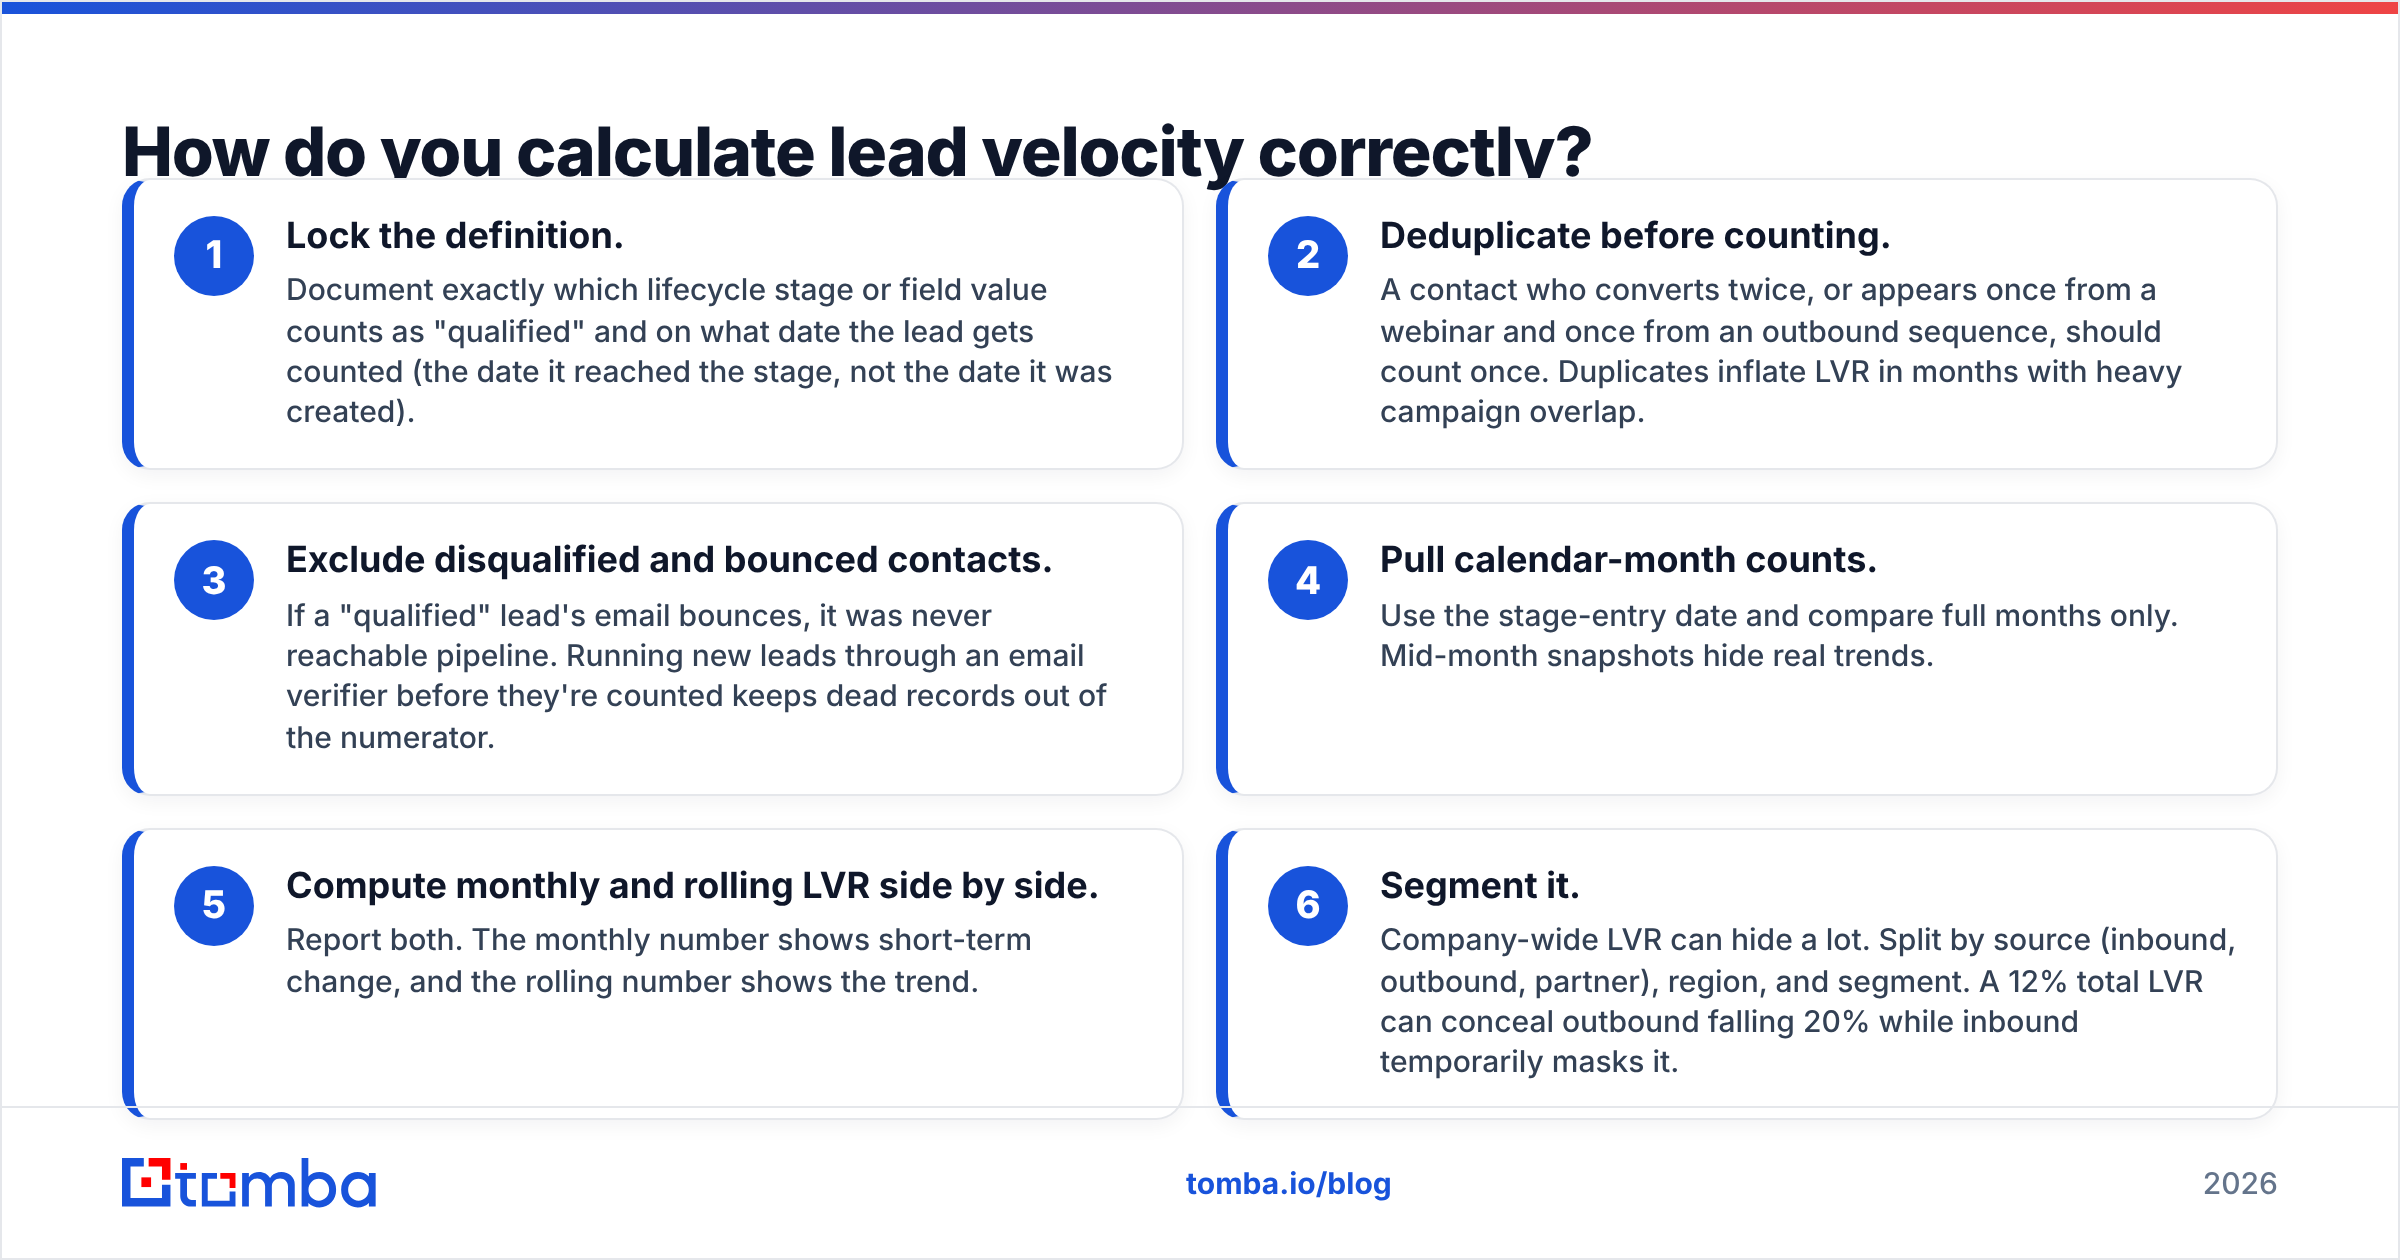
The math is easy. The data hygiene is harder. Here's a clean process that most CRMs support, whether you run HubSpot, Salesforce, or something lighter.
- Lock the definition. Document exactly which lifecycle stage or field value counts as "qualified" and on what date the lead gets counted (the date it reached the stage, not the date it was created).
- Deduplicate before counting. A contact who converts twice, or appears once from a webinar and once from an outbound sequence, should count once. Duplicates inflate LVR in months with heavy campaign overlap.
- Exclude disqualified and bounced contacts. If a "qualified" lead's email bounces, it was never reachable pipeline. Running new leads through an email verifier before they're counted keeps dead records out of the numerator.
- Pull calendar-month counts. Use the stage-entry date and compare full months only. Mid-month snapshots hide real trends.
- Compute monthly and rolling LVR side by side. Report both. The monthly number shows short-term change, and the rolling number shows the trend.
- Segment it. Company-wide LVR can hide a lot. Split by source (inbound, outbound, partner), region, and segment. A 12% total LVR can conceal outbound falling 20% while inbound temporarily masks it.
What are the most common ways lead velocity lies to you?#
LVR is a simple ratio, so it's easy to manipulate, usually by accident. These are the traps worth watching:
- Loosening qualification. The quickest way to "grow" LVR is to lower the bar. You'll see the effect a quarter later, when opportunity conversion collapses. Always review LVR next to lead-to-opportunity rate.
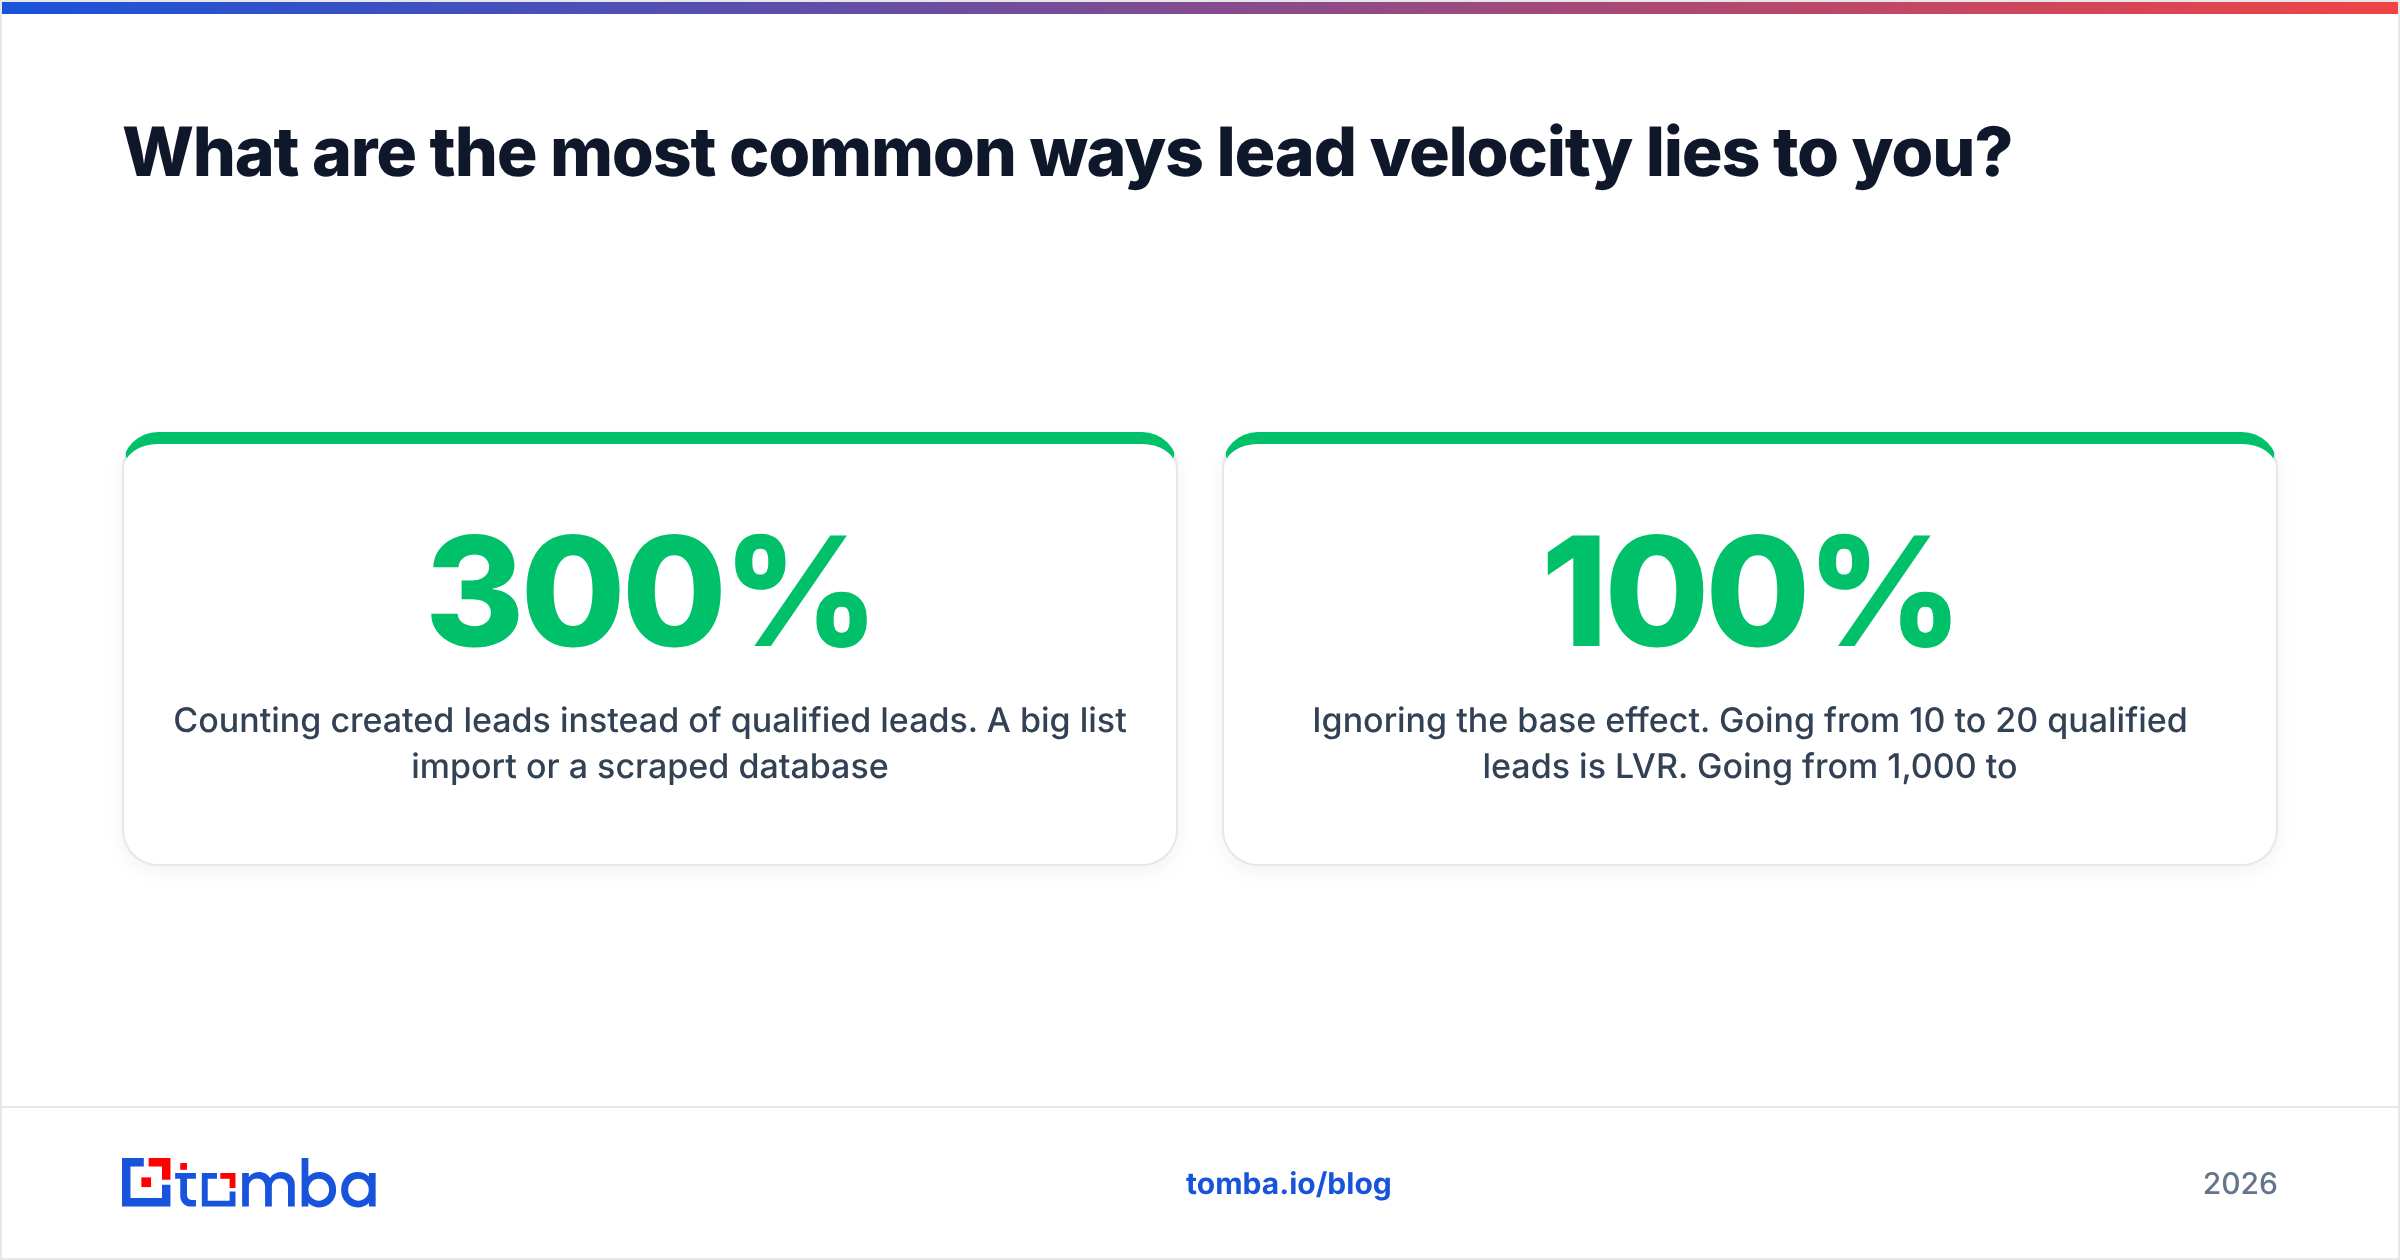
- Counting created leads instead of qualified leads. A big list import or a scraped database dump can push created leads up 300% in a month without adding real pipeline.
- Ignoring the base effect. Going from 10 to 20 qualified leads is 100% LVR. Going from 1,000 to 1,050 is 5%. The second is almost always more impressive. Show absolute numbers next to the percentage.
- Double-counting across channels. When marketing and SDR teams both claim the same lead, it can get counted in both reports. Settle attribution before the numbers reach a board slide.
- Stale contact data. A large share of B2B contact records go out of date every year as people change jobs. Leads that looked qualified at capture turn into bounces by the time sales follows up.

How can you increase lead velocity without lowering quality?#
Raising LVR the right way means adding more qualified demand, not more records. These are the levers that tend to work, roughly in order of how quickly they show up in the metric.
1. Tighten your ICP before scaling outreach. You get better LVR from a narrower, well-defined target list than from a broad one. Define firmographics (industry, headcount, tech stack, funding stage) and buying-committee roles, then build lists only against that definition.
2. Reach the right person, not the generic inbox. Outbound-sourced qualified leads depend on connecting with actual decision-makers. Sending to info@ addresses doesn't count. Tools that find email addresses for named people at target domains, then verify them, turn account lists into reachable contacts. For inbound, data enrichment fills in company size, role, and seniority so your scoring model can qualify leads accurately instead of guessing from a job title field.
3. Cut speed-to-lead. A qualified lead that waits two days for a response often goes cold before anyone counts it as accepted. Route leads automatically by territory and segment, and set SLAs for first touch. Faster routing mostly shows up in SAL- and SQL-based LVR.
4. Add channels, then measure them separately. Partner referrals, webinars, review sites like G2, and targeted outbound each have their own LVR curve. Tracking them separately tells you which channel to double down on and which is propping up a weak overall number.
5. Recycle nurtured leads deliberately. Leads that were "not now" six months ago are a real source of new qualified leads if you re-engage them with a relevant trigger such as new funding, a new hire, or a tech change. Define the requalification rule so recycled leads aren't counted twice.
6. Fix data decay at the source. Re-verify contacts in your nurture database on a schedule. Clean data won't raise LVR by itself, but it stops the metric from being inflated by leads that were never reachable.
How should RevOps report lead velocity?#
LVR works best as part of a small, consistent scorecard. On its own it gets gamed. A simple monthly view many revenue operations teams use:
| Scorecard line | Why it sits next to LVR |
|---|---|
| Qualified leads (absolute) | Prevents base-effect illusions |
| LVR (monthly + 3-month rolling) | The growth signal |
| Lead-to-opportunity rate | Catches qualification drift |
| Sales velocity | Shows whether pipeline converts efficiently |
| Pipeline coverage for next quarter | Connects LVR to the forecast |
| LVR by source | Shows which engine is growing |
Review it monthly with marketing, SDR, and sales leadership in the same room. When LVR drops, the first question is "which segment and which source?" The second is "did our definition or data quality change?" Only after those two should you conclude that demand is actually softening.
Is lead velocity rate right for every business?#
Mostly, with caveats:
- Enterprise sales with very long cycles. Monthly LVR can be too noisy when you close a handful of large deals a year. Use quarterly LVR and a stricter definition, such as qualified opportunities at target accounts.
- Product-led growth. Consider tracking the velocity of product-qualified leads (PQLs) rather than MQLs, since signup behavior is more predictive than form fills.
- Seasonal businesses. Compare against the same month last year (year-over-year LVR) as well as month-over-month.
In each case the principle holds: measure how fast your qualified demand is growing, define it strictly, and read it alongside conversion metrics.
Ready to grow the qualified side of your funnel?#
Lead velocity rises when more of the right people enter your pipeline, and outbound only produces qualified leads when you can actually reach the decision-makers on your target accounts. Tomba Email Finder finds professional email addresses by name, domain, or company and verifies them before they reach your CRM, so the leads you count are leads your team can contact. You can start on the free plan with 25 searches a month, or move to Starter at $49/mo when you're ready to scale outbound. See the full Tomba pricing to pick the plan that fits your pipeline targets.
Related guides#
Ready to find emails that actually work?
Join 150,000+ professionals who stopped guessing and started sending. Free credits on signup — no credit card required.
Get the Tomba newsletter
Practical outbound tactics and product updates — once every two weeks.
About the author