Leading Indicators vs Lagging Indicators Sales Guide (2026)
Lagging indicators tell you the quarter is dead. Leading indicators tell you it's dying with three weeks left to fix it. Here's how to build a sales scorecard that does both.
The leading indicators vs lagging indicators sales debate comes down to one test: can you still change the number in front of you? If yes, it is leading. If no, it is lagging. Everything else is bookkeeping.
TL;DR
- Lagging indicators (closed revenue, win rate, quota attainment) measure results that already happened. You cannot change them. You can only explain them.
- Leading indicators (qualified meetings booked, multithreading depth, stage-conversion velocity) measure the behaviors and pipeline signals that cause those results 30–90 days later.
- Most sales teams over-index on lagging metrics because they're easy to pull from the CRM — and then get blindsided in week 11 of a 13-week quarter.
- A working scorecard needs both: 3–5 leading indicators reviewed weekly, 3–4 lagging indicators reviewed monthly or quarterly.
- Leading indicators are only as good as your data. Garbage contact data inflates "activity" metrics while producing zero pipeline — which is why contact accuracy is itself a leading indicator.
Leading indicators vs lagging indicators sales metrics: what's the difference?#
Here's the analogy that makes it stick: lagging indicators are the bathroom scale. Leading indicators are what's on your plate and how many times you went to the gym this week.
The scale tells you the truth, but it tells you late. By the time it moves, the decisions that moved it happened weeks ago. The food log and the gym check-ins tell you today whether next month's number will be good — and you can still change them.
In sales, the same split holds:
- Lagging indicators are outcomes. Closed-won revenue, quota attainment, average deal size, customer acquisition cost, churn. They are accurate, auditable, and completely un-actionable at the moment you read them.
- Leading indicators are inputs and early signals. Qualified discovery calls booked, number of stakeholders engaged per opportunity, days-in-stage, proposal-to-verbal conversion, reply rate on outbound sequences. They're noisier, but they're the only metrics you can still influence.
- The gap between them is your lag window. If your average sales cycle is 60 days, the leading indicators you watch today explain the revenue you'll book roughly two months from now.
- Lagging indicators are for accountability. Leading indicators are for coaching. Telling a rep "your win rate is 18%" is a verdict. Telling them "you're single-threaded on 7 of your 9 open deals" is a plan.
The practical failure mode: a VP of Sales opens the forecast dashboard, sees revenue tracking to 71% of plan with three weeks left, and asks the team to "push harder." Nothing in that dashboard tells anyone what to push. The leading indicators would have flagged the shortfall back in week four. Meetings booked a month earlier. Stalled deals at proposal stage. Accounts with only one contact. Back then, there was still time to build pipeline.
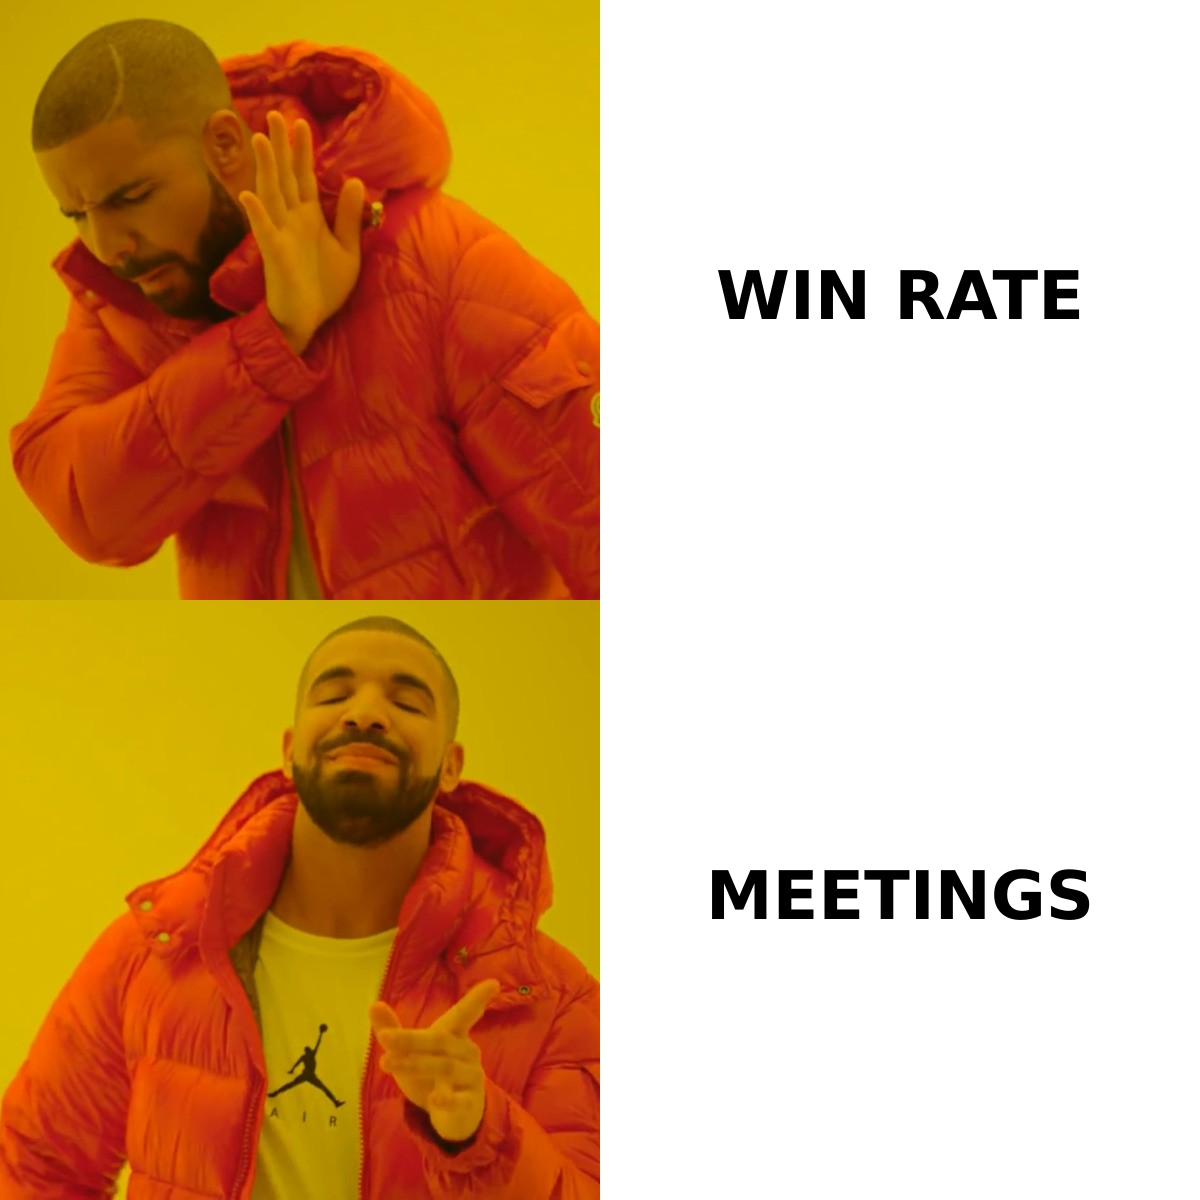
Which sales metrics are leading and which are lagging?#
Most metrics sort cleanly once you ask one question: can I still change this number with an action I take today? If yes, it's leading. If no, it's lagging.
| Metric | Type | Update frequency | Who acts on it | Can you still influence it? |
|---|---|---|---|---|
| Closed-won revenue | Lagging | Monthly / quarterly | CRO, finance | No |
| Quota attainment % | Lagging | Monthly | Sales management | No |
| Win rate | Lagging | Quarterly | Enablement, RevOps | No — but it diagnoses |
| Average deal size | Lagging | Quarterly | Pricing, leadership | No |
| Sales cycle length | Lagging | Quarterly | RevOps | No |
| Qualified meetings booked | Leading | Weekly | AEs, SDRs | Yes |
| Stakeholders engaged per deal | Leading | Weekly | AEs | Yes |
| Outbound reply rate | Leading | Weekly | SDRs, ops | Yes |
| Days in current stage | Leading | Daily | AEs, managers | Yes |
| Contact data accuracy (bounce rate) | Leading | Weekly | RevOps, ops | Yes |
| Proposals sent | Leading | Weekly | AEs | Yes |
| Pipeline coverage ratio | Leading | Weekly | Sales management | Yes |
Two entries on that table usually cause arguments, so let's settle them.
Pipeline coverage ratio is leading, not lagging. Coverage (open pipeline ÷ quota remaining) is a forward-looking ratio. If it drops below roughly 3x with a full quarter ahead, you still have time to fix it with prospecting. Read it in week 10 and it's effectively lagging — the lag window closed.
Win rate is lagging but diagnostically leading. You can't change last quarter's win rate. But segment it — by source, by segment, by whether the deal was multithreaded — and it becomes a hypothesis generator for next quarter. Win rate is where lagging analysis feeds leading behavior.
Why do sales teams over-rely on lagging indicators?#
Three reasons, and none of them are stupidity.
First, lagging data is clean. Closed revenue is a single field with a single owner and no ambiguity. "Qualified meeting" needs a definition, enforcement, and an audit. Someone has to check whether reps log no-budget discovery calls as qualified. Clean data wins default fights.
Second, lagging indicators are what leadership is measured on. The board asks about bookings, not about multithreading depth. So the reporting stack gets built for the board. The frontline inherits a dashboard designed for a different audience.
Third, leading indicators decay into vanity metrics if you don't maintain them. "Calls made" and "emails sent" are technically leading — they precede outcomes. But they only track revenue if the calls reach real humans and the emails reach real inboxes. Set a target on raw activity volume and reps will optimize for volume. Gartner's research on sales analytics lands on the same point: metrics drive behavior. Pick the wrong metric and you get the wrong behavior, fast.
This is the quiet trap. A team hits 120% of its activity target and 60% of its pipeline target, and nobody can explain the gap. Then someone pulls the bounce report: 22% of the outbound list was invalid. The activity metric was real. It just wasn't leading anything.
What makes a good leading indicator?#
A leading indicator earns its place on the scorecard when it passes four tests:
- Predictive. It tracks a downstream lagging outcome in your data, not in a benchmark deck. Run the numbers before you commit. Multithreading predicts win rate in enterprise deals. It barely matters in $4k self-serve.
- Actionable within the week. If a rep can't change the number through Monday-to-Friday behavior, it's not coachable. "Market conditions" is predictive and useless.
- Hard to game. "Meetings booked" gets gamed by booking unqualified meetings. "Meetings booked that reached stage 2" is much harder to fake, because it requires a second party's agreement.
- Cheap to measure. If the metric costs a rep 20 minutes of admin a day, you'll get compliance for three weeks and noise afterwards. Pull from systems, not from self-reporting, wherever possible.
Applied to a typical B2B outbound motion, the leading set usually shrinks to five metrics:
- Qualified meetings held (not booked — held, with a second-stage outcome logged)
- New opportunities created, split by source
- Stakeholders engaged per open opportunity — a proxy for deal durability
- Stage-to-stage conversion within the last 30 days — catches degradation early
- Deliverable contact rate — the percentage of your outbound list that reaches a real inbox
That last one gets skipped constantly, and it quietly poisons everything above it. If your list is 78% deliverable, every activity metric is inflated by about a quarter, and your response rate denominators are wrong. Run lists through an email verifier before the sequence starts. That is not a deliverability chore. It is what makes your other leading indicators mean something.
How do you build a sales scorecard with both?#
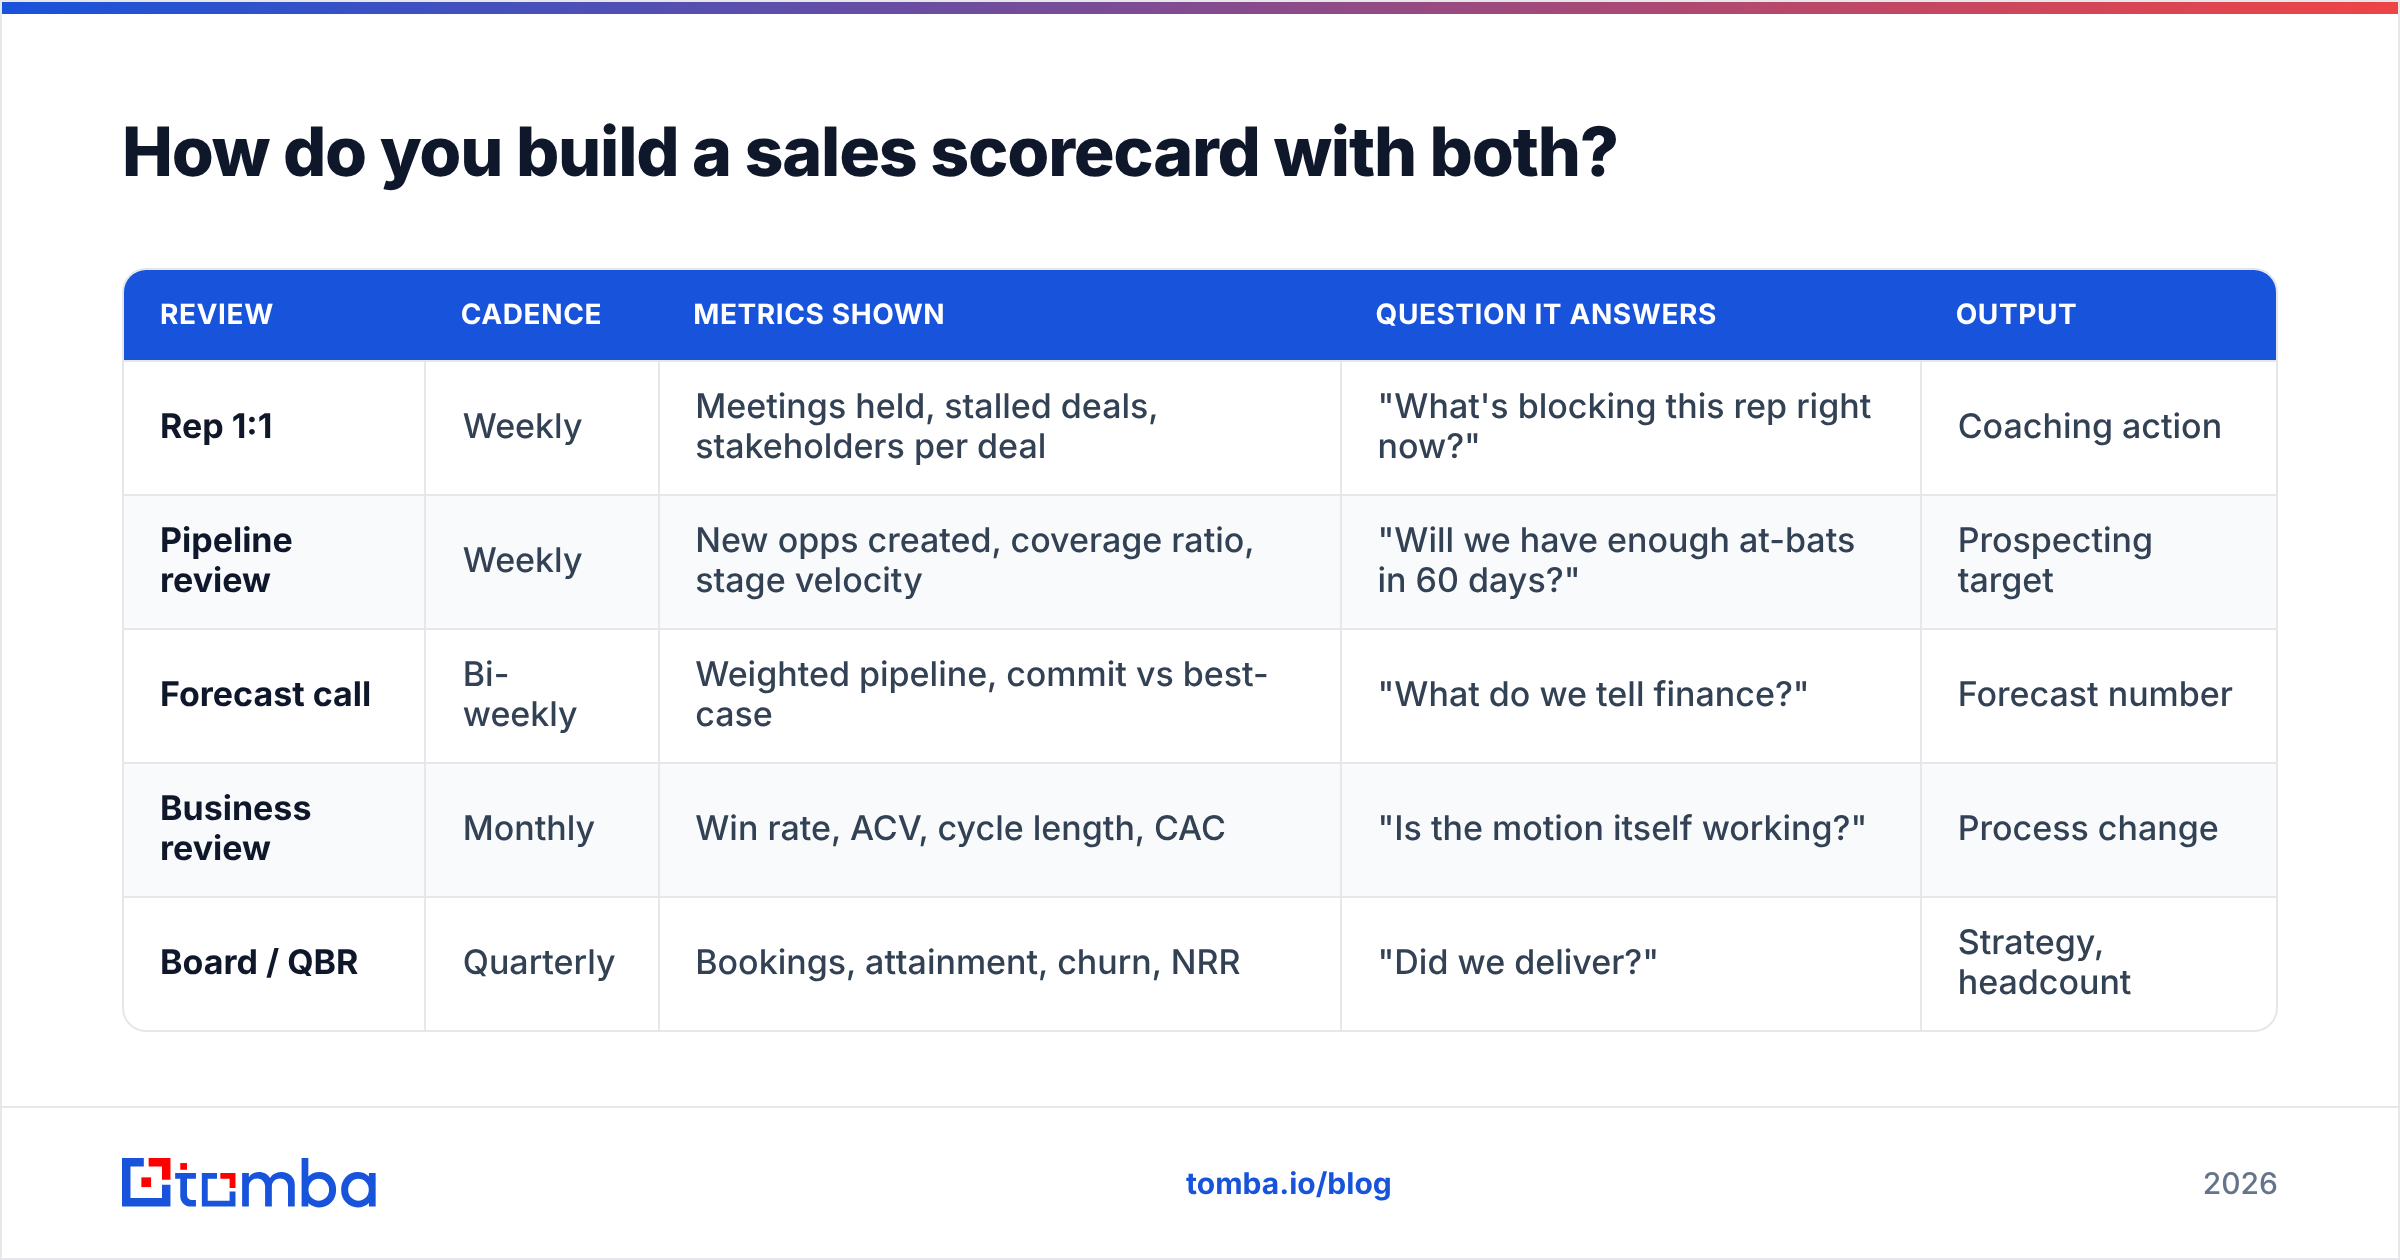
Structure it by cadence, not by department. A leading indicators vs lagging indicators sales scorecard is really a meeting schedule. The rhythm is what makes it work.
| Review | Cadence | Metrics shown | Question it answers | Output |
|---|---|---|---|---|
| Rep 1:1 | Weekly | Meetings held, stalled deals, stakeholders per deal | "What's blocking this rep right now?" | Coaching action |
| Pipeline review | Weekly | New opps created, coverage ratio, stage velocity | "Will we have enough at-bats in 60 days?" | Prospecting target |
| Forecast call | Bi-weekly | Weighted pipeline, commit vs best-case | "What do we tell finance?" | Forecast number |
| Business review | Monthly | Win rate, ACV, cycle length, CAC | "Is the motion itself working?" | Process change |
| Board / QBR | Quarterly | Bookings, attainment, churn, NRR | "Did we deliver?" | Strategy, headcount |
Notice the inversion: the further up the org chart, the more lagging the metrics, and the longer the interval. That's correct. A CRO who checks daily activity dashboards has a broken management layer, not extra diligence.
Three rules keep the scorecard honest:
Rule 1 — pair every lagging indicator with the leading one that drives it. Win rate pairs with multithreading and discovery-call quality. Cycle length pairs with days-in-stage. Bookings pair with opportunity creation 60 days prior. If a lagging metric has no leading partner, you have no lever.
Rule 2 — never set a target on a leading indicator without a quality gate. "50 emails/day" is a target. "50 emails/day to verified contacts at ICP-fit accounts" is a target with a gate. The gate is the whole difference.
Rule 3 — recalibrate quarterly. Leading indicators drift. A signal that predicted revenue in a cheap-money market may predict nothing in a committee-heavy one. Re-run the numbers every quarter and drop anything that stopped working.
Which leading indicators matter most for outbound teams?#
Outbound has its own physics. You're manufacturing pipeline rather than harvesting demand, so the leading set shifts earlier in the funnel.
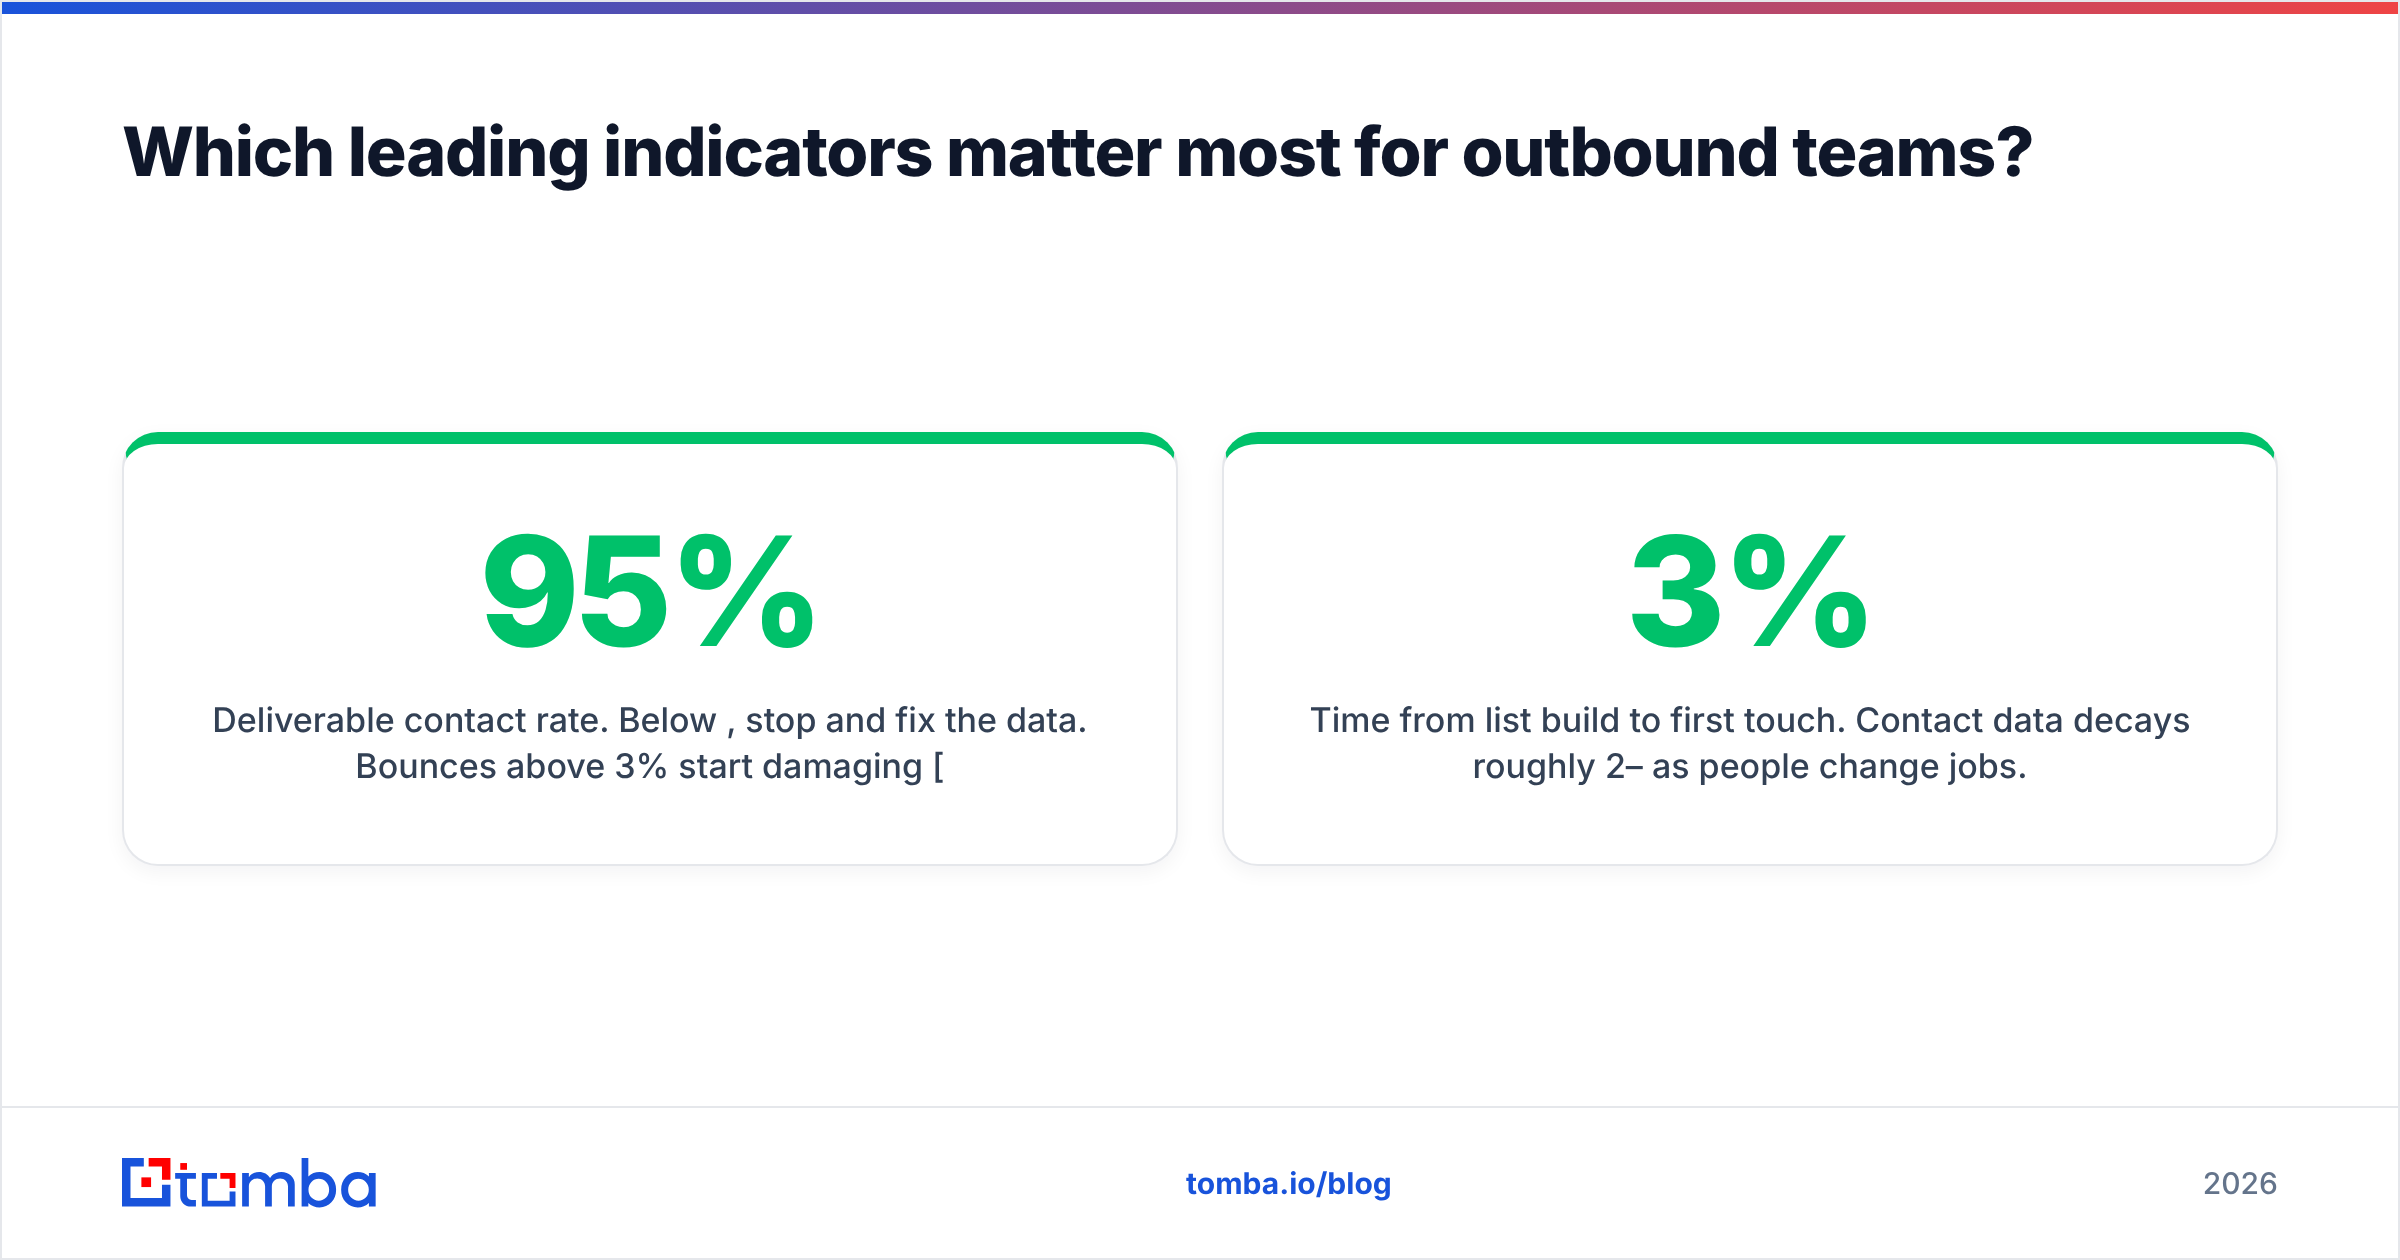
- Deliverable contact rate. Below 95%, stop and fix the data. Bounces above 3% damage sender reputation, which then depresses every downstream number for months.
- Account coverage depth. How many verified contacts do you hold per target account? One contact per account means one point of failure. Three to five, across functions, lets a sequence survive a job change. A domain search pass over your target list turns a single-name account into a mapped buying committee.
The next three are about timing and segmentation.
- Sequence-to-meeting conversion by segment. Aggregate conversion hides everything. Split by industry and company size, or you'll optimize for the wrong ICP.
- Time from list build to first touch. Contact data decays roughly 2–3% per month as people change jobs. A list built in January and mailed in April is much worse than the same list mailed in January.
- Opportunity creation lag. Days between first meeting and opportunity creation. Growing lag means qualification is slipping.
Two of these — deliverable rate and coverage depth — are data problems disguised as sales problems. Teams spend months coaching messaging while the contact file quietly caps their ceiling. HubSpot's benchmarking work on prospecting productivity keeps finding the same thing: reps lose a large share of the selling week to research and list hygiene, and that time never shows up on any dashboard.
If you want the data layer to stop being your bottleneck, the fix is boring and mechanical. Enrich the account list once. Verify before every send. Re-verify anything older than 90 days. Bulk verification makes that a scheduled job rather than a heroic effort.
How do you fix a scorecard that's all lagging indicators?#
Do it in four weeks, not four quarters.
Week 1 — inventory. List every metric currently reviewed by anyone. Tag each one leading or lagging using the "can I change it today?" test. Most teams find an 80/20 lagging split.
Week 2 — pick the pairs. For each of your top three lagging metrics, name the single leading indicator most likely to drive it. Don't pick five. Pick one per lagging metric, so accountability stays legible.
Week 3 — instrument. Make sure the leading metric can be pulled automatically. If it needs rep self-reporting, either automate the capture or pick a different metric. Define the terms in writing — especially "qualified."
Week 4 — change the meeting. Put the leading indicators on the weekly agenda and move the lagging ones to monthly. This is the step teams skip, and skipping it means the new metrics live on a dashboard nobody opens.
One honest caveat: this works when your sales cycle is long enough for a lag window to exist. If you close deals in nine days, leading and lagging collapse into nearly the same thing. Spend your effort on volume and speed instead.
What tooling do you need to track leading indicators?#
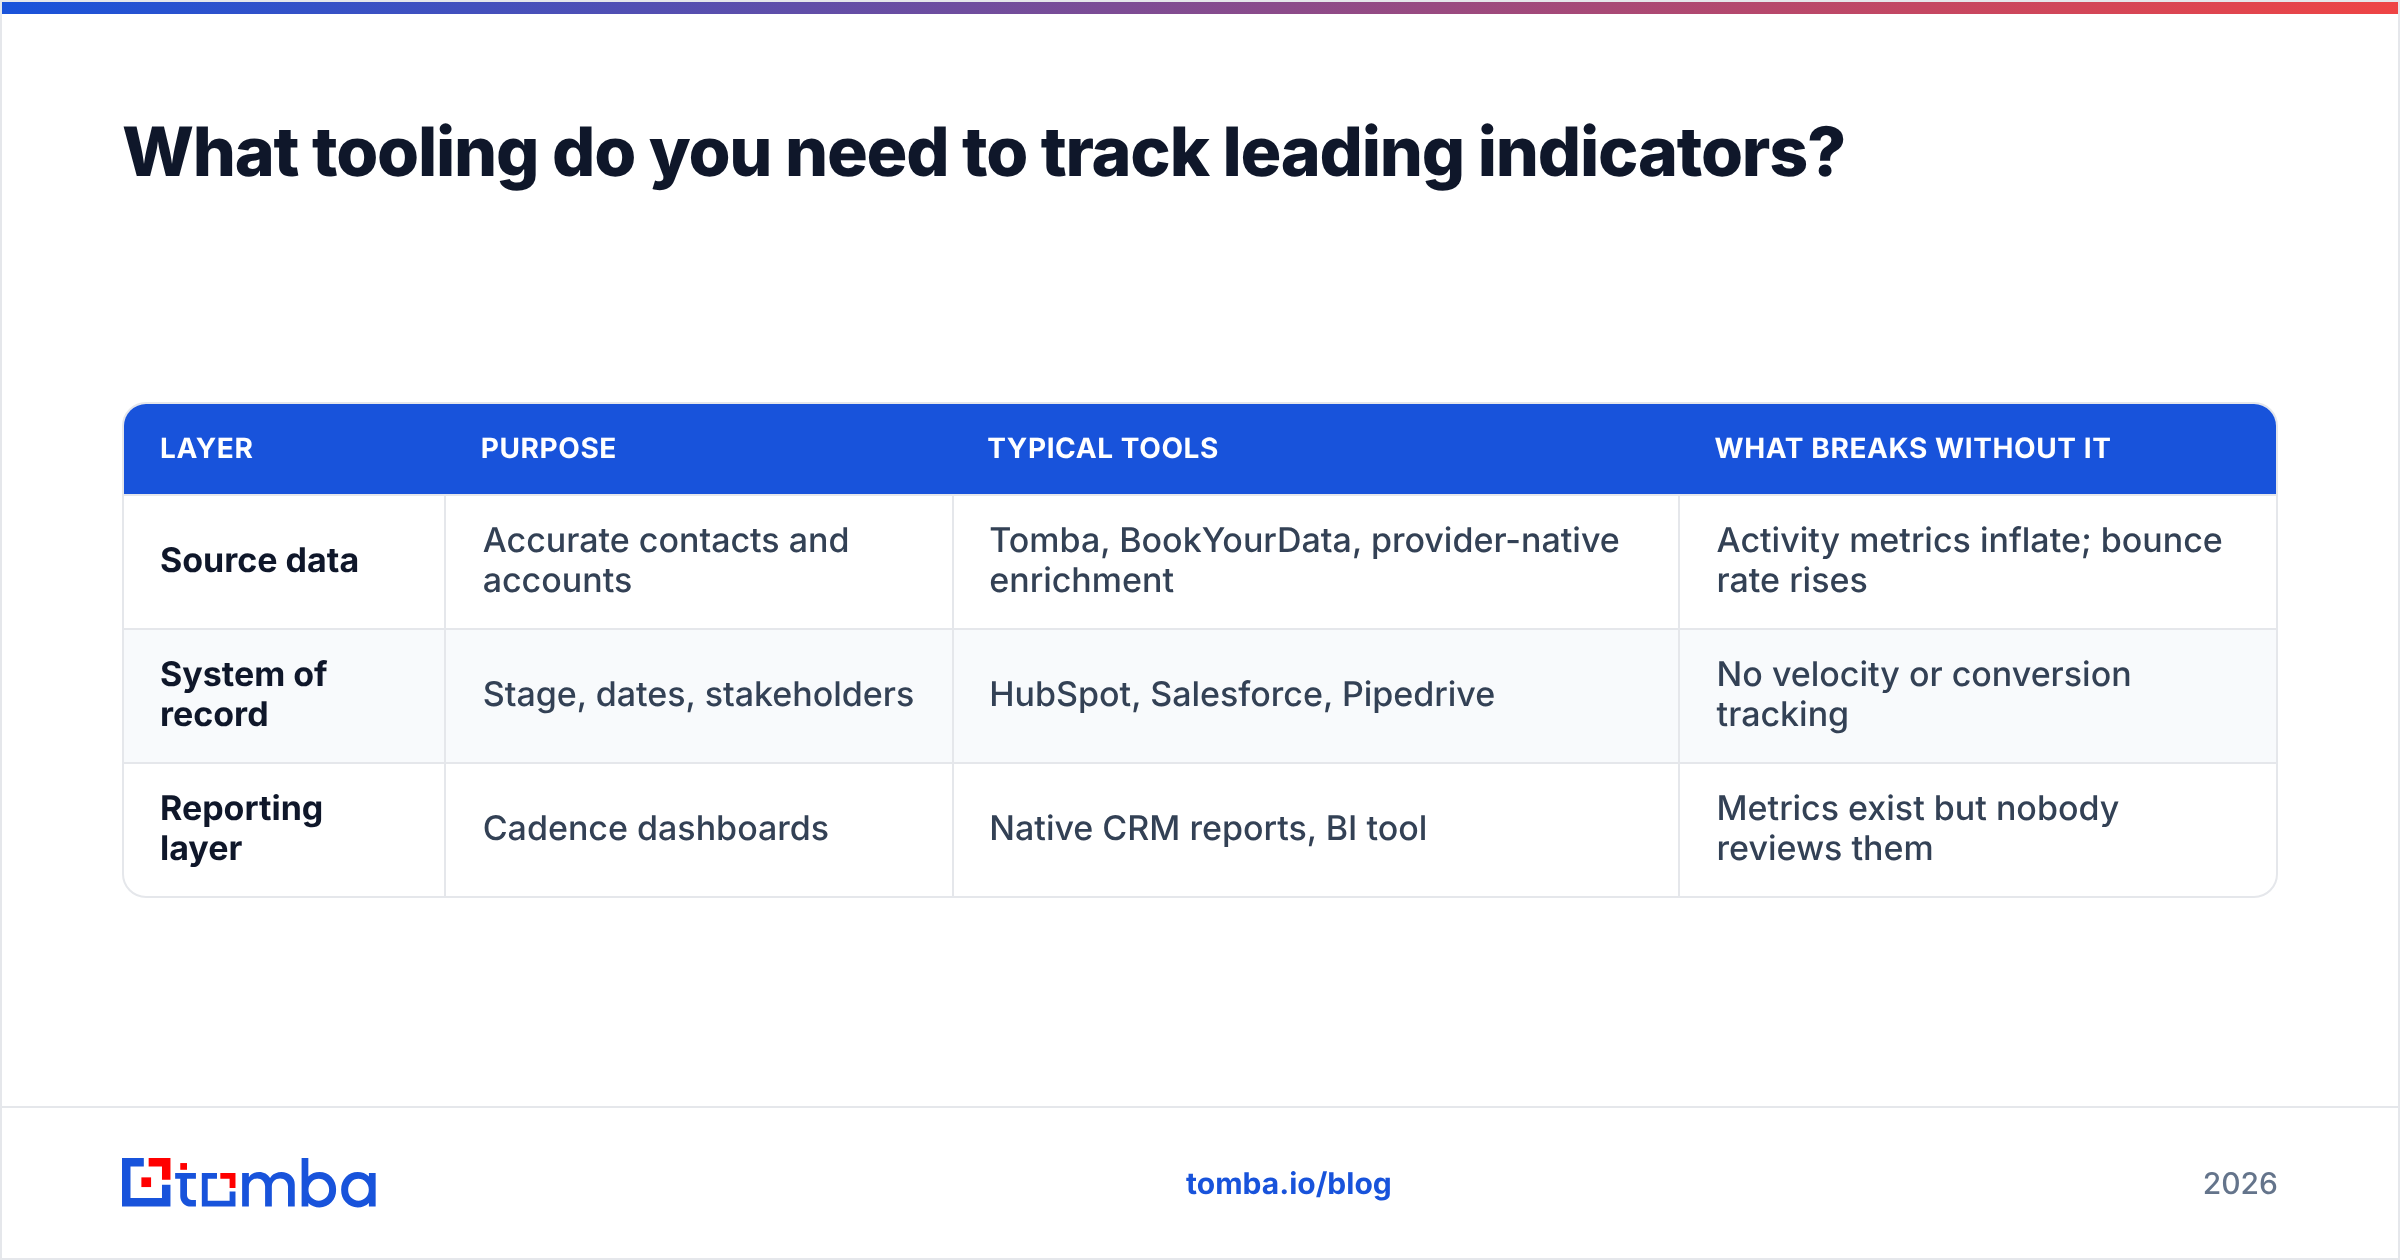
Less than vendors would like you to believe. The stack has three layers:
| Layer | Purpose | Typical tools | What breaks without it |
|---|---|---|---|
| Source data | Accurate contacts and accounts | Tomba, BookYourData, provider-native enrichment | Activity metrics inflate; bounce rate rises |
| System of record | Stage, dates, stakeholders | HubSpot, Salesforce, Pipedrive | No velocity or conversion tracking |
| Reporting layer | Cadence dashboards | Native CRM reports, BI tool | Metrics exist but nobody reviews them |
You do not need a dedicated revenue-intelligence platform to start. Native CRM reporting plus a clean contact file covers the first six months for most teams under 30 reps. Both Tomba and BookYourData solve the top layer well, from different angles. Tomba leans toward real-time finding and verification via API. BookYourData leans toward pre-built, human-verified lists. Pick based on whether you build lists continuously or in batches.
For the source layer specifically, Tomba pricing starts with a free tier at 25 searches/month, then $49/mo (Starter), $99/mo (Growth), and $249/mo (Pro). Verification and enrichment are included alongside finding. The Tomba API matters if you want deliverable contact rate to land on the weekly dashboard by itself, rather than as a manual export someone forgets to run.
Where should you start this week?#
Pick the one lagging metric you're most afraid of — probably bookings — and work backwards. That single move is the whole leading indicators vs lagging indicators sales exercise. Identify what has to be true 60 days before a booking happens: a qualified meeting, with a real stakeholder, at an ICP-fit account, reached through a valid inbox. Then measure those four things weekly and stop staring at the number you can't change.
The unglamorous truth is that leading indicators live or die on contact data quality. A scorecard built on a list where one in five emails bounces will produce confident, precise, wrong conclusions every week.
Start there. Run your target-account list through the Tomba Email Finder to build verified, multi-contact coverage per account. You'll get a deliverable contact rate worth putting on the dashboard, plus leading indicators that finally predict something. The free tier is enough to test the workflow on one segment.
Related guides#
// get started
Find, verify and enrich your first contacts today
Start on the free plan with 25 searches a month, then scale when your team is ready.
Free plan · No credit card required · GDPR & CCPA
Get the Tomba newsletter
Product and data updates
// about the author