Leads to Meetings Conversion Rate: Benchmarks and How to Raise It
Your leads to meetings conversion rate shows whether your pipeline is healthy or just busy. Here are 2026 benchmarks by channel, how to calculate the rate correctly, and the fixes that move it.
TL;DR
- Your leads to meetings conversion rate is the share of leads that turn into a held or booked sales meeting. Calculate it per channel, because a blended number hides problems.
- Typical 2026 ranges: inbound demo requests convert at 40–70%, content or MQL leads at 5–15%, and cold outbound at 1–5% of contacted prospects.
- Most low rates come from three places: bad contact data, slow follow-up, and loose lead qualification. Weak copy is usually a smaller factor.
- Before you rewrite a sequence, check bounce rates and speed-to-lead. Those two fixes usually lift the rate faster than anything else.
- Track "booked" and "held" separately. A booked meeting that no-shows is not pipeline.
What is the leads to meetings conversion rate?#
The leads to meetings conversion rate is the percentage of leads in a given period that turn into a sales meeting. That meeting is usually a discovery call, a demo, or an intro with an account executive.
Think of it like a restaurant's reservation book. Foot traffic past the window is your lead volume. Reservations are the meetings. A busy street doesn't help if nobody books a table, and a full reservation book doesn't help if half the parties never show up.
The basic formula:
Leads to meetings conversion rate = (Meetings in period ÷ Leads in period) × 100
If your SDR team worked 800 leads in March and booked 48 meetings, the rate is 6%.
The formula is easy. The hard part is agreeing on what goes into each side of it. That's where most teams get their benchmarks wrong.
How do you define "lead" and "meeting" so the number means something?#
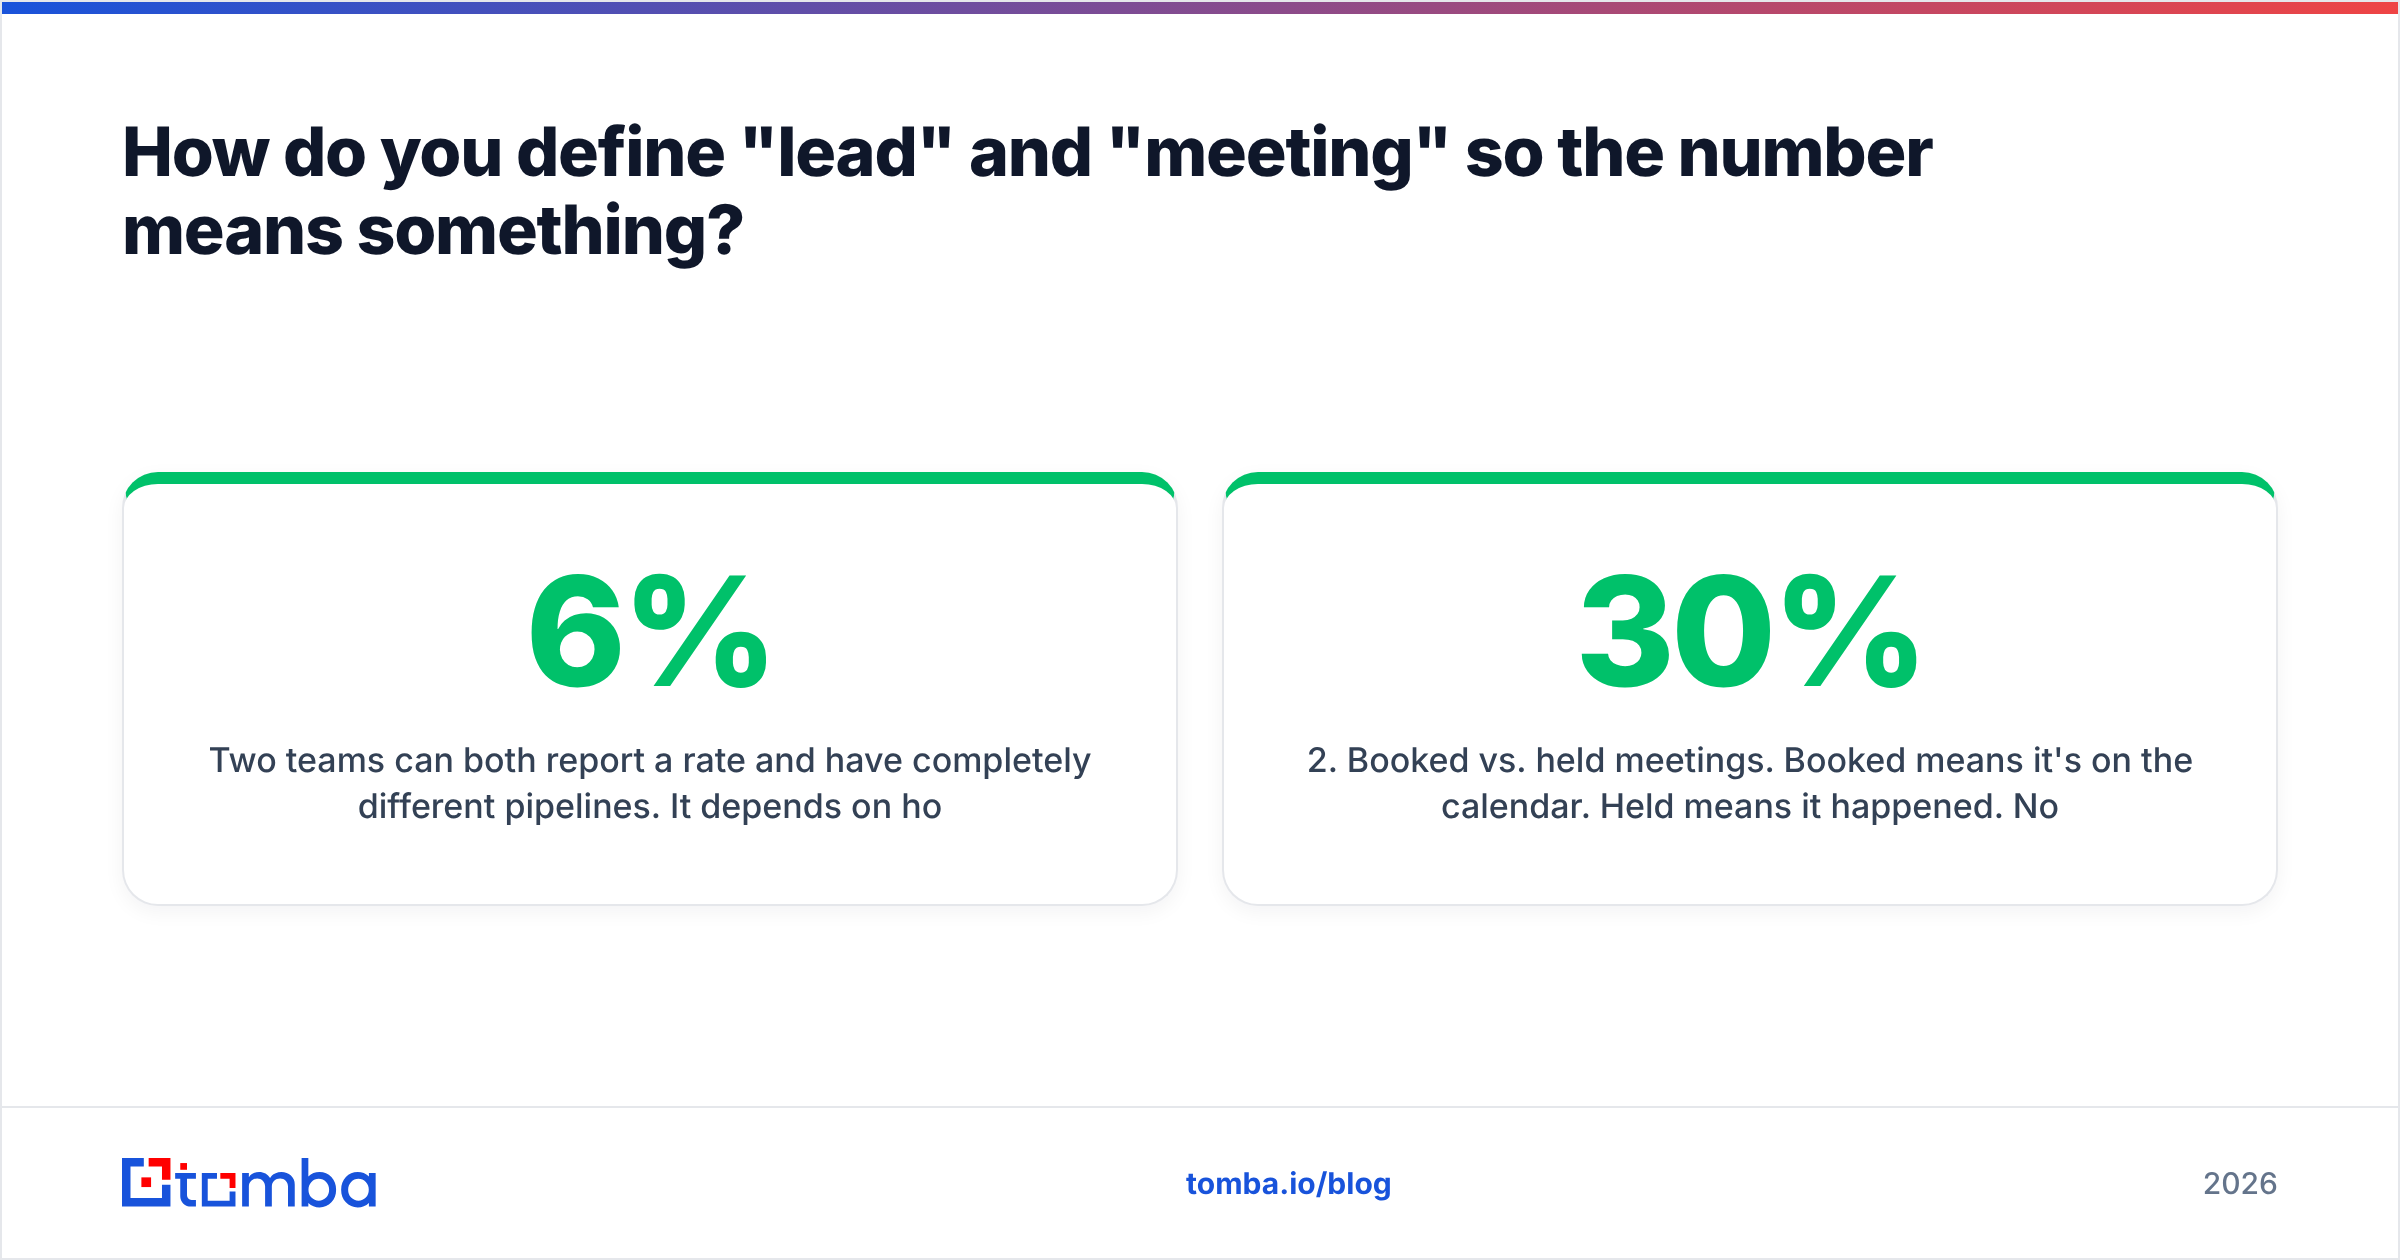
Two teams can both report a 6% rate and have completely different pipelines. It depends on how they define the inputs. Settle these four definitions before you compare anything:
- What counts as a lead. A raw contact on a list, a form fill, a marketing qualified lead (MQL), or a prospect who replied? Each one sits at a different funnel stage, and the rates can differ by 10x.
- Booked vs. held meetings. Booked means it's on the calendar. Held means it happened. No-show rates of 15–30% are common in outbound, so the gap matters.
- Attribution window. A lead created in January might book in March. Choose cohort-based tracking (the lead's creation month) or period-based tracking (meetings this month ÷ leads this month), and don't switch between them.
- Channel separation. Inbound, outbound, events, partner referrals, and paid social each convert differently. A blended rate goes up or down depending on channel mix, even when no channel's performance has changed.
Most CRMs can report this if you set up lifecycle stages and meeting objects correctly. HubSpot's CRM and Salesforce both let you build a funnel report from lead source to meeting activity. The report is only accurate if reps log meetings consistently.
What is a good leads to meetings conversion rate in 2026?#
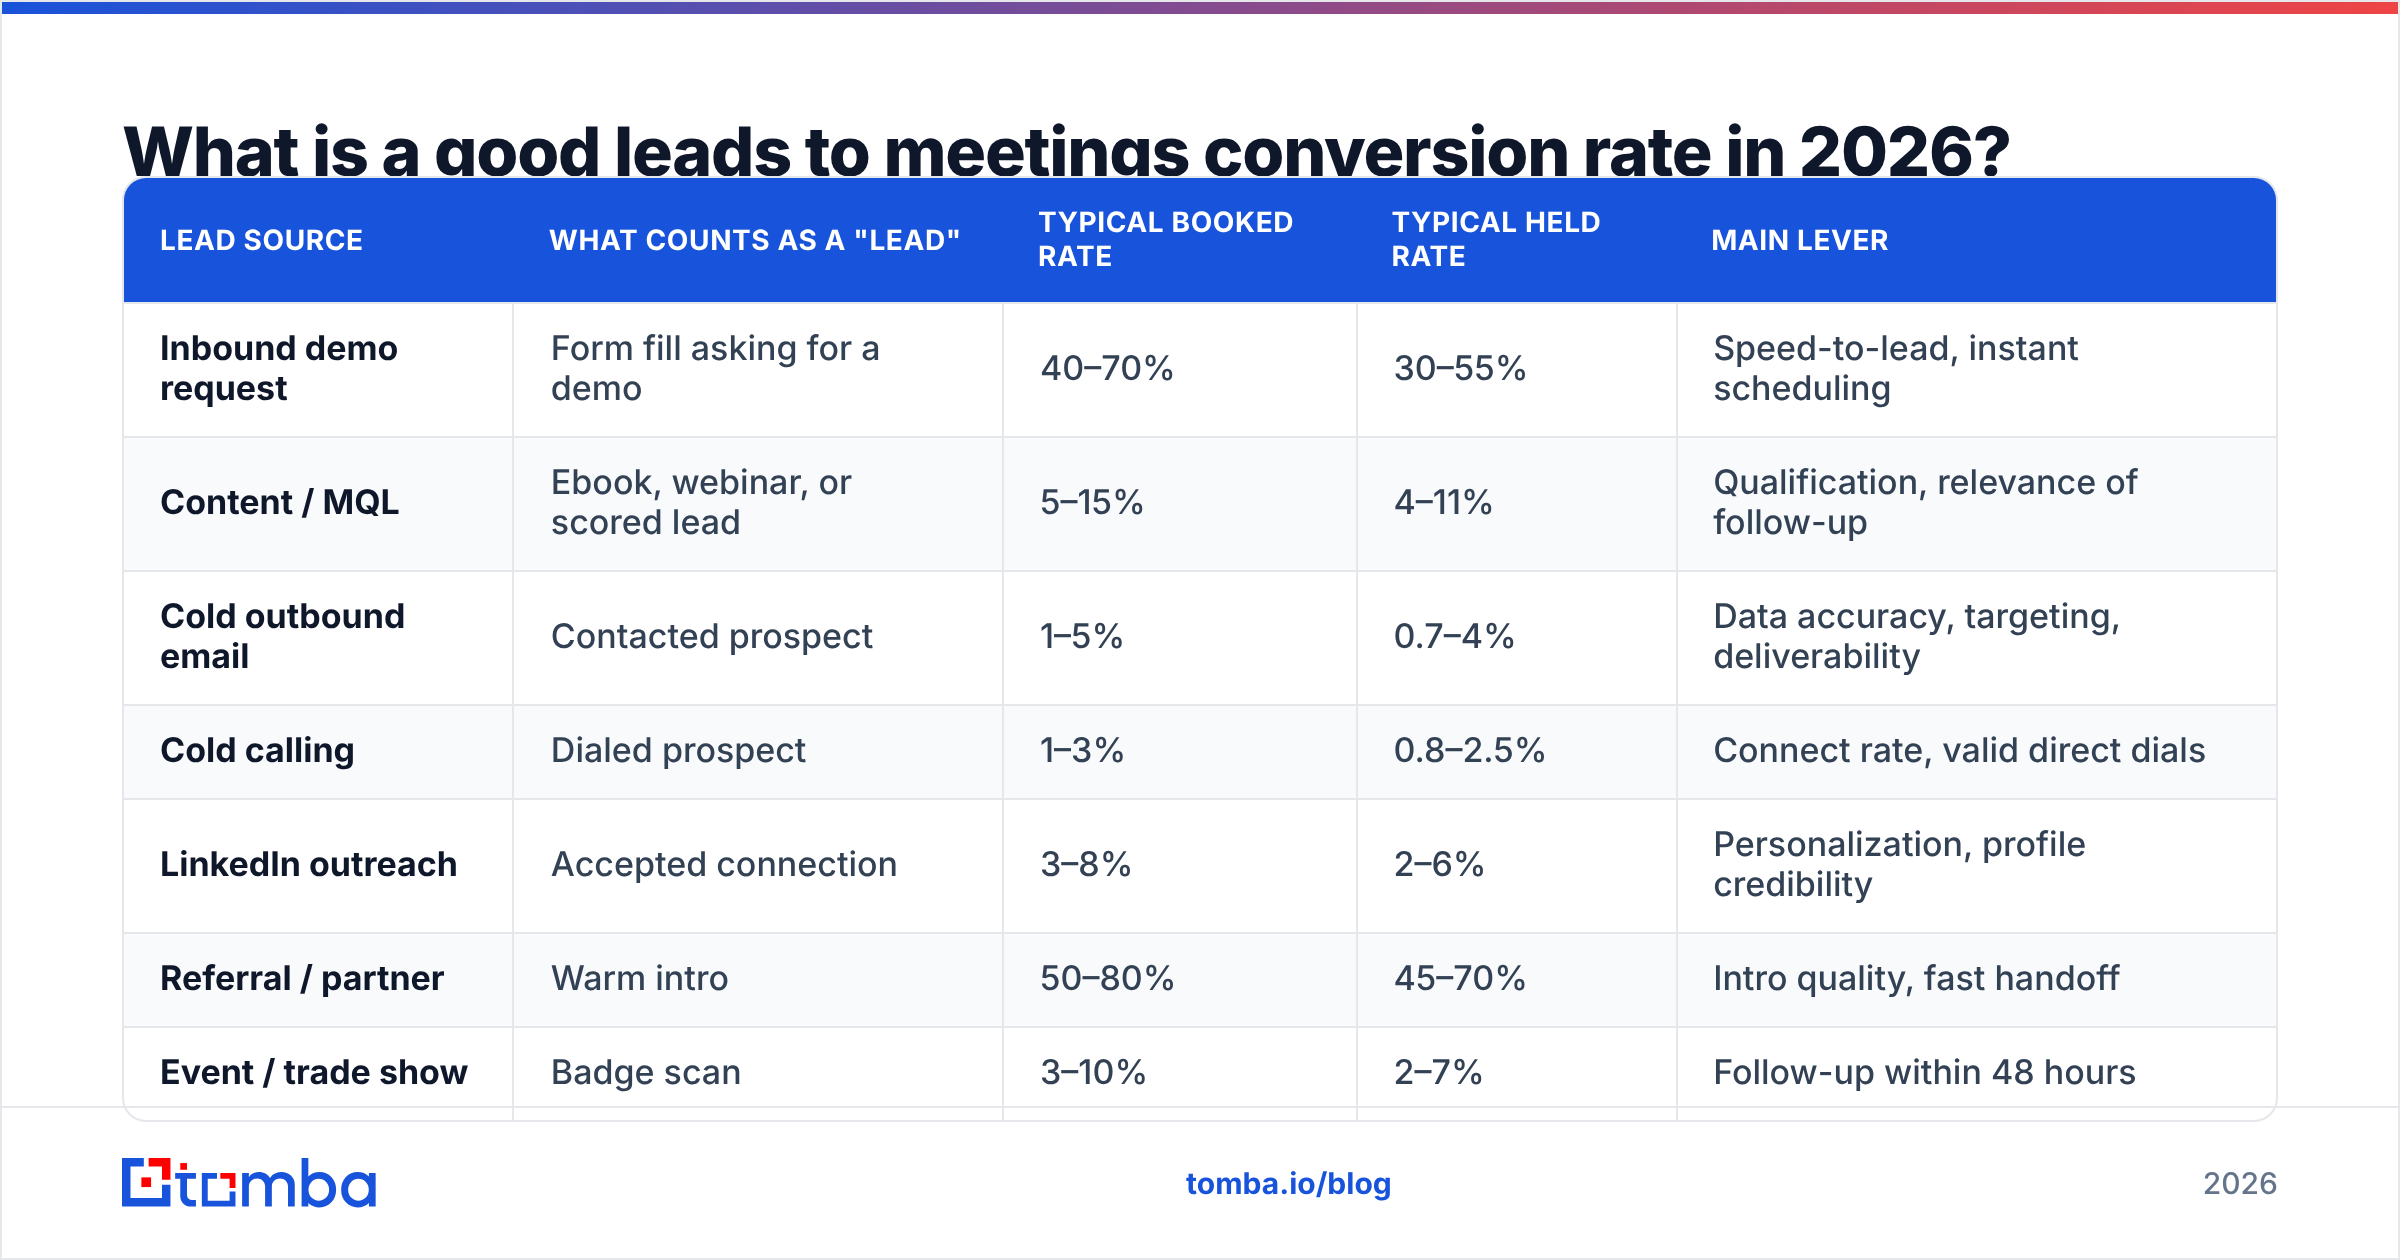
It depends on channel and lead type. The ranges below are typical for B2B SaaS and services teams selling mid-market deals. Treat them as a sanity check, not a target to copy.
| Lead source | What counts as a "lead" | Typical booked rate | Typical held rate | Main lever |
|---|---|---|---|---|
| Inbound demo request | Form fill asking for a demo | 40–70% | 30–55% | Speed-to-lead, instant scheduling |
| Content / MQL | Ebook, webinar, or scored lead | 5–15% | 4–11% | Qualification, relevance of follow-up |
| Cold outbound email | Contacted prospect | 1–5% | 0.7–4% | Data accuracy, targeting, deliverability |
| Cold calling | Dialed prospect | 1–3% | 0.8–2.5% | Connect rate, valid direct dials |
| LinkedIn outreach | Accepted connection | 3–8% | 2–6% | Personalization, profile credibility |
| Referral / partner | Warm intro | 50–80% | 45–70% | Intro quality, fast handoff |
| Event / trade show | Badge scan | 3–10% | 2–7% | Follow-up within 48 hours |
Some patterns stand out:
- Intent matters most. A demo request already expresses buying intent, so a 50% rate there is ordinary. A cold list has no intent, so 3% can be a strong result.
- Held rates trail booked rates everywhere. The gap is widest in outbound, where prospects agree to a call out of politeness and then skip it.
- The denominator in cold outbound is "contacted," not "sourced." If 20% of your sourced emails bounce, those contacts never had a chance to convert. Your rate looks worse, and the underlying problem is a data problem.
Why is your leads to meetings conversion rate low?#
When the number drops, teams usually rewrite their email copy first. Copy does matter, but it's rarely the root cause. Work through the funnel in order, because each stage caps the one after it.
Is your contact data actually reaching people?#
If emails bounce or land at a generic inbox nobody reads, the rest of the funnel doesn't matter. Symptoms:
- Hard bounce rate above 2–3% on cold campaigns
- Low open or reply signals across every template, including the good ones
- Many replies coming from info@ or sales@ addresses instead of named decision-makers
Bounces also hurt your sender reputation, which reduces inbox placement for every later send, including emails to valid contacts. Running lists through an email verifier before each campaign is one of the cheapest fixes available. It improves both the denominator and deliverability.
Are you following up fast enough?#
For inbound leads, response time decides most outcomes. A demo request that waits four hours for a reply competes with the two vendors who answered in five minutes. Signs of a speed problem:
- Inbound booked rate under 35%
- Median first-touch time measured in hours, not minutes
- Leads saying "we already went with someone else" on the first call
Are you qualifying before you chase?#
When an SDR team works every MQL with the same intensity, effort spreads thin. Leads that match your ideal customer profile (company size, industry, tech stack, role) convert several times better than leads that don't. If you don't filter, your rate reflects a mix of qualified and unqualified leads.
Is the ask too big?#
"Can we book 45 minutes for a full demo?" is a large ask for someone who has never heard of you. Lower-commitment asks tend to book more meetings with cold audiences: a 15-minute call, a short Loom video first, or an interest check like "worth a conversation?"
Are meetings actually being held?#
A booked rate that looks fine alongside weak pipeline often means a no-show problem. Common causes:
- No calendar invite from a real person
- No reminder 24 hours and 1 hour before the call
- Meetings booked 2+ weeks out, by which point the prospect has lost interest
- The prospect booked with an SDR and doesn't know who will actually show up
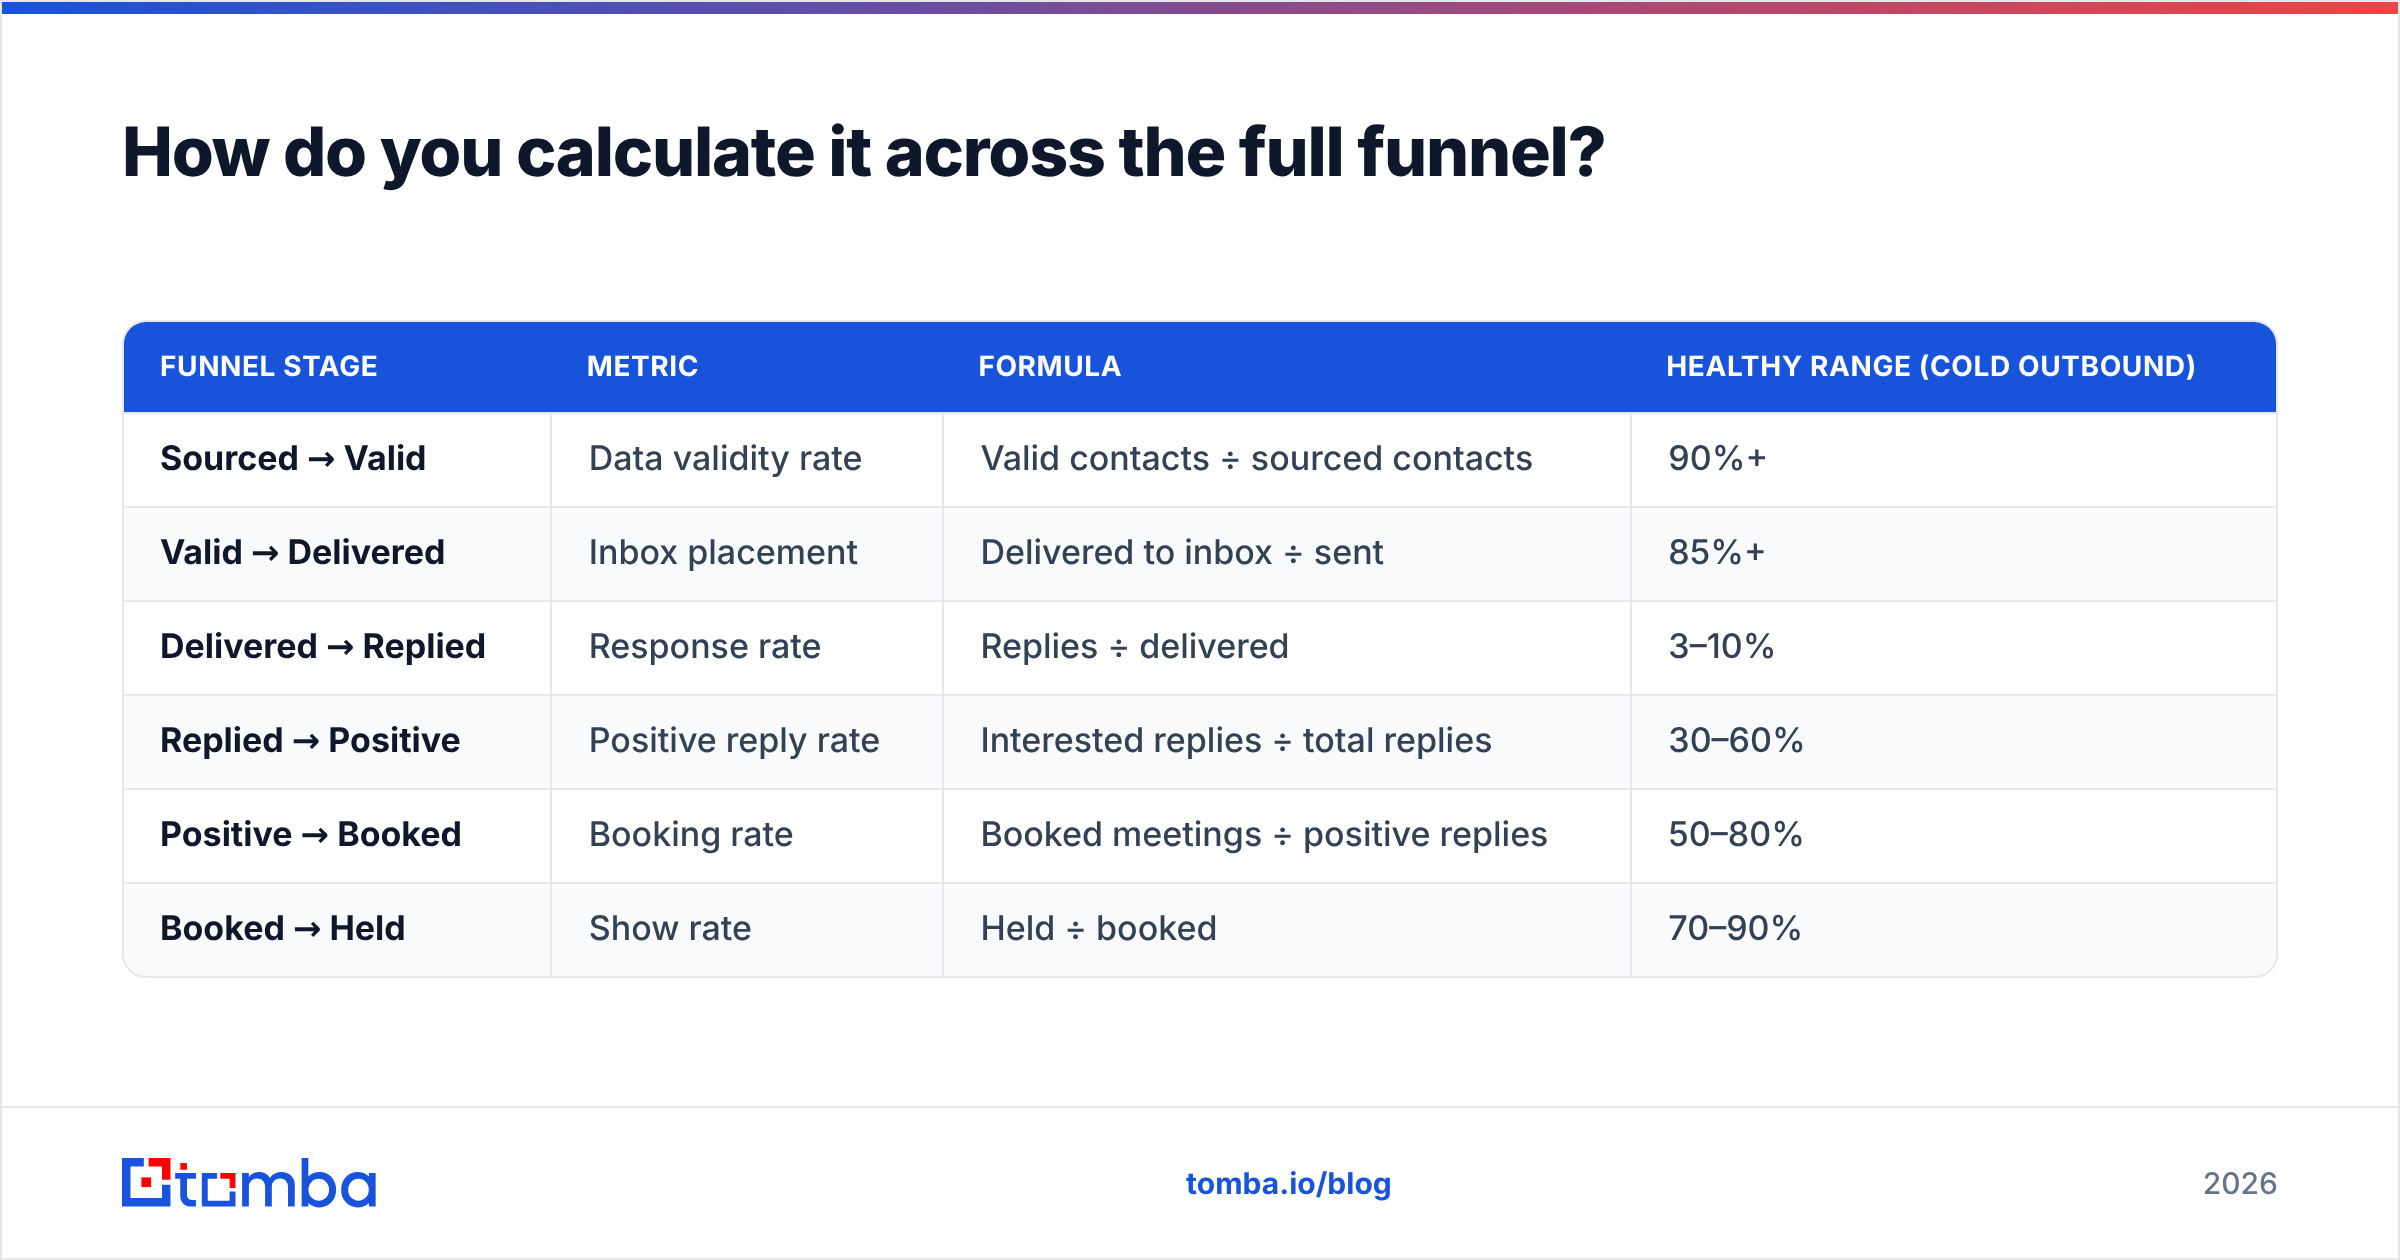
How do you calculate it across the full funnel?#
A single rate tells you that something is wrong. Stage-by-stage rates tell you where. Split the leads-to-meetings step into its components:
| Funnel stage | Metric | Formula | Healthy range (cold outbound) |
|---|---|---|---|
| Sourced → Valid | Data validity rate | Valid contacts ÷ sourced contacts | 90%+ |
| Valid → Delivered | Inbox placement | Delivered to inbox ÷ sent | 85%+ |
| Delivered → Replied | Response rate | Replies ÷ delivered | 3–10% |
| Replied → Positive | Positive reply rate | Interested replies ÷ total replies | 30–60% |
| Positive → Booked | Booking rate | Booked meetings ÷ positive replies | 50–80% |
| Booked → Held | Show rate | Held ÷ booked | 70–90% |
Multiply the stages and you can see where the leak is. A worked example with 1,000 sourced contacts:
- 1,000 sourced × 92% valid = 920 contacts
- 920 × 88% inbox placement = 810 delivered
- 810 × 6% reply rate = 49 replies
- 49 × 45% positive = 22 interested
- 22 × 70% booked = 15 meetings booked
- 15 × 80% held = 12 meetings held
That gives a sourced-to-held rate of 1.2%, or 1.5% booked.
Suppose validity drops to 75% because nobody verified the list. You'd end up with roughly 10 held meetings instead of 12, and nothing downstream changed. Now suppose the lower validity also damages inbox placement, which it often does. You could lose half your meetings without any change to copy, offer, or targeting.
Which fixes raise the leads to meetings conversion rate fastest?#
Ranked by effort compared with typical impact:
- Verify every list before sending. This is quick to do and protects both the denominator and deliverability. Pay particular attention to catch-all domains, which accept every address and hide invalid contacts.
- Get speed-to-lead for inbound under 5 minutes. Route demo requests to a rep instantly, or embed a scheduler on the thank-you page so the lead books without waiting.
- Replace generic inboxes with named decision-makers. Emailing the VP of Sales directly converts far better than emailing sales@company.com. Use an email finder to get the personal work address of the right role.
- Tighten ICP filters. Drop leads outside your target company size and industry, or move them to a nurture track. Your rate goes up and rep time moves to leads that can actually close.
- Shrink the first ask. Test a 15-minute intro against a 30-minute demo. For cold audiences the smaller ask usually wins.
- Book within 5 business days and send reminders. Shorter lead times and two reminders can raise show rates by 10–20 points.
- Add context to the lead record. Firmographic and role data helps reps personalize the first line and prioritize accounts. Contact enrichment fills in company size, industry, and seniority automatically.
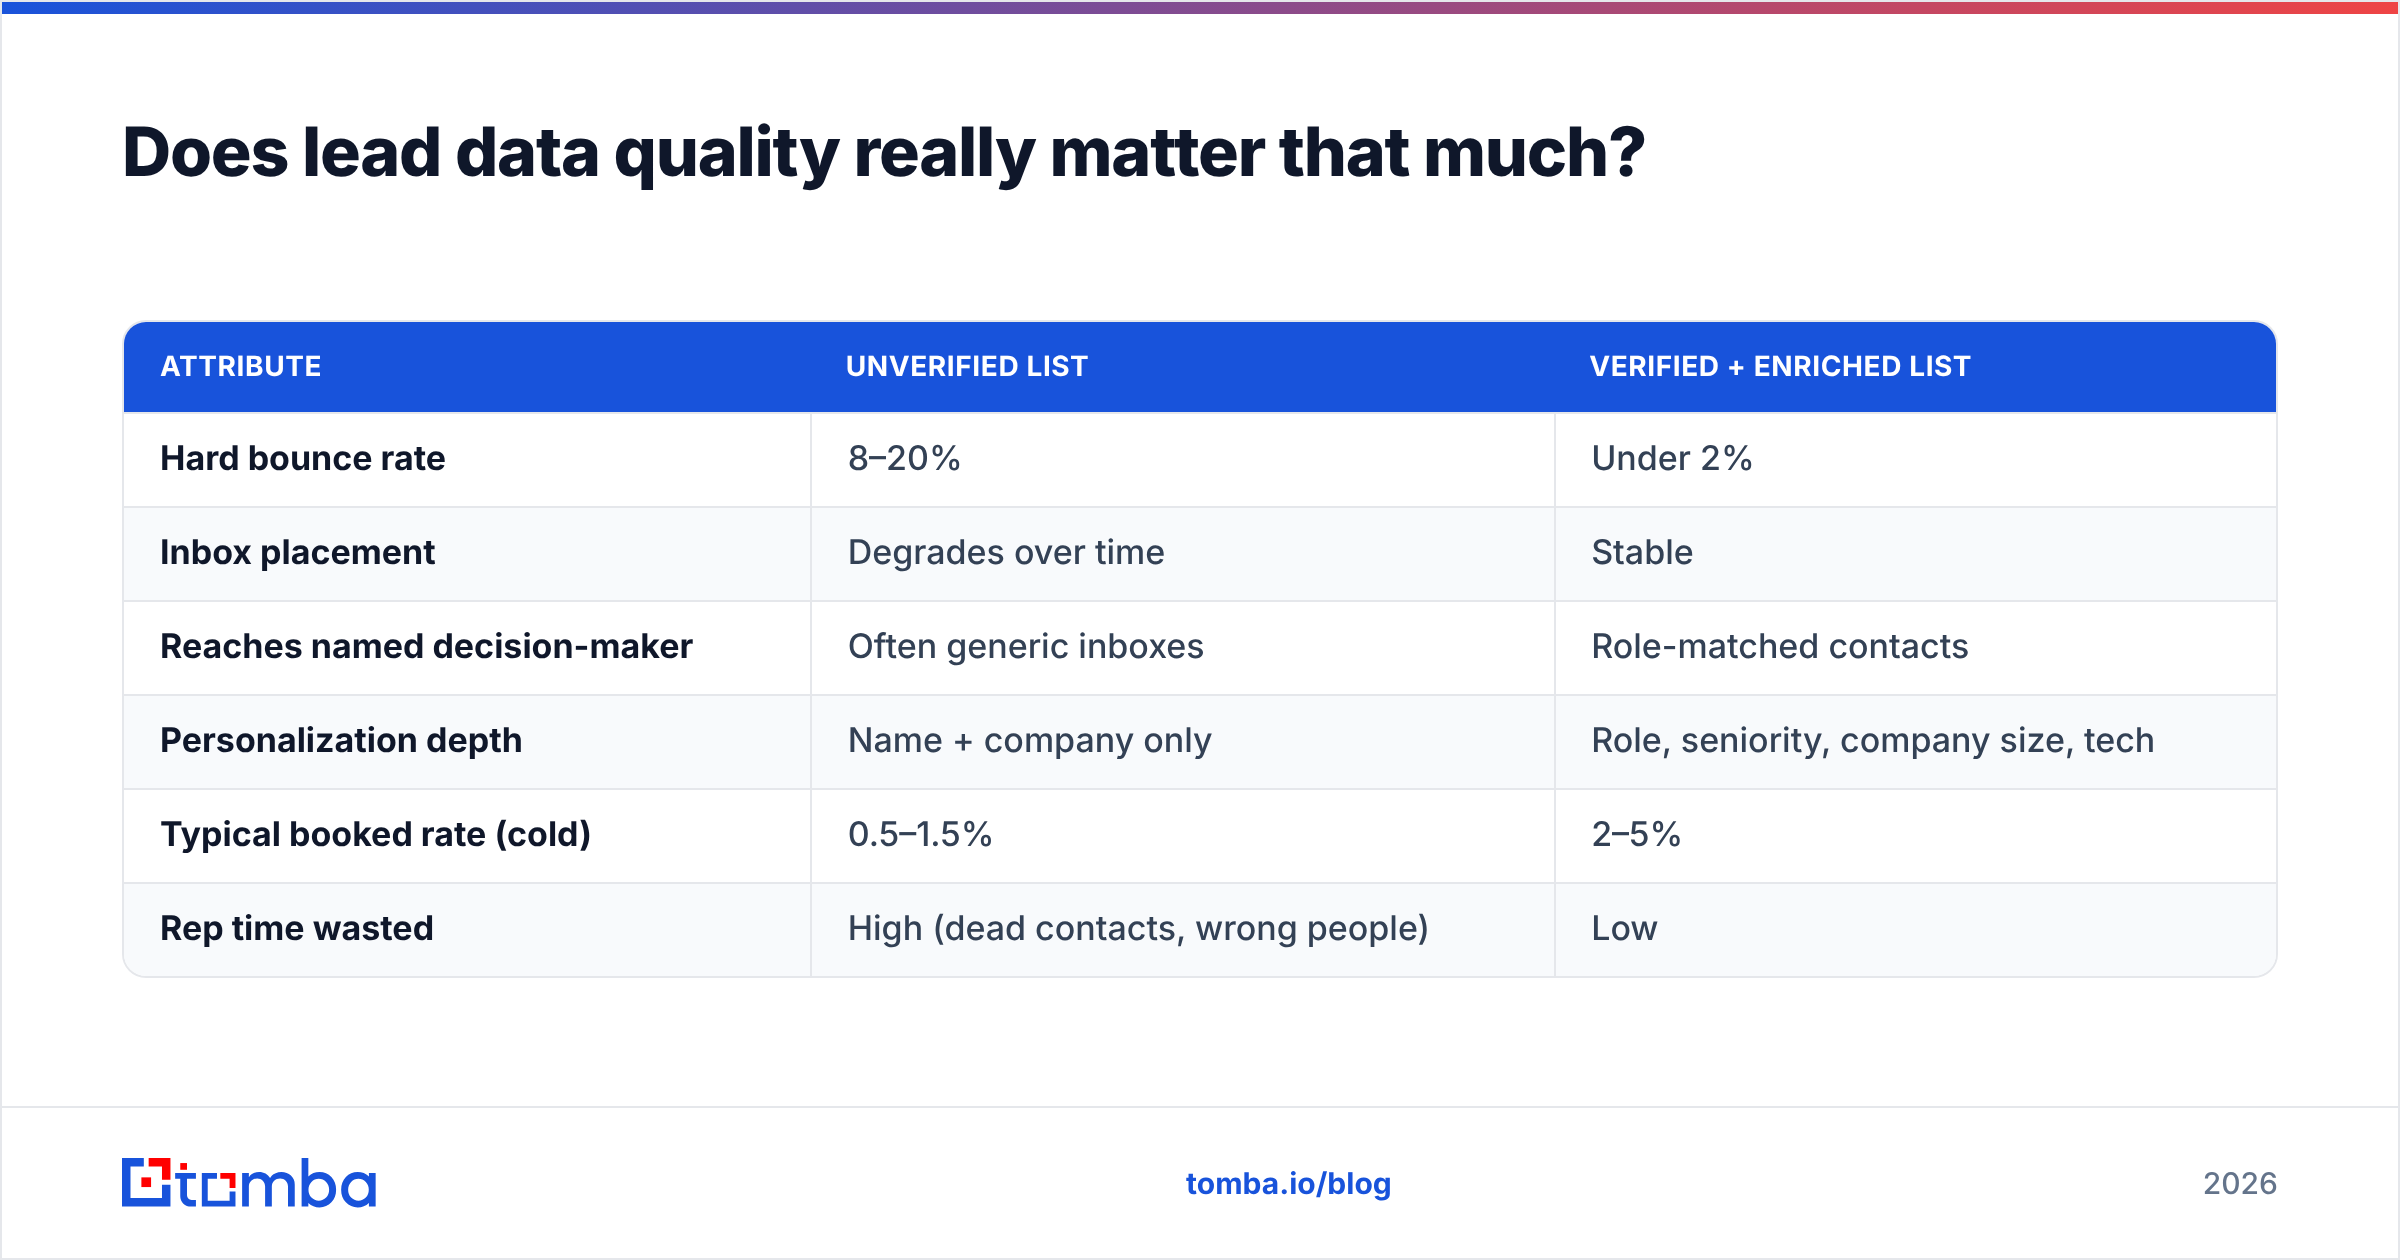
Does lead data quality really matter that much?#
Yes. It's the most underrated variable in this metric because it affects the formula on both sides.
On the denominator side, invalid contacts inflate lead count without any chance of converting. On the numerator side, high bounce rates teach mailbox providers to distrust your domain. That pushes valid emails to spam and lowers replies across the whole campaign.
Here's how a clean list and a dirty list compare with everything else held equal:
| Attribute | Unverified list | Verified + enriched list |
|---|---|---|
| Hard bounce rate | 8–20% | Under 2% |
| Inbox placement | Degrades over time | Stable |
| Reaches named decision-maker | Often generic inboxes | Role-matched contacts |
| Personalization depth | Name + company only | Role, seniority, company size, tech |
| Typical booked rate (cold) | 0.5–1.5% | 2–5% |
| Rep time wasted | High (dead contacts, wrong people) | Low |
Data vendors differ in coverage, sourcing, and verification depth. Established providers such as Tomba, BookYourData, Apollo, and others each have strengths in particular regions and segments, so test a sample of your own ICP before committing. Compare verified-valid rate, role accuracy, and catch-all handling on a few hundred records you already know. Vendor-published averages won't tell you how a source performs on your market.
How should you report this metric to leadership?#
Leadership doesn't need six decimal places. They need to know whether pipeline creation is on track and what's being done about it. A simple monthly view:
- Rate by channel (inbound, outbound, events, referral), booked and held, next to the prior 3 months
- Meetings held vs. target, since a stable rate on lower lead volume still misses the number
- The one biggest leak in the stage breakdown, and the fix in progress
- Downstream check: meetings-to-opportunity rate, so nobody games the metric by booking unqualified calls
The last point matters. If reps are measured only on meetings booked, they'll book calls that go nowhere. Pair this metric with meeting-to-opportunity conversion and eventually win rate so the whole funnel stays honest. For the broader context on how this stage fits the rest of the pipeline, the general overview of lead generation is a useful reference.
What are common mistakes when tracking this metric?#
- Mixing cohorts and periods. January leads that book in February make January look bad and February look great. Pick one method.
- Counting reschedules twice. A meeting moved three times is one meeting, not three.
- Letting reps self-report without a system of record. If meetings aren't logged as calendar-synced CRM activities, your numbers are estimates.
- Benchmarking against the wrong peer. An enterprise team selling $200k deals and an SMB team selling $3k/year software shouldn't expect the same rates.
- Ignoring list decay. B2B contact data decays at roughly 20–30% per year as people change jobs. A list that was clean in January won't be clean in September, so re-verify before every campaign.
So what should you do this week?#
Pull last quarter's data and calculate booked and held rates by channel. Then check these in order:
- What was the hard bounce rate on outbound? If it's above 3%, fix the data first.
- What's the median time from inbound form fill to first human touch? If it's over 15 minutes, fix routing.
- What share of worked leads match your ICP? If it's under 60%, tighten filters.
- What's the show rate? If it's under 75%, add reminders and shorten booking lead times.
Only after those four should you A/B test copy. Copy improvements build on top of a working funnel, and they can't make up for a broken one.
If contact data turns out to be your biggest leak, and in cold outbound it often is, start with the source. Tomba Email Finder finds verified professional email addresses by name, domain, or company, so your SDRs reach real decision-makers instead of bouncing off dead inboxes. The free tier includes 25 searches a month, enough to test it against your own ICP before you consider the $49/mo Starter plan. A cleaner denominator gives you a leads to meetings conversion rate you can trust.
Related guides#
// get started
Find, verify and enrich your first contacts today
Start on the free plan with 25 searches a month, then scale when your team is ready.
Free plan · No credit card required · GDPR & CCPA
// about the author