LTV CAC Calculator: Formulas, Benchmarks and Worked Examples
Most LTV:CAC ratios look healthy because of a few spreadsheet shortcuts. This guide covers the correct formulas, a worked example, 2026 benchmarks, and the practical levers that improve the ratio.
TL;DR
- An LTV CAC calculator divides the gross profit a customer brings in over their lifetime by what it cost to win them. 3:1 is the usual rule-of-thumb target.
- Most inflated ratios come from three mistakes: using revenue instead of gross margin, assuming churn is too low, and leaving costs out of CAC.
- Look at CAC payback period next to the ratio. A 5:1 ratio that takes 30 months to pay back can still run you out of cash.
- The fastest ways to improve the ratio are cutting churn, improving the price-to-margin mix, and reducing wasted outbound spend such as bounced emails, bad data and unused seats.
- Below you get copy-ready formulas, a worked example, a benchmark table, and a sensitivity check you can run in any spreadsheet.
What is an LTV CAC calculator?#
An LTV CAC calculator compares two numbers:
- Customer lifetime value (LTV): how much gross profit an average customer produces before they churn.
- Customer acquisition cost (CAC): how much you spend on sales and marketing to win one new customer.
Think of it as a vending machine. CAC is what you pay to install the machine, and LTV is the profit it makes before it breaks down. If a $1,000 install brings in $3,000 of profit, the machine is worth having. If it brings in $900, you lose money on every machine you add, and adding more machines makes the loss bigger.
The ratio is useful because it combines growth efficiency and retention into one number that finance, sales and marketing can all read. Investors ask for it, boards track it, and RevOps teams use it to decide whether to put more money into a channel. For the underlying definitions, see Wikipedia's entries on customer lifetime value and customer acquisition cost. If you work in revenue operations, you'll probably own this calculation.
How do you calculate LTV and CAC correctly?#
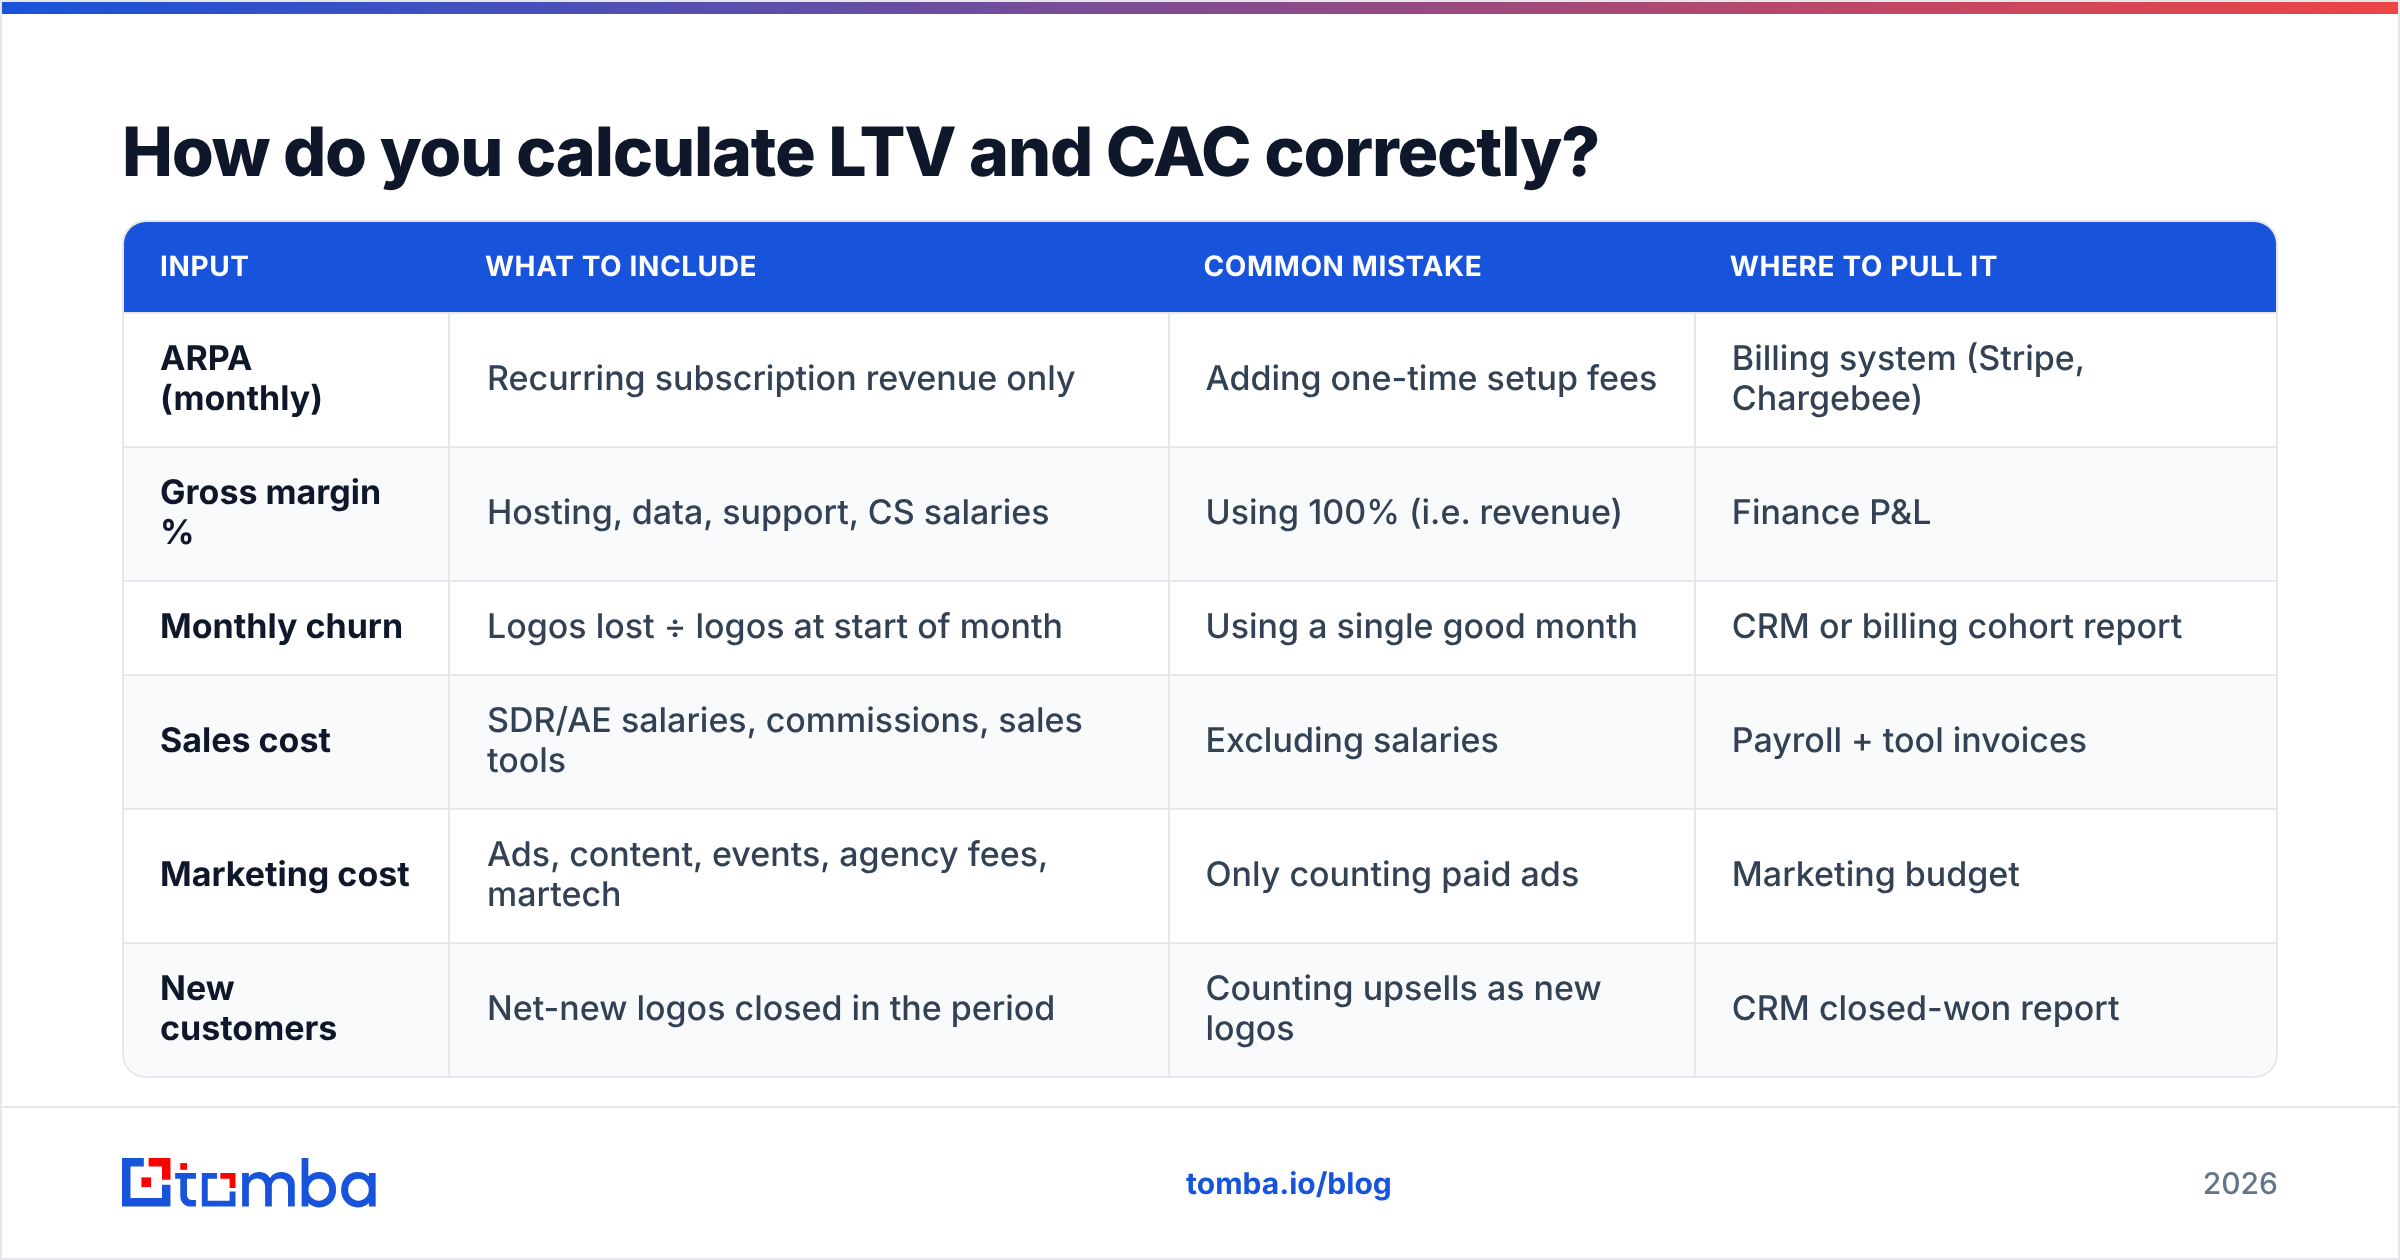
A calculator is only as good as its inputs, and most spreadsheets get at least one of these wrong. These are the formulas to use:
- Average revenue per account (ARPA): total recurring revenue in the period divided by the number of active customers. Use monthly figures if churn is measured monthly.
- Gross margin %: (revenue − cost of goods sold) ÷ revenue. For SaaS, COGS covers hosting, third-party data and API costs, support, and customer success time.
- Churn rate: customers lost in the period ÷ customers at the start of the period. Use logo churn for LTV unless your expansion revenue is large and predictable.
- LTV: (ARPA × gross margin %) ÷ churn rate. The 1 ÷ churn part is the implied customer lifetime in periods.
- CAC: total sales and marketing cost in the period ÷ new customers won in the period. Include salaries, commissions, tools, data, ad spend, agencies and overhead allocation.
- LTV:CAC ratio: LTV ÷ CAC. Also calculate CAC payback = CAC ÷ (ARPA × gross margin %), in months.
The calculator doesn't need anything more than this. The rest of the work is making sure each input is accurate.
Calculator input sheet#
| Input | What to include | Common mistake | Where to pull it |
|---|---|---|---|
| ARPA (monthly) | Recurring subscription revenue only | Adding one-time setup fees | Billing system (Stripe, Chargebee) |
| Gross margin % | Hosting, data, support, CS salaries | Using 100% (i.e. revenue) | Finance P&L |
| Monthly churn | Logos lost ÷ logos at start of month | Using a single good month | CRM or billing cohort report |
| Sales cost | SDR/AE salaries, commissions, sales tools | Excluding salaries | Payroll + tool invoices |
| Marketing cost | Ads, content, events, agency fees, martech | Only counting paid ads | Marketing budget |
| New customers | Net-new logos closed in the period | Counting upsells as new logos | CRM closed-won report |
What does a worked LTV:CAC example look like?#
Here's a mid-market SaaS company with one quarter of data.
Inputs
- ARPA: $500/month
- Gross margin: 80%
- Monthly logo churn: 2%
- Quarterly sales and marketing spend: $150,000
- New customers won in the quarter: 30
LTV
Monthly gross profit per customer = $500 × 0.80 = $400 Implied lifetime = 1 ÷ 0.02 = 50 months LTV = $400 × 50 = $20,000
CAC
CAC = $150,000 ÷ 30 = $5,000
Ratio and payback
LTV:CAC = $20,000 ÷ $5,000 = 4:1 CAC payback = $5,000 ÷ $400 = 12.5 months
That's a healthy result. Now compare it with the version that usually gets shown to a board. Use revenue instead of gross profit and LTV becomes $25,000, so the ratio is 5:1. Leave SDR salaries out of CAC, say $60,000 of the $150,000, and CAC drops to $3,000, so the ratio is 8.3:1. The business hasn't changed at all, but the ratio has doubled.

This is why any ratio you see in a pitch deck or benchmark report needs a note on method. Without knowing the gross margin and CAC definitions behind it, the number doesn't tell you much.
What is a good LTV to CAC ratio in 2026?#
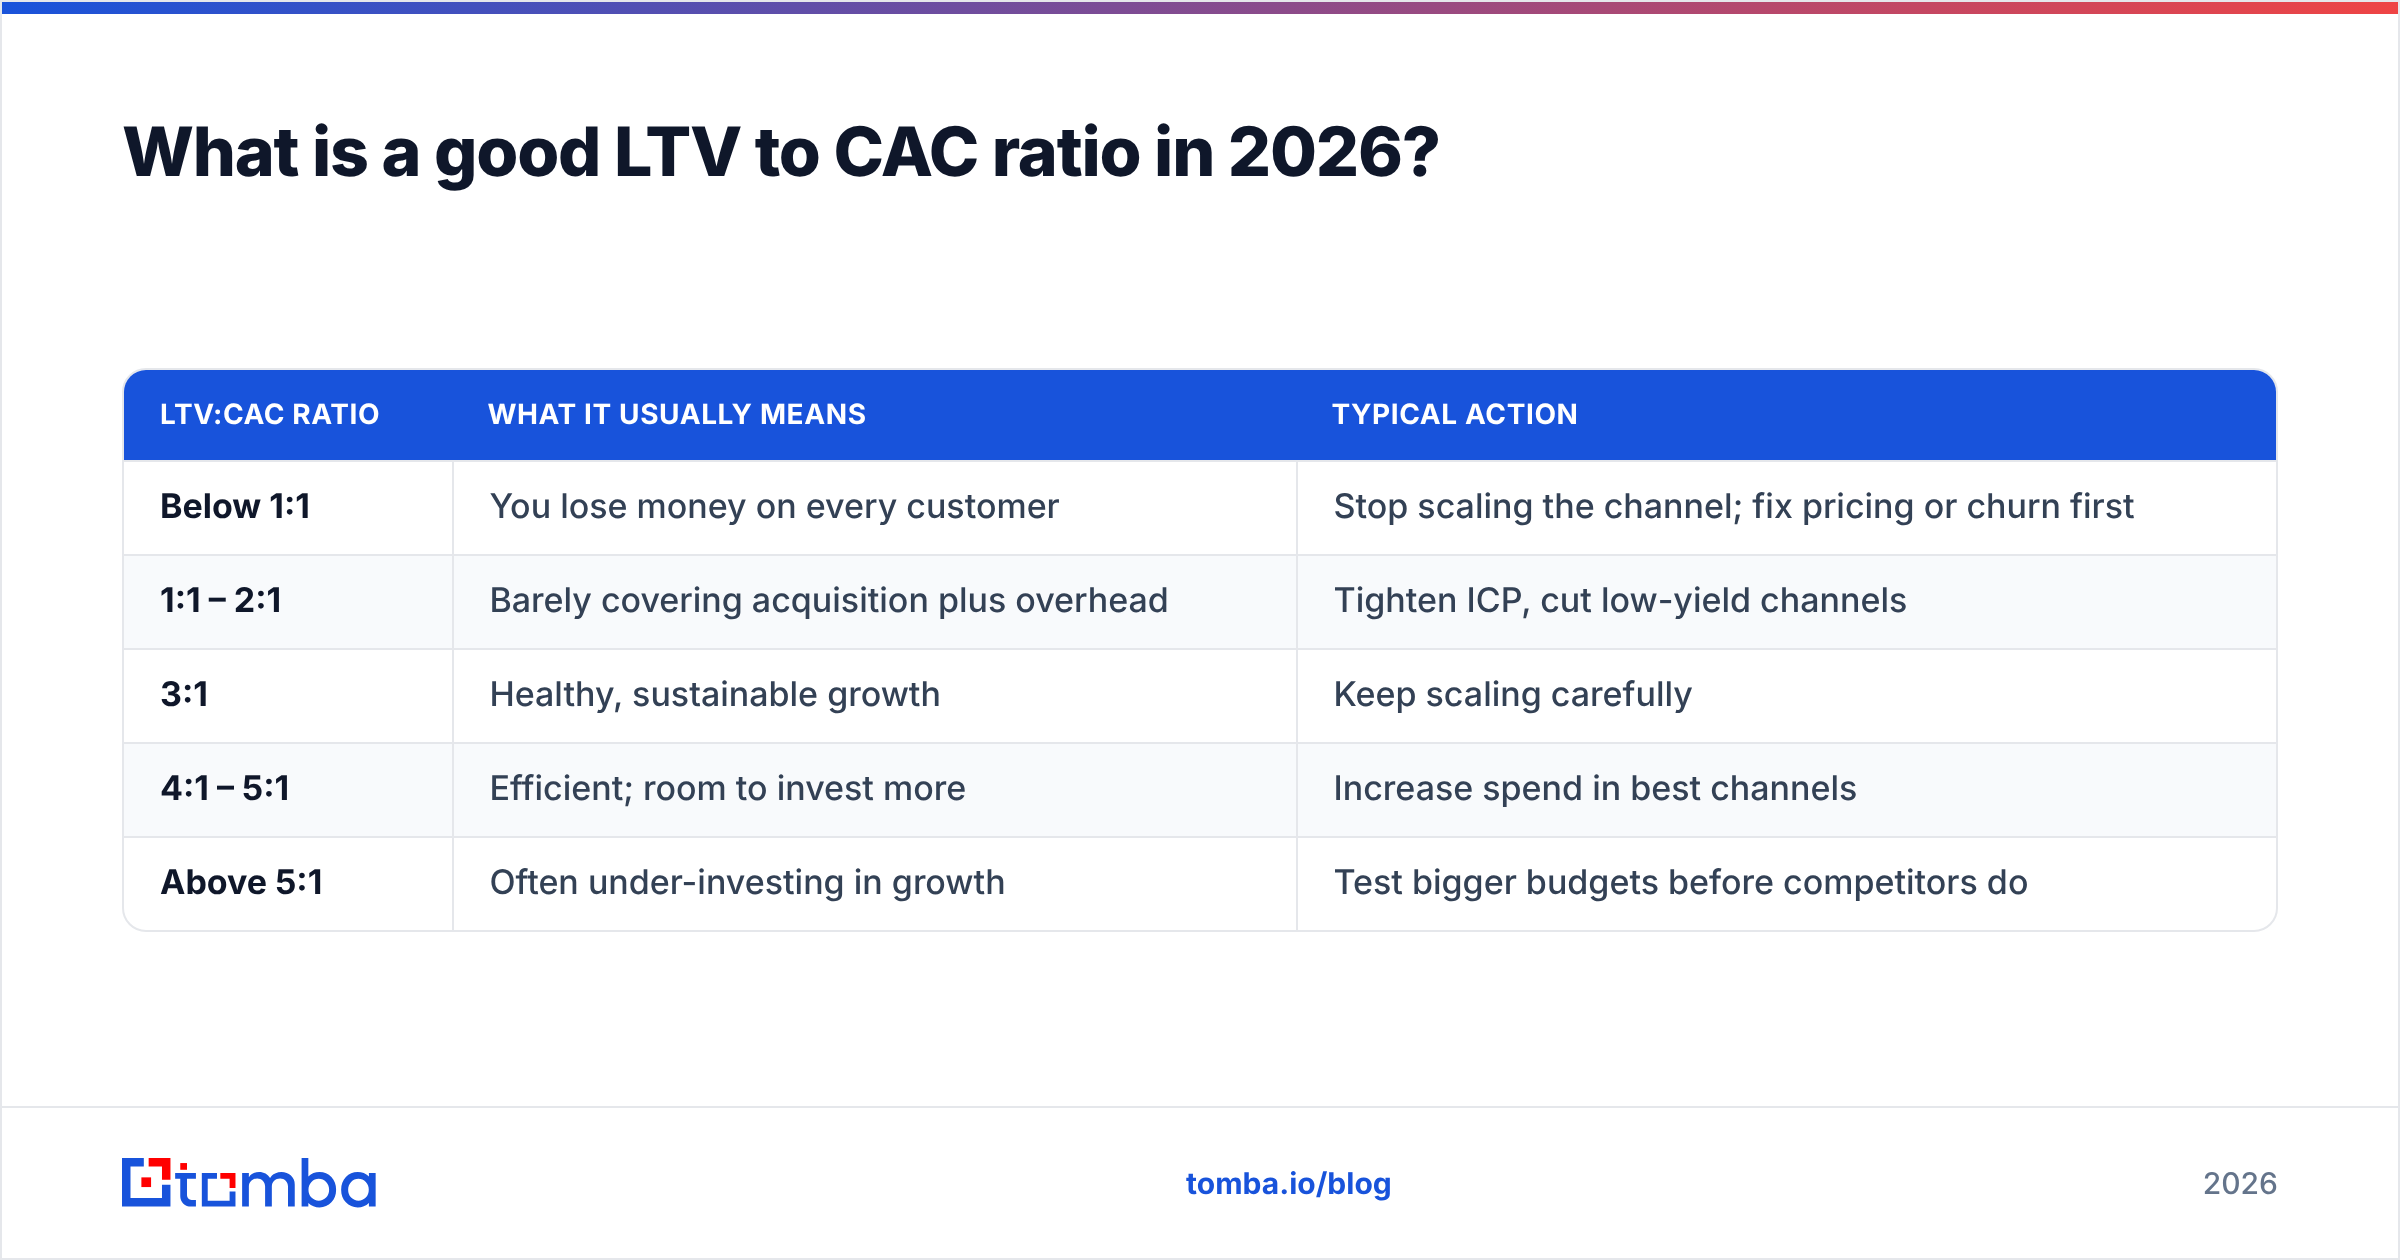
3:1 is the standard benchmark. It's widely cited in SaaS finance circles, including David Skok's well-known SaaS Metrics 2.0 framework, and it's still the number most investors expect. It isn't a law, though. Where your ratio should sit depends on your stage, how much cash you have, and your payback period.
| LTV:CAC ratio | What it usually means | Typical action |
|---|---|---|
| Below 1:1 | You lose money on every customer | Stop scaling the channel; fix pricing or churn first |
| 1:1 – 2:1 | Barely covering acquisition plus overhead | Tighten ICP, cut low-yield channels |
| 3:1 | Healthy, sustainable growth | Keep scaling carefully |
| 4:1 – 5:1 | Efficient; room to invest more | Increase spend in best channels |
| Above 5:1 | Often under-investing in growth | Test bigger budgets before competitors do |
A very high ratio isn't always good news. If yours is 8:1 and was calculated correctly, you're probably spending too little. Competitors with more budget will reach your best prospects first.
Why payback period matters as much as the ratio#
The ratio assumes you'll eventually collect the full LTV. Payback tells you how long you have to wait. As a rough guide, SMB-focused companies aim to recover CAC within about 12 months, mid-market within 12–18 months, and enterprise teams can accept 24 months or longer when contracts are annual and prepaid.
A 6:1 ratio with 36-month payback can be worse than 3:1 with 8-month payback if you're burning cash. The slow-payback company needs much more working capital for each new customer.
Which mistakes inflate an LTV:CAC calculation?#
These are the errors that come up most often in audits:
- Revenue-based LTV. If you skip gross margin, your LTV is overstated by 20–40% for most SaaS businesses, and by more for businesses with heavy services.
- Lifetime with no cap. With 0.5% monthly churn, the formula gives a 200-month lifetime, which is more than 16 years. Few finance teams will credit that. Cap lifetime at 3–5 years, or use cohort data you've actually observed.
- Blended CAC hiding paid CAC. Blended CAC counts organic and referral customers who cost almost nothing, which makes paid channels look cheaper than they are. Calculate CAC per channel.
- Leaving out headcount. SDRs, AEs, sales managers, marketing salaries and RevOps time are all acquisition costs. Tools-only CAC is rarely accurate.
- Time-lag mismatch. Spend this quarter often turns into customers next quarter. If your sales cycle is 90 days, divide this quarter's customers by last quarter's spend.
- Ignoring data waste. Credits spent on contacts who bounce, have left the company, or turn out to be catch-all addresses still get paid for. That spend belongs in CAC even though it produced no pipeline.
How sensitive is LTV:CAC to churn?#
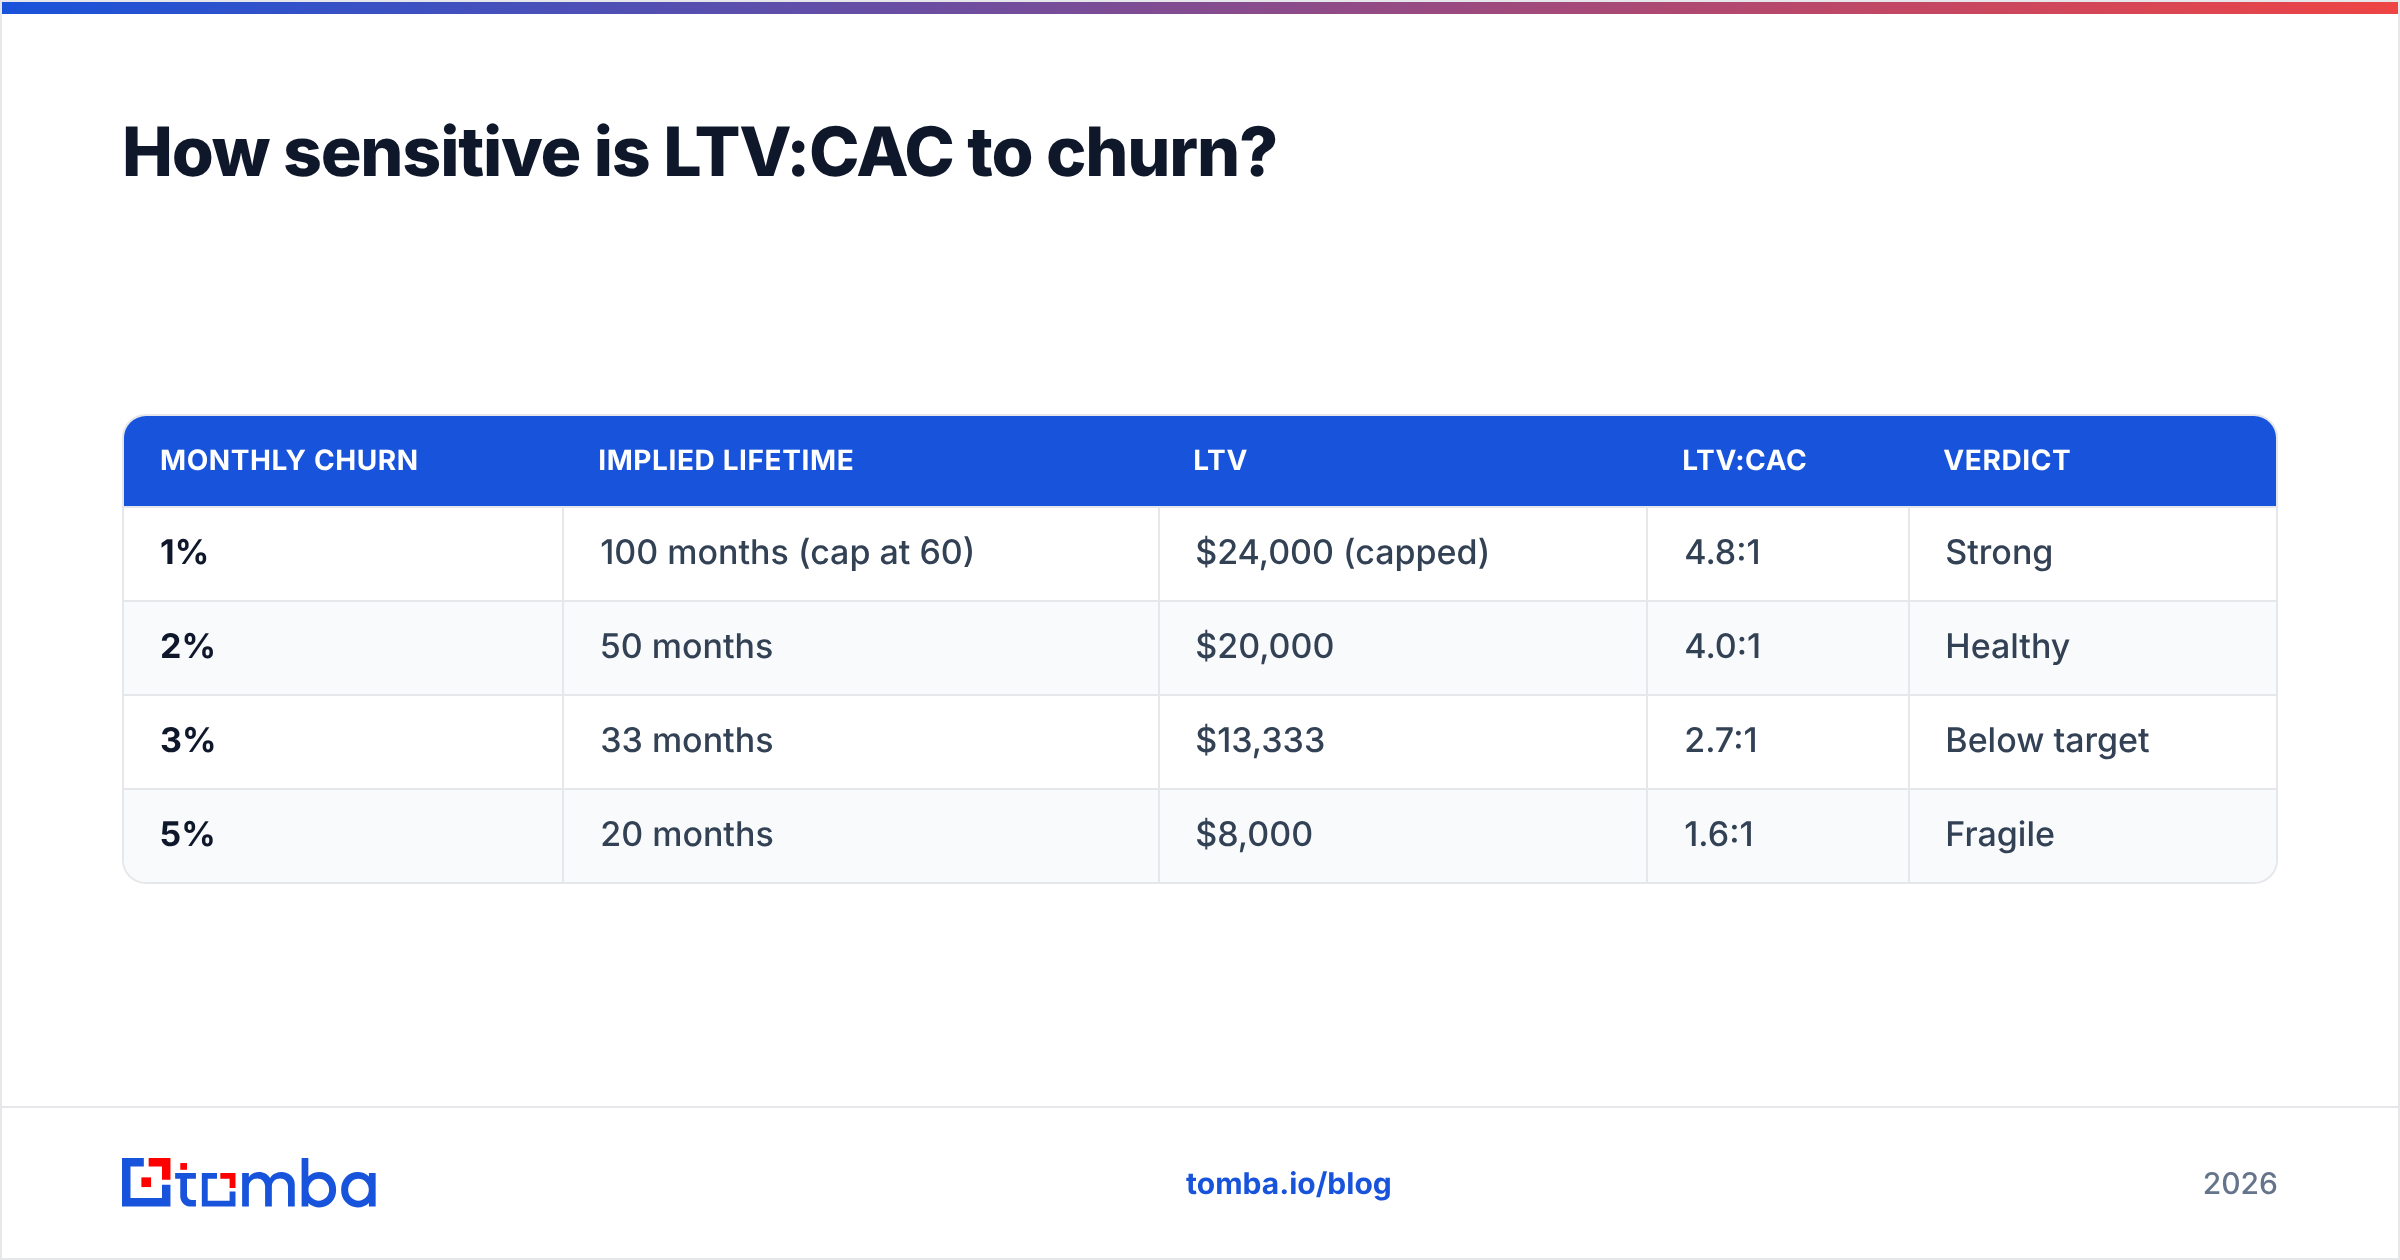
It's very sensitive. Churn sits in the denominator of LTV, so small changes have large effects. Using the worked example above ($400 monthly gross profit, $5,000 CAC):
| Monthly churn | Implied lifetime | LTV | LTV:CAC | Verdict |
|---|---|---|---|---|
| 1% | 100 months (cap at 60) | $24,000 (capped) | 4.8:1 | Strong |
| 2% | 50 months | $20,000 | 4.0:1 | Healthy |
| 3% | 33 months | $13,333 | 2.7:1 | Below target |
| 5% | 20 months | $8,000 | 1.6:1 | Fragile |
Going from 2% to 3% monthly churn drops the ratio from 4:1 to 2.7:1, and nothing about acquisition has changed. So when the ratio falls, check retention before you cut the sales budget.
How can you improve your LTV:CAC ratio?#
You can raise the top of the fraction or lower the bottom. The levers below are roughly ordered by how fast they tend to work.
Raise LTV#
- Reduce early churn. Most logo churn happens in the first 90 days. Better onboarding and a clear first-value moment usually help more than anything else on this list.
- Price for expansion. Usage-based or seat-based tiers let good customers grow into higher ARPA without another sales cycle.
- Protect gross margin. Look at third-party data, infrastructure and support costs. Every point of margin you recover increases LTV directly.
Lower CAC#
- Tighten your ICP. Deals outside your ideal customer profile close more slowly, churn sooner and use up SDR time. Qualify harder at the top of the funnel.
- Fix outbound data quality. When 15% of an outbound list bounces, you've paid for contacts, sequencer seats and SDR hours with nothing to show for it, and your sender reputation takes a hit too. Running lists through an email verifier before they go into a sequence is one of the cheapest CAC fixes available.
- Consolidate the stack. Many teams pay for three overlapping data tools. Pick one primary source for data enrichment and contact discovery and cancel the rest.
- Shift mix toward efficient channels. Once you have per-channel CAC, you'll usually find one channel costing two or three times what the others do. Move budget away from it.

Where data tools fit into CAC#
Prospecting data is a real CAC line item, and it's easy to overpay for it. Enterprise intelligence platforms can cost five figures a year per team. Lighter email-finder and verification tools cost much less. Tomba, for example, starts at $49/month (full pricing details here), with a 25-search free tier for testing. Other established providers, BookYourData among them, sell prepaid list and credit models that suit teams who prefer to buy data in batches. Pick based on match rate for your ICP, verification quality and how the tool fits your workflow. The headline price matters less than those three. A cheap tool with high bounce rates costs more per closed deal than a pricier tool with clean data.
Should you use a spreadsheet or a dedicated LTV CAC calculator?#
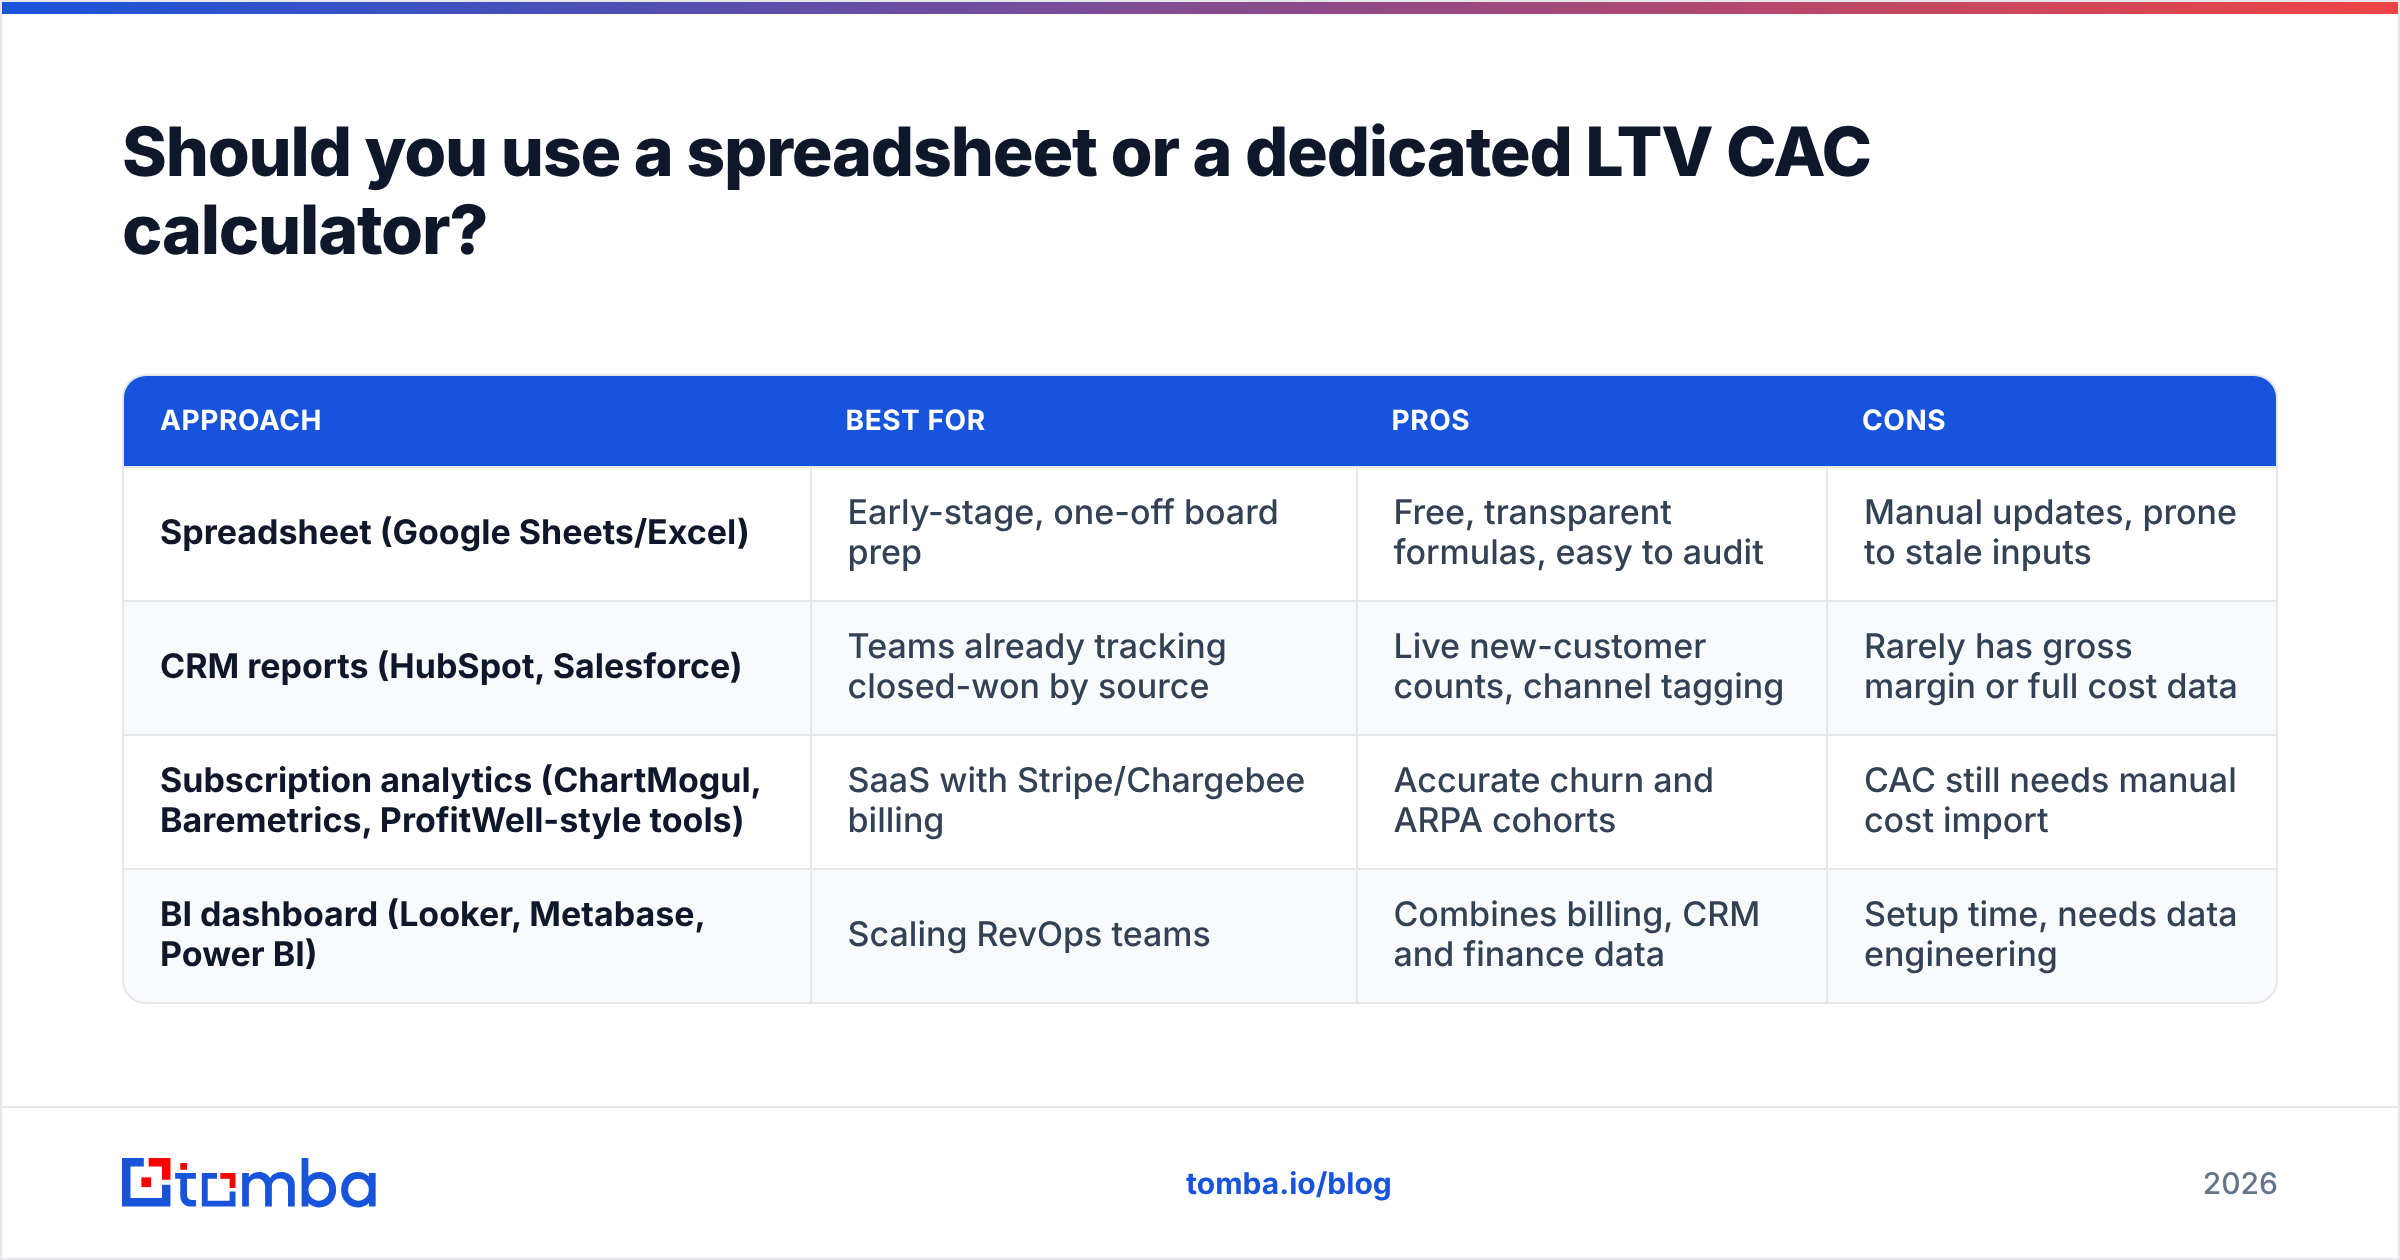
For most teams under roughly $20M ARR, a well-built spreadsheet is enough. Dedicated tools and BI dashboards are worth it once you need cohort-level churn, channel attribution and automatic data refreshes.
| Approach | Best for | Pros | Cons |
|---|---|---|---|
| Spreadsheet (Google Sheets/Excel) | Early-stage, one-off board prep | Free, transparent formulas, easy to audit | Manual updates, prone to stale inputs |
| CRM reports (HubSpot, Salesforce) | Teams already tracking closed-won by source | Live new-customer counts, channel tagging | Rarely has gross margin or full cost data |
| Subscription analytics (ChartMogul, Baremetrics, ProfitWell-style tools) | SaaS with Stripe/Chargebee billing | Accurate churn and ARPA cohorts | CAC still needs manual cost import |
| BI dashboard (Looker, Metabase, Power BI) | Scaling RevOps teams | Combines billing, CRM and finance data | Setup time, needs data engineering |
Whichever you use, the CRM has to hold clean closed-won data tagged by source. Both HubSpot and Salesforce support this natively, but the tags are only reliable if reps fill in the source field every time.
What should your LTV CAC calculator template include?#
A minimal template that will hold up to a finance review has these parts:
- Inputs tab: ARPA, gross margin, monthly churn, lifetime cap, S&M spend by channel, new customers by channel, sales-cycle lag.
- Calculations tab: LTV, CAC per channel, blended CAC, LTV:CAC per channel, payback months.
- Sensitivity tab: a grid of churn (1–5%) against CAC (±30%) so you can see where the ratio falls below 3:1.
- Notes tab: the definitions you used, such as "gross margin includes CS salaries" or "CAC lags one quarter," so the next person who opens the file gets the same answer.
The notes tab is the one people skip. It's also the part that lets you compare this quarter's ratio with next year's.
Frequently asked questions#
Is a 3:1 LTV to CAC ratio still the right target?#
Yes, as a starting point. Early-stage companies that are still finding product-market fit often run below 3:1 on purpose. Mature, cash-efficient businesses tend to run at 4:1 or higher. Look at the trend quarter over quarter rather than any single reading.
Should LTV use revenue or gross profit?#
Use gross profit. Revenue-based LTV overstates what each customer is actually worth to you, because you still pay to host, support and serve them.
How often should you recalculate LTV:CAC?#
Quarterly works for most teams. Recalculate monthly if you're changing pricing, launching a new channel or seeing churn move quickly.
Does outbound prospecting cost count toward CAC?#
Yes. Contact data subscriptions, sequencing tools, SDR salaries and verification credits are all acquisition costs, whether or not the contacts they produce ever convert.
What's the next step?#
Put your real numbers into the formulas above. Use gross margin, cap the lifetime, include headcount, and split CAC by channel. If outbound turns out to be your most expensive channel, look first at data waste: contacts who bounce, have left the company, or never had a valid address. Tomba Email Finder finds and verifies professional email addresses by name, domain or company, so your SDR hours and sequencer seats go toward conversations that can close. It has a free tier, so you can test match quality on your own ICP before it becomes a line in your CAC.
Related guides#
// get started
Find, verify and enrich your first contacts today
Start on the free plan with 25 searches a month, then scale when your team is ready.
Free plan · No credit card required · GDPR & CCPA
// about the author