LTV to CAC Ratio: How to Calculate, Benchmark, and Improve It
Your LTV to CAC ratio shows whether growth creates value or burns cash. This guide covers the formula, realistic benchmarks, common calculation mistakes, and the levers that move the ratio fastest.
TL;DR
- The LTV to CAC ratio divides the gross-margin value of a customer by the fully loaded cost of acquiring them. It tells you whether each new customer earns back more than they cost.
- 3:1 is the usual target, but the ratio means little without CAC payback period alongside it. A 3:1 ratio with a 30-month payback can still drain your cash.
- Most bad ratios come from bad inputs: revenue used where gross margin belongs, CAC that leaves out salaries and tools, or churn averaged across segments that behave nothing alike.
- Churn reduction usually improves the ratio more than CAC cuts do. On the CAC side, the quickest wins come from targeting and data quality, not from slashing budget.
- Calculate it by segment and channel. A blended company-wide ratio can hide one channel that loses money on every deal.
What is the LTV to CAC ratio?#
The LTV to CAC ratio compares two numbers:
- LTV (customer lifetime value): the total gross profit you expect from one customer over the whole relationship.
- CAC (customer acquisition cost): everything you spent in sales and marketing to win that customer.
Think of it like a vending machine. CAC is what it costs to buy and install the machine, and LTV is the profit it makes before it breaks down. If a machine costs $1,000 to place and earns $3,000 in margin over its life, you'll keep placing machines. If it earns $900, you stop.
In SaaS and B2B, the ratio is one of the first numbers investors, CFOs, and revenue operations teams check, because it compresses your whole go-to-market motion into one figure: are you buying growth at a price that pays off?
The concept comes from the broader idea of customer lifetime value. The SaaS version is simplified so you can compute it quarterly from data your finance team already has.
How do you calculate LTV to CAC?#
Here's the standard formula set:
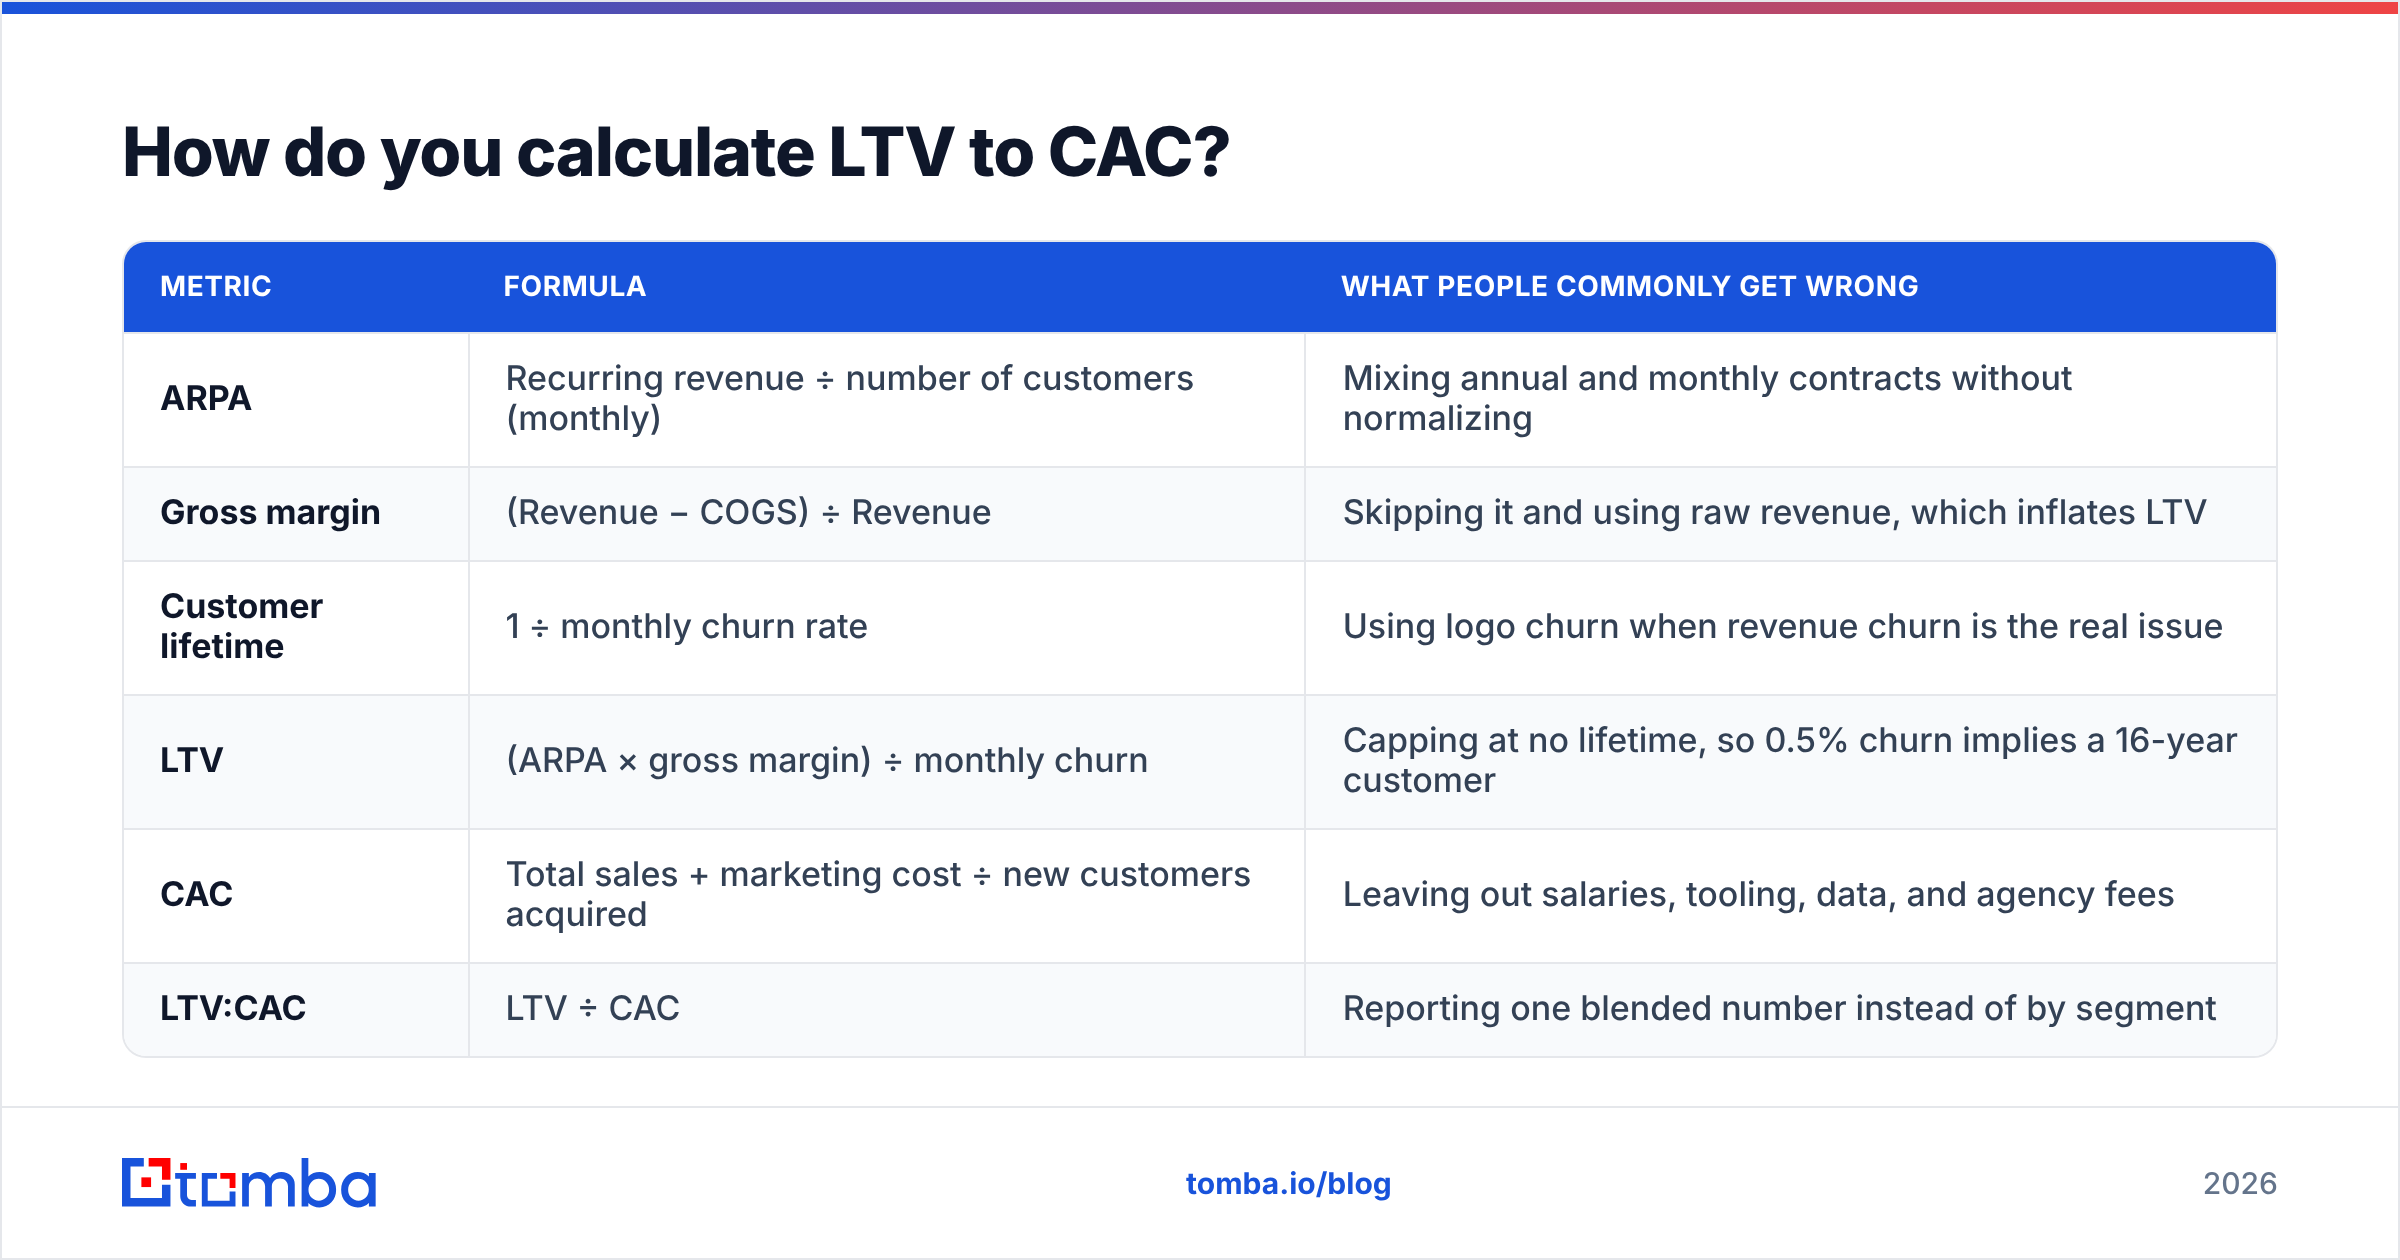
| Metric | Formula | What people commonly get wrong |
|---|---|---|
| ARPA | Recurring revenue ÷ number of customers (monthly) | Mixing annual and monthly contracts without normalizing |
| Gross margin | (Revenue − COGS) ÷ Revenue | Skipping it and using raw revenue, which inflates LTV |
| Customer lifetime | 1 ÷ monthly churn rate | Using logo churn when revenue churn is the real issue |
| LTV | (ARPA × gross margin) ÷ monthly churn | Capping at no lifetime, so 0.5% churn implies a 16-year customer |
| CAC | Total sales + marketing cost ÷ new customers acquired | Leaving out salaries, tooling, data, and agency fees |
| LTV:CAC | LTV ÷ CAC | Reporting one blended number instead of by segment |
A worked example#
Suppose your B2B SaaS company has:
- ARPA of $1,000/month
- Gross margin of 80%
- Monthly logo churn of 2%
- Quarterly sales and marketing spend of $600,000 (salaries, ads, tools, events, data)
- 50 new customers that quarter
LTV = ($1,000 × 0.80) ÷ 0.02 = $40,000
CAC = $600,000 ÷ 50 = $12,000
LTV:CAC = $40,000 ÷ $12,000 = 3.33:1
CAC payback = $12,000 ÷ ($1,000 × 0.80) = 15 months
On paper that's healthy. Whether it's actually healthy depends on your cash position, your segment, and how honestly you built the inputs, which the rest of this guide covers.
Should LTV use revenue or gross margin?#
Use gross margin. Revenue-based LTV assumes every dollar of subscription revenue is profit, and it isn't: hosting, support, onboarding, and third-party data costs all sit in COGS. A company with 60% gross margin and one with 85% gross margin can report the same revenue LTV while their real economics differ by roughly 40%.
What belongs in CAC?#
Use the fully loaded version. Include:
- Paid media, sponsorships, events
- SDR, AE, and marketing salaries plus commissions and benefits
- Sales tools: CRM, sequencer, dialer, and contact data subscriptions
- Agencies, contractors, and content production
- A share of sales management and RevOps headcount
Teams that report "paid CAC" (ad spend ÷ customers) usually show a ratio 2–4x better than the fully loaded figure. That's fine for comparing channels, but don't show it to your board as the company number.

What is a good LTV to CAC ratio?#
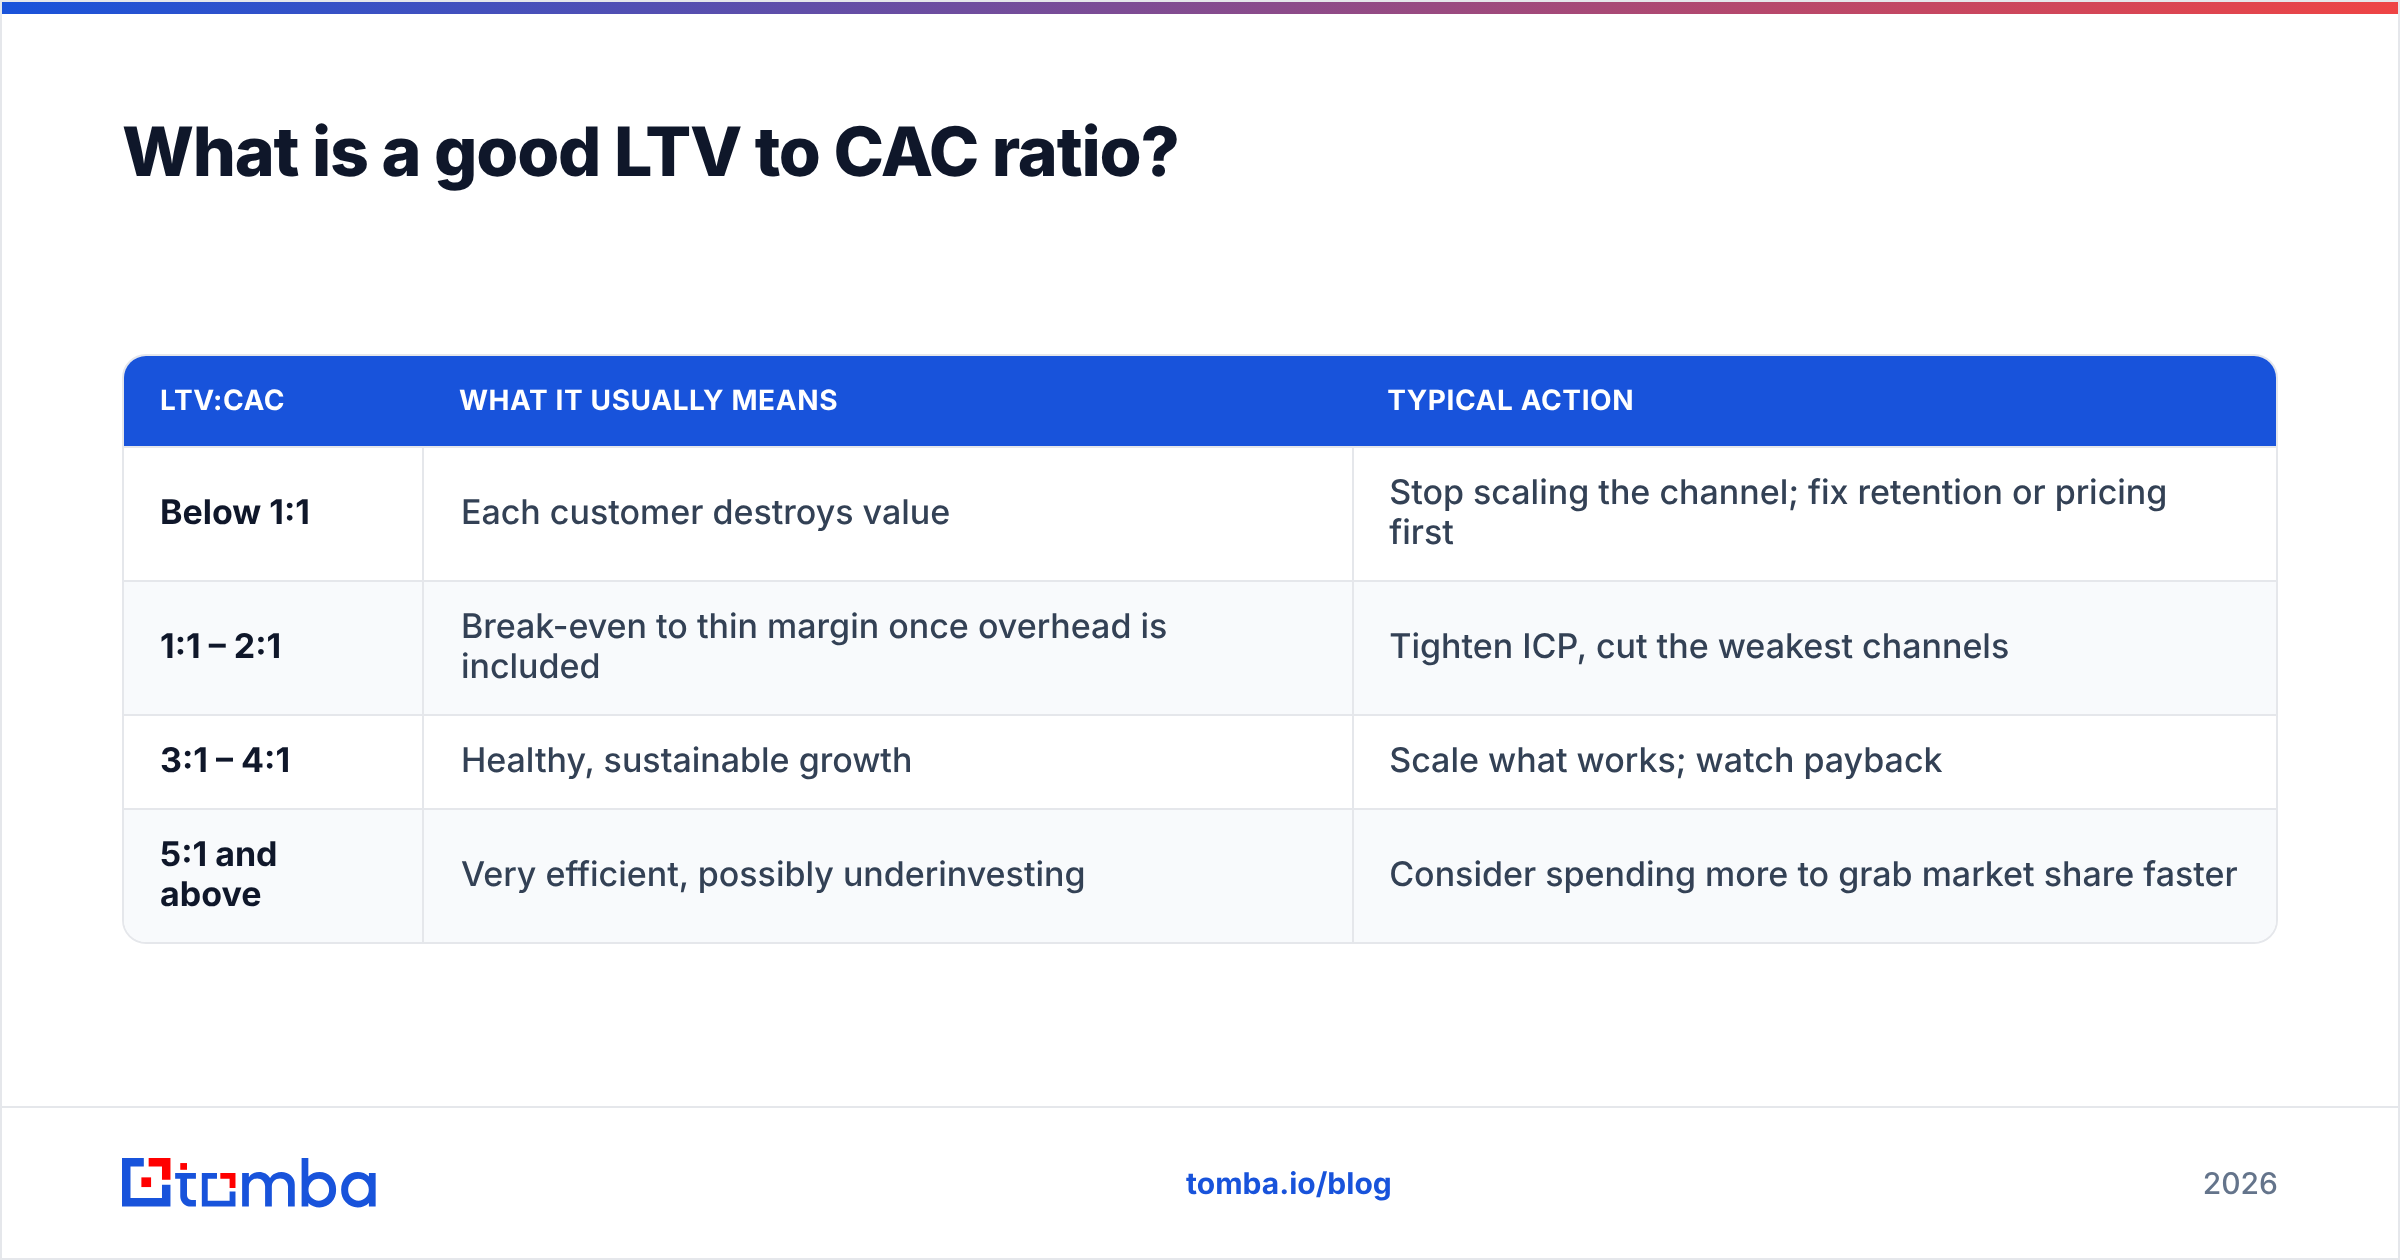
The widely quoted target is 3:1. That shorthand is useful, but it leaves out context. Read the ratio against your stage and your payback period:
| LTV:CAC | What it usually means | Typical action |
|---|---|---|
| Below 1:1 | Each customer destroys value | Stop scaling the channel; fix retention or pricing first |
| 1:1 – 2:1 | Break-even to thin margin once overhead is included | Tighten ICP, cut the weakest channels |
| 3:1 – 4:1 | Healthy, sustainable growth | Scale what works; watch payback |
| 5:1 and above | Very efficient, possibly underinvesting | Consider spending more to grab market share faster |
A ratio above 5:1 is not automatically good news. If competitors are spending harder and you're sitting on a 7:1 ratio, you may be leaving market share on the table. Many growth-stage operators treat a very high ratio as a sign they can raise the sales and marketing budget.
Why CAC payback matters as much as the ratio#
The ratio ignores time. Two companies can both report 3:1:
- Company A recovers CAC in 12 months, and customers stay 6 years.
- Company B recovers CAC in 36 months, and customers stay 9 years.
Company B has to fund three years of negative cash per customer before it breaks even on that customer. If it grows fast, that gap compounds, and it can run out of cash while its ratio looks fine. That's why most finance teams report LTV:CAC and CAC payback together. In mid-market SaaS, a payback under 18 months is a common comfort zone. SMB motions usually aim for less, and enterprise motions can tolerate more.
Why is my LTV to CAC ratio misleading?#
The formula is simple enough that it's easy to fool yourself with it. These are the recurring traps:
- Early-stage churn data. If you have 14 months of history and 0.8% monthly churn, the formula implies a 10-year customer life. You haven't observed that. Cap lifetime at 3–5 years until you have real cohort data.
- Blended segments. Enterprise customers churning at 0.5% and SMB customers churning at 4% average out to a number that describes neither. Calculate separately.
- Lagged CAC. If your sales cycle is 90 days, this quarter's customers came from last quarter's spend. Match spend to the cohort it produced, or at least lag it by one cycle.
- Ignoring expansion. If you have strong net revenue retention, logo-churn LTV understates value. Use net revenue churn (which can be negative) for a truer picture, and label it clearly.
- Excluding tooling and data. Your sequencer, contact database, and verification spend are acquisition costs. Leaving them out flatters CAC.
How does LTV to CAC compare to other unit economics metrics?#
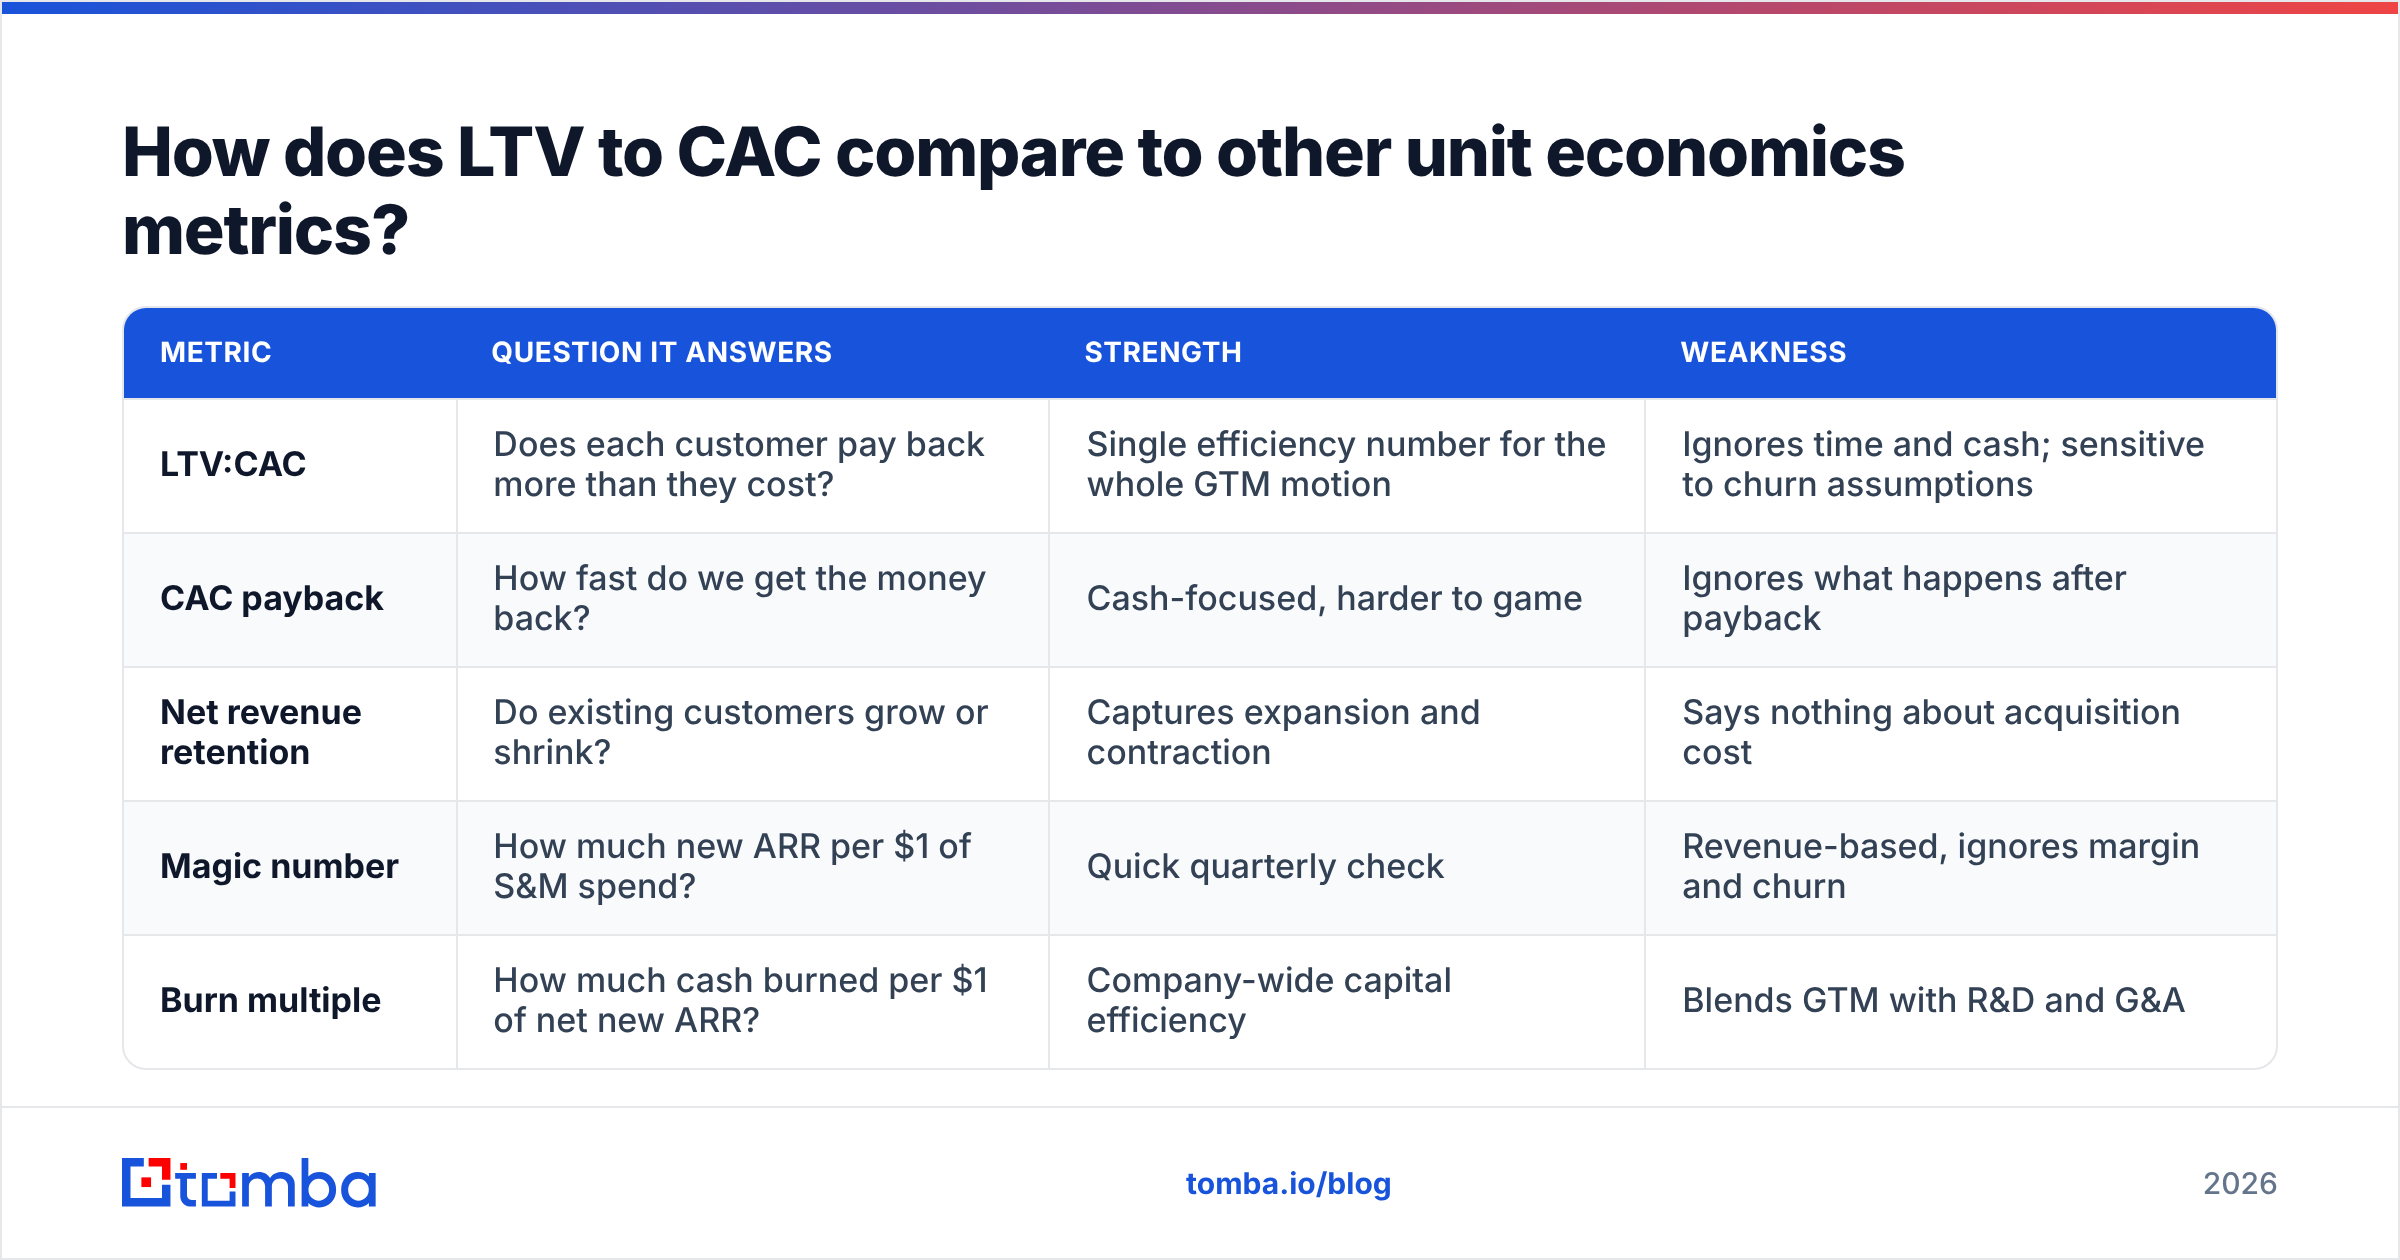
The ratio works best next to other metrics:
| Metric | Question it answers | Strength | Weakness |
|---|---|---|---|
| LTV:CAC | Does each customer pay back more than they cost? | Single efficiency number for the whole GTM motion | Ignores time and cash; sensitive to churn assumptions |
| CAC payback | How fast do we get the money back? | Cash-focused, harder to game | Ignores what happens after payback |
| Net revenue retention | Do existing customers grow or shrink? | Captures expansion and contraction | Says nothing about acquisition cost |
| Magic number | How much new ARR per $1 of S&M spend? | Quick quarterly check | Revenue-based, ignores margin and churn |
| Burn multiple | How much cash burned per $1 of net new ARR? | Company-wide capital efficiency | Blends GTM with R&D and G&A |
If you can only track two, track LTV:CAC and CAC payback. Add net revenue retention once expansion revenue becomes a meaningful share of growth.
How do you improve your LTV to CAC ratio?#
There are two ways to move the ratio: raise LTV or lower CAC. In practice, the LTV side often gives more leverage, because churn sits in the denominator of the LTV formula.
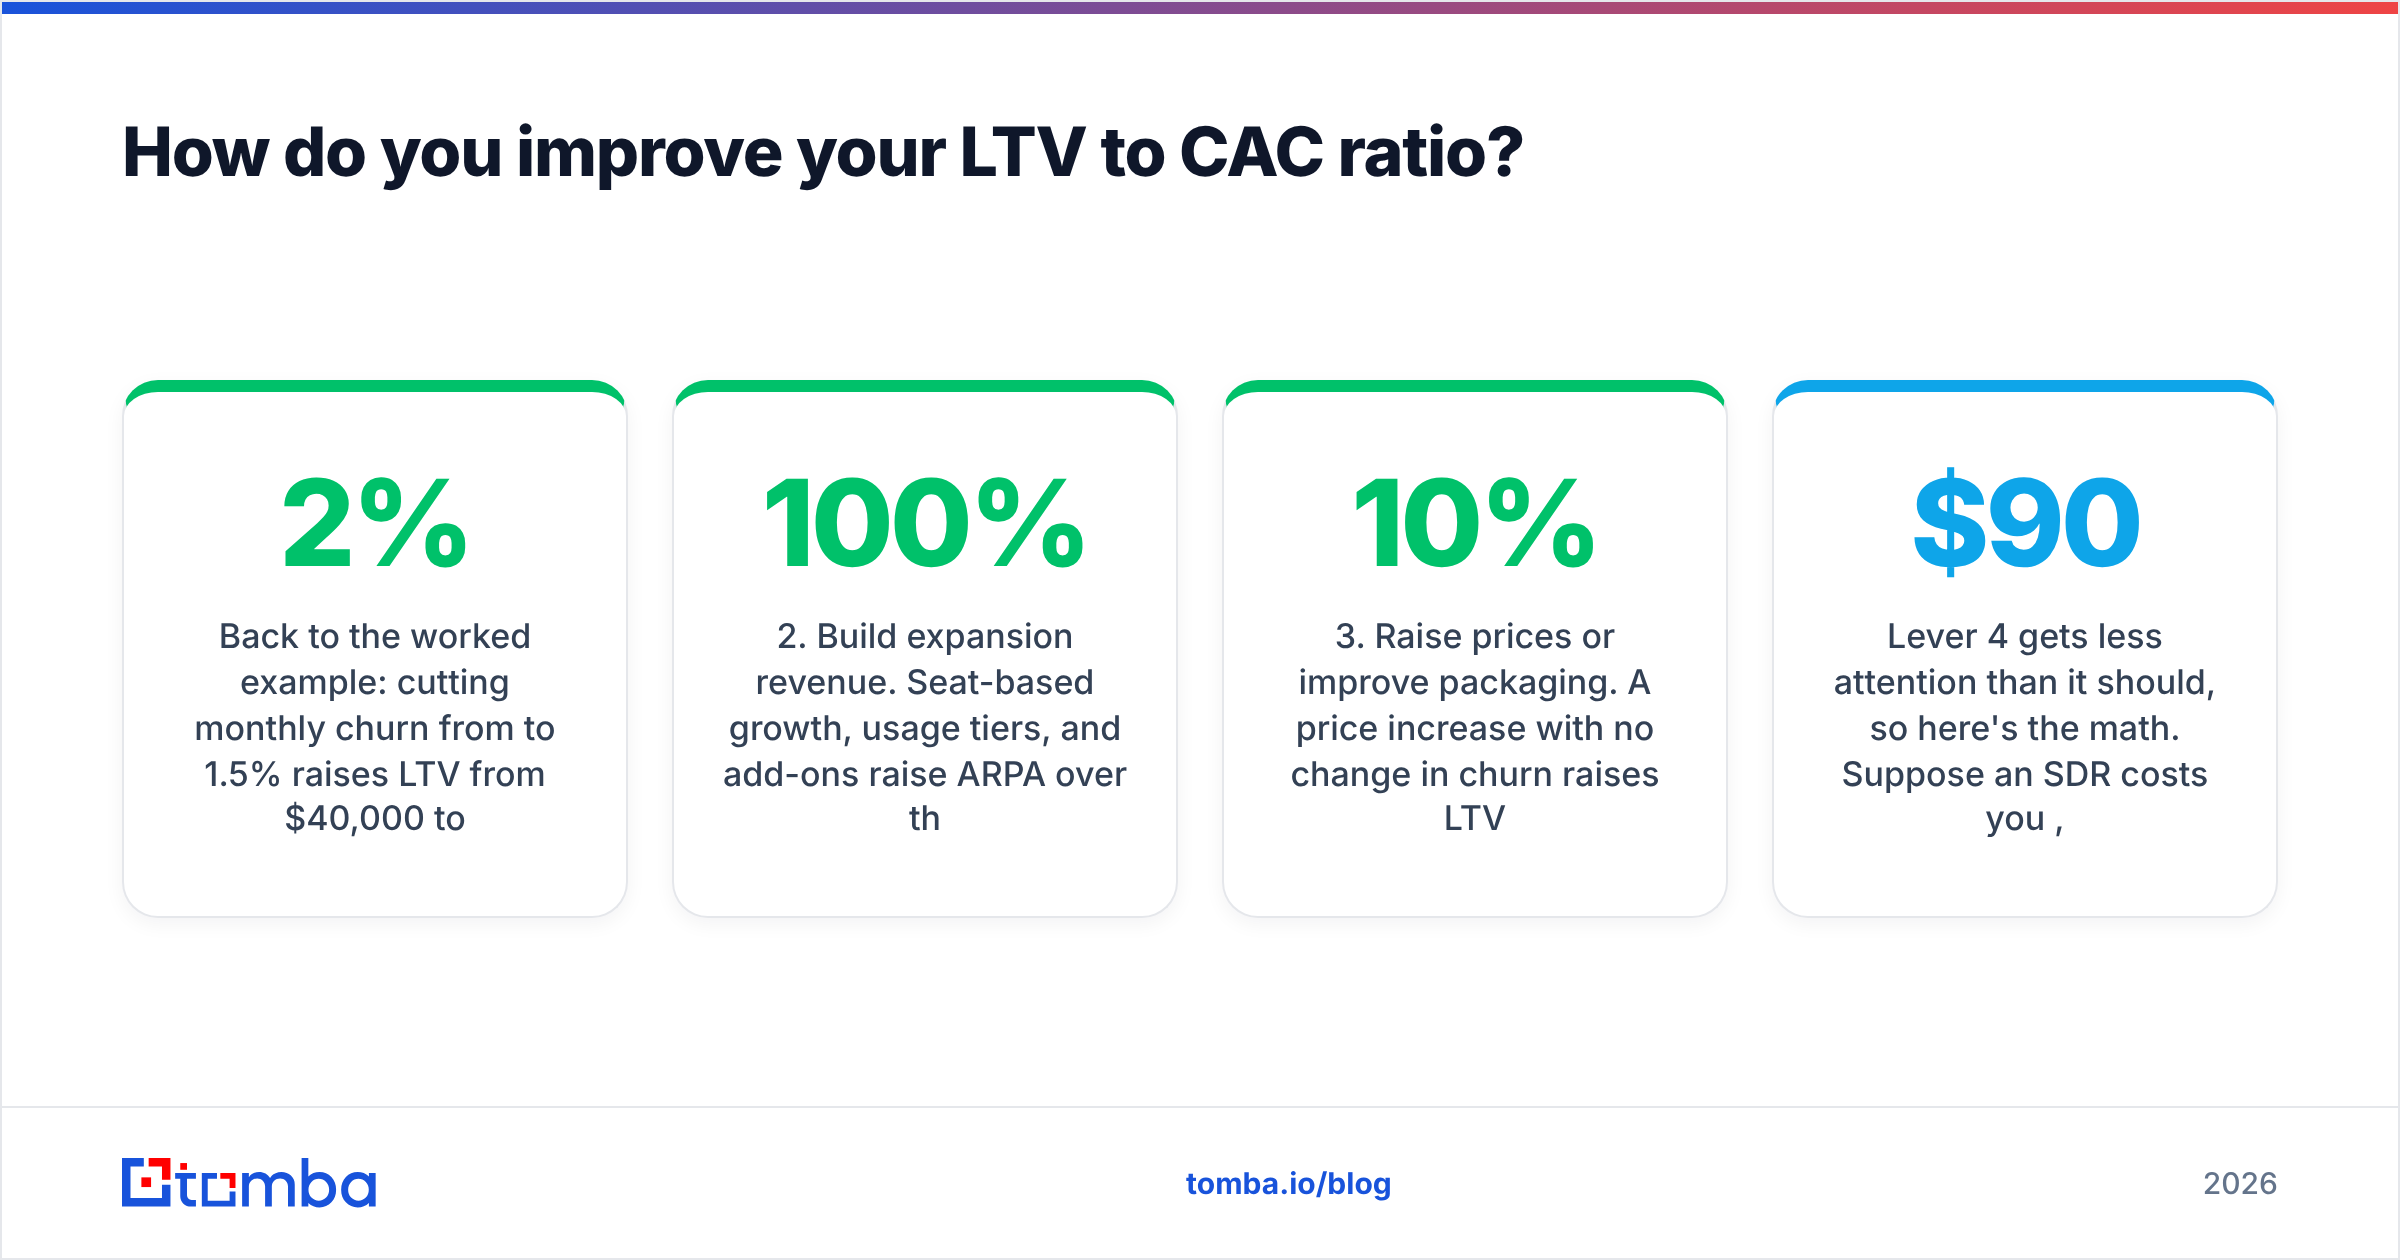
Back to the worked example: cutting monthly churn from 2% to 1.5% raises LTV from $40,000 to about $53,333. The ratio moves from 3.33:1 to 4.44:1 without spending anything extra on acquisition. Getting the same result from the CAC side would take a cut of roughly 25%, to about $9,000.
Here are the levers, in rough order of impact:
- Reduce churn at the source. Most churn happens because the wrong customers signed up. Tighten your ICP so sales stops closing accounts that were never going to succeed. Improve onboarding time-to-value, and use health scoring to flag at-risk accounts before renewal.
- Build expansion revenue. Seat-based growth, usage tiers, and add-ons raise ARPA over the customer lifetime. Net revenue retention above 100% means your existing base grows even before new logos come in.
- Raise prices or improve packaging. A 10% price increase with no change in churn raises LTV by 10%. Most B2B companies under-price, and annual prepay discounts also improve cash flow and payback.
- Cut waste in outbound, not just spend. Much of CAC is rep time, and much rep time goes to bad records: bounced emails, wrong contacts, and accounts outside your ICP. Cleaner data means more conversations per SDR hour, which lowers CAC without cutting headcount.
- Reallocate by channel. Calculate LTV:CAC per channel. It's common to find that referrals and partner deals run at 8:1 while one paid channel runs at 1.2:1. Move budget toward the channels that actually pay back.
Where contact data fits into CAC#
Lever 4 gets less attention than it should, so here's the math. Suppose an SDR costs you $90,000 a year fully loaded and books 12 qualified meetings a month. If 20% of the contacts they work are wrong or undeliverable, you're paying for that waste in salary, tool seats, and damage to sender reputation, which lowers inbox placement on every other send.
The fixes are practical:
- Find direct, role-matched contacts with an email finder instead of guessing formats or using generic inboxes.
- Run lists through an email verifier before they go into a sequence, so bounces don't hurt the rest of your domain's performance.
- Use data enrichment to add firmographics before routing, so reps only work accounts that fit your ICP.
None of this replaces a good offer or a good product. But in outbound-heavy motions, data quality directly affects CAC, and it's usually cheaper to fix than hiring another SDR.

How should you report LTV to CAC by segment?#
A single company-wide ratio is fine for a board slide. For decisions, split it:
- By segment: SMB, mid-market, enterprise. Churn, ARPA, and CAC all differ by segment, often by a factor of 5 or more.
- By channel: outbound, inbound, paid, partner, product-led. Attribute CAC with whatever model your team trusts, and use the same model every quarter.
- By cohort: customers acquired in Q1 vs Q3. Rising CAC across cohorts often means you've saturated your best-fit audience.
- By rep or team (carefully): useful for coaching, but small sample sizes produce noisy results.
Most teams do this in a spreadsheet fed by CRM data. If your CRM is HubSpot or Salesforce, build a report that pulls closed-won deals by source and segment, then join it with finance's spend data by the same dimensions. The join is usually the hard part, and it's also where you'll find the insights.
A simple monthly cadence#
- Pull new customers, ARPA, and churn by segment from the CRM and billing system.
- Pull fully loaded S&M spend from finance, allocated by segment and channel.
- Calculate LTV, CAC, ratio, and payback for each segment.
- Flag any segment or channel below 2:1 or with payback above your threshold.
- Pick one lever for each flag and assign an owner.
What are the most common LTV to CAC questions?#
Is a higher LTV to CAC ratio always better?#
No. Above roughly 5:1, you may be underinvesting in growth. Very high ratios are common at bootstrapped companies that choose profitability over speed, which is a legitimate choice as long as you make it deliberately.
How often should you calculate it?#
Quarterly for board reporting, monthly for operating decisions. Weekly numbers are too noisy to use, because deal timing swamps the signal.
Can early-stage startups use LTV to CAC?#
Yes, with caution. Before you have 18–24 months of churn data, cap assumed lifetime at 3 years and treat the ratio as directional. CAC payback is more reliable at this stage because it needs less history.
Does LTV to CAC work for transactional or usage-based businesses?#
It does, but define churn carefully. For usage-based pricing, measure revenue retention by cohort rather than logo churn, because a customer who stays but cuts usage by 70% has mostly churned in economic terms. The general idea of a churn rate still applies. Apply it to revenue, not accounts.
Where should you start this quarter?#
Calculate your fully loaded ratio for each segment and put CAC payback next to it. Find the worst channel and the worst segment. Then decide which lever to pull: churn and ICP fit if LTV is weak, or targeting and data quality if CAC is bloated.
If outbound makes up a real share of your CAC, the cheapest fix is often putting reps on accurate, verified contacts. Tomba Email Finder finds professional email addresses by domain, name, or company, so your SDRs spend their hours on conversations instead of bounces. Start on the free tier (25 searches a month), and check Tomba pricing when you're ready to scale. Paid plans start at $49/month.
Related guides#
// get started
Find, verify and enrich your first contacts today
Start on the free plan with 25 searches a month, then scale when your team is ready.
Free plan · No credit card required · GDPR & CCPA
// about the author