Magic Number SaaS: How to Calculate and Use Sales Efficiency
The SaaS magic number tells you whether each dollar of sales and marketing spend is buying growth or burning cash. Here is the formula, the 2026 benchmarks, and the traps that make the number lie.
TL;DR
- The SaaS magic number measures sales efficiency: how much new annualized revenue you add for every dollar of sales and marketing (S&M) spend in the previous quarter.
- Formula: (This quarter's revenue − last quarter's revenue) × 4 ÷ last quarter's S&M spend.
- Rule of thumb: above 0.75 means spend more, 0.5–0.75 means tune before scaling, below 0.5 means fix the go-to-market motion first.
- The number is easy to game and easy to misread. Seasonality, churn, gross margin, and long sales cycles all distort it.
- Bad contact data quietly drags it down, because bounced emails and wrong numbers are S&M spend that buys no pipeline.
What is the magic number in SaaS?#
The SaaS magic number is a sales efficiency ratio. It answers one question: if you put another dollar into sales and marketing, how much recurring revenue comes back?
Think of it as the fuel economy rating for your go-to-market engine. Two cars can both get you to $10M ARR. One burns twice as much fuel doing it. Investors, boards, and CFOs use the magic number to tell those two cars apart.
The metric became popular through Scale Venture Partners (scalevp.com), which pushed it as a simple way to decide when a software-as-a-service company should step on the gas. It took off because it uses only two inputs that every finance team already tracks: revenue and S&M expense.
The magic number doesn't tell you why your engine is efficient or not. It tells you whether the engine works well enough to be worth feeding. You diagnose from there.
How do you calculate the SaaS magic number?#
The standard formula uses quarterly GAAP revenue:
Magic Number = (Revenue in Q − Revenue in Q-1) × 4 ÷ S&M Expense in Q-1
Here's what each piece does:
- Revenue in Q − Revenue in Q-1: the quarter-over-quarter revenue increase. This is new growth, net of churn.
- × 4: annualizes the quarterly increase so you compare it to a full year of revenue impact.
- ÷ S&M expense in Q-1: divides by the previous quarter's spend, because deals closed this quarter were mostly sourced and worked last quarter.
A worked example#
Say your company reports:
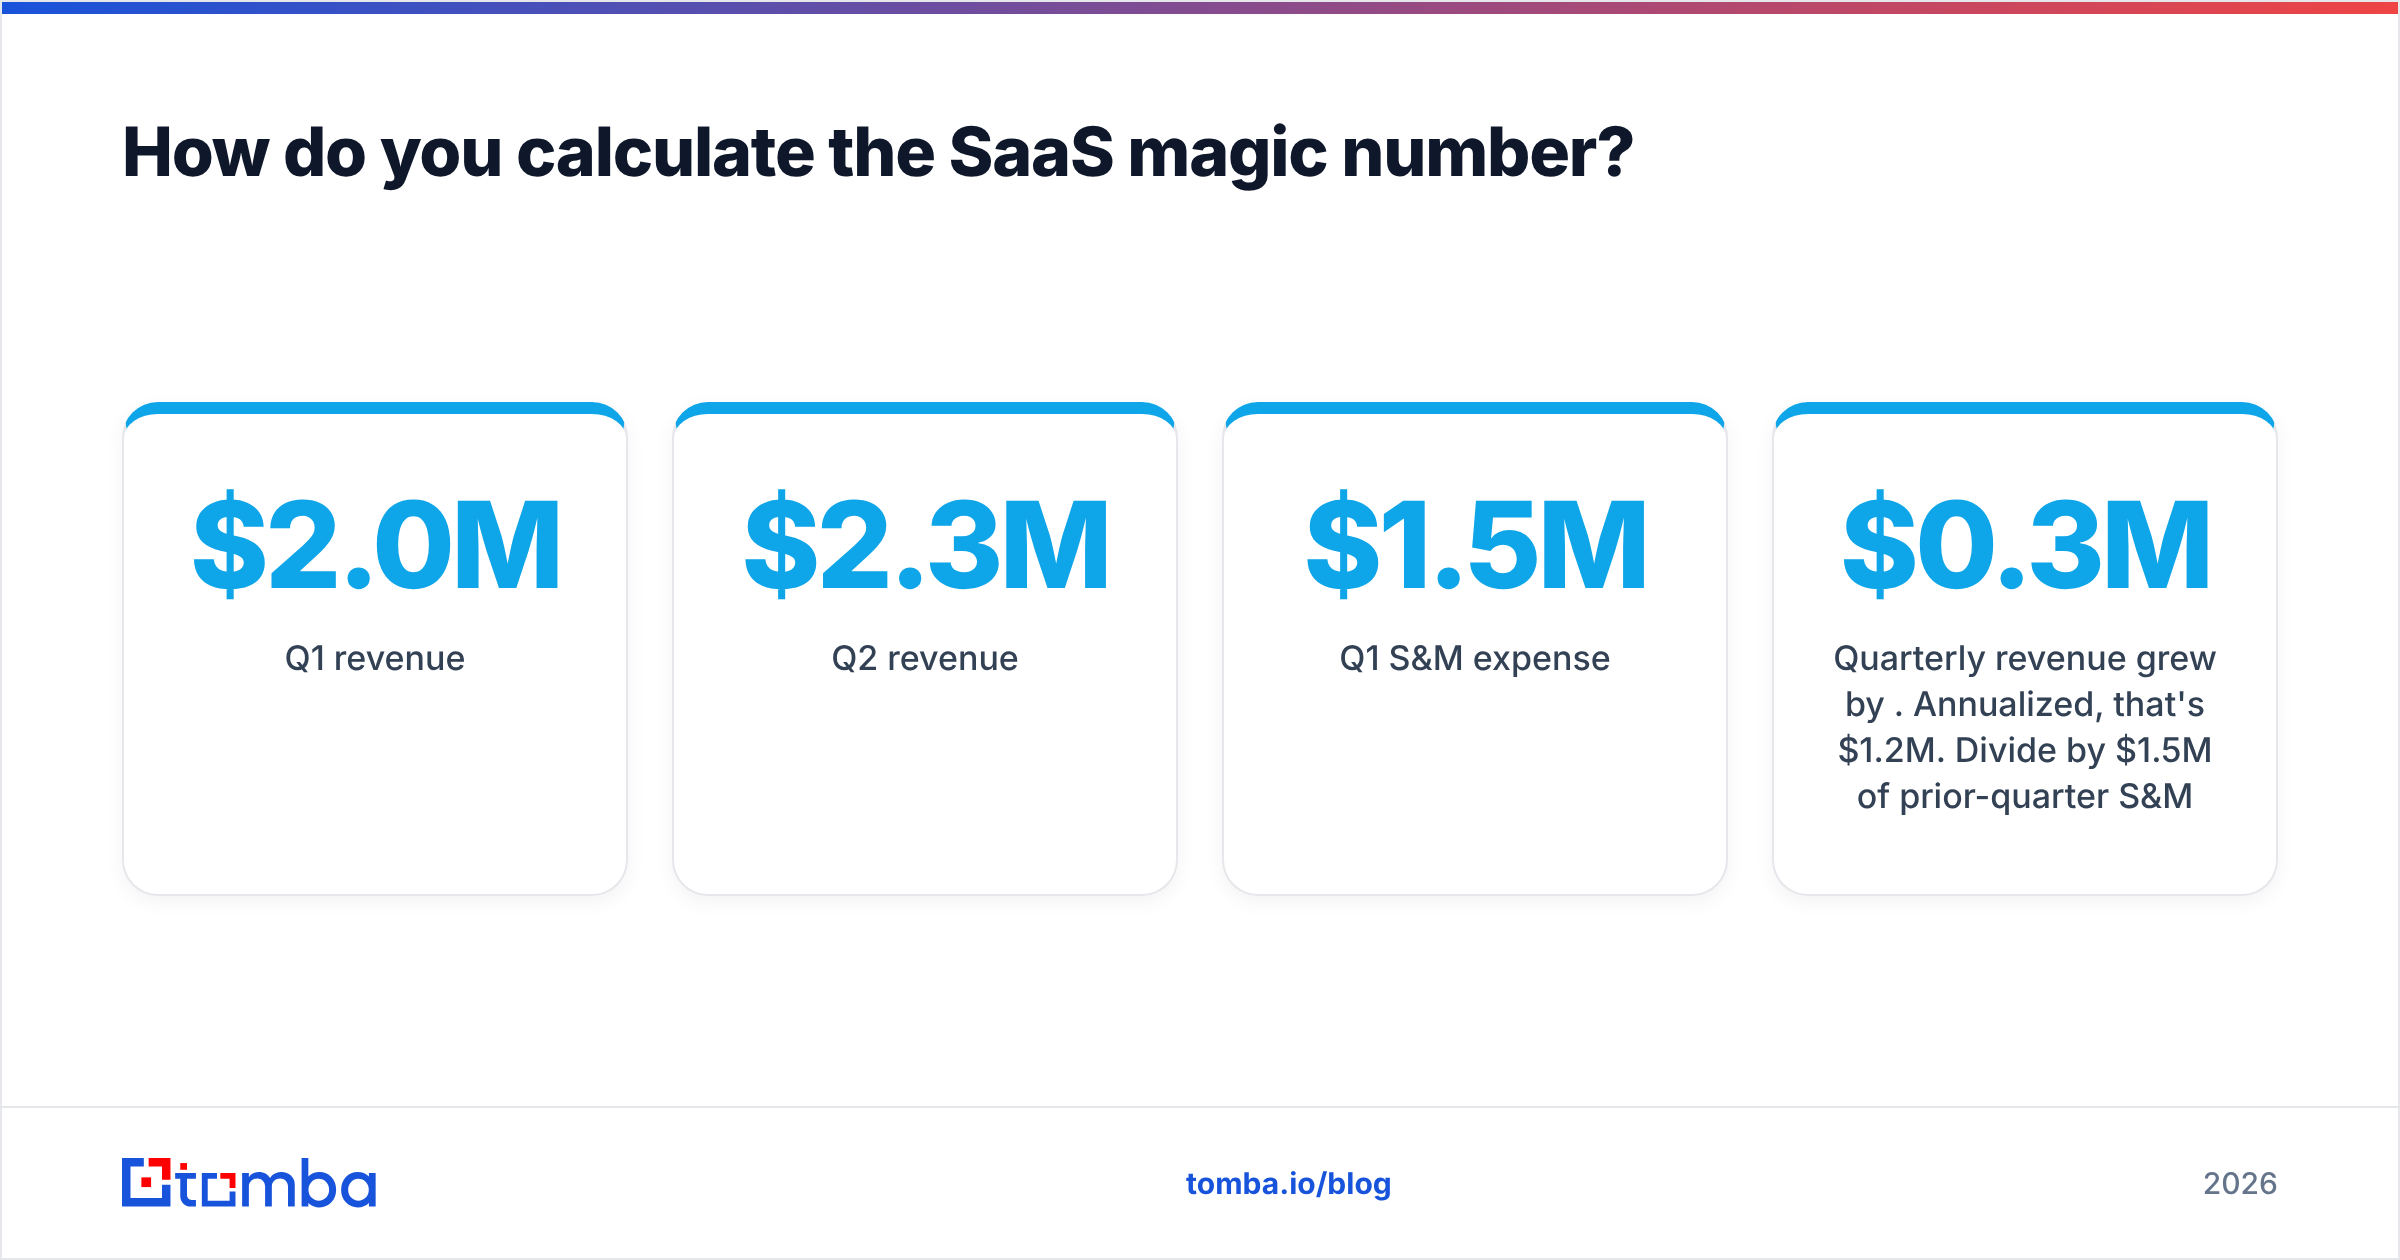
- Q1 revenue: $2.0M
- Q2 revenue: $2.3M
- Q1 S&M expense: $1.5M
Quarterly revenue grew by $0.3M. Annualized, that's $1.2M. Divide by $1.5M of prior-quarter S&M spend and you get a magic number of 0.8.
Put simply: every dollar you spent on sales and marketing in Q1 produced about 80 cents of new annual recurring revenue. With typical SaaS gross margins, that dollar pays itself back in roughly 15–18 months. That's healthy.
The ARR-based variant#
Many companies, especially those with usage-based or annual-upfront billing, swap GAAP revenue for ARR:
Magic Number (ARR) = Net New ARR in Q ÷ S&M Expense in Q-1
You don't need the ×4 here because ARR is already annualized. This version is usually cleaner. GAAP revenue recognition smooths deals across months, so it can hide a strong or weak quarter. Pick one version and stick with it, because switching between them makes trend lines meaningless.
The gross-margin-adjusted variant#
A stricter version multiplies the revenue increase by gross margin. A company with 85% gross margins and one with 55% margins don't get the same value from a dollar of new revenue. If you run services-heavy SaaS or pay large infrastructure costs, the adjusted version gives you the more honest number.
What is a good SaaS magic number?#
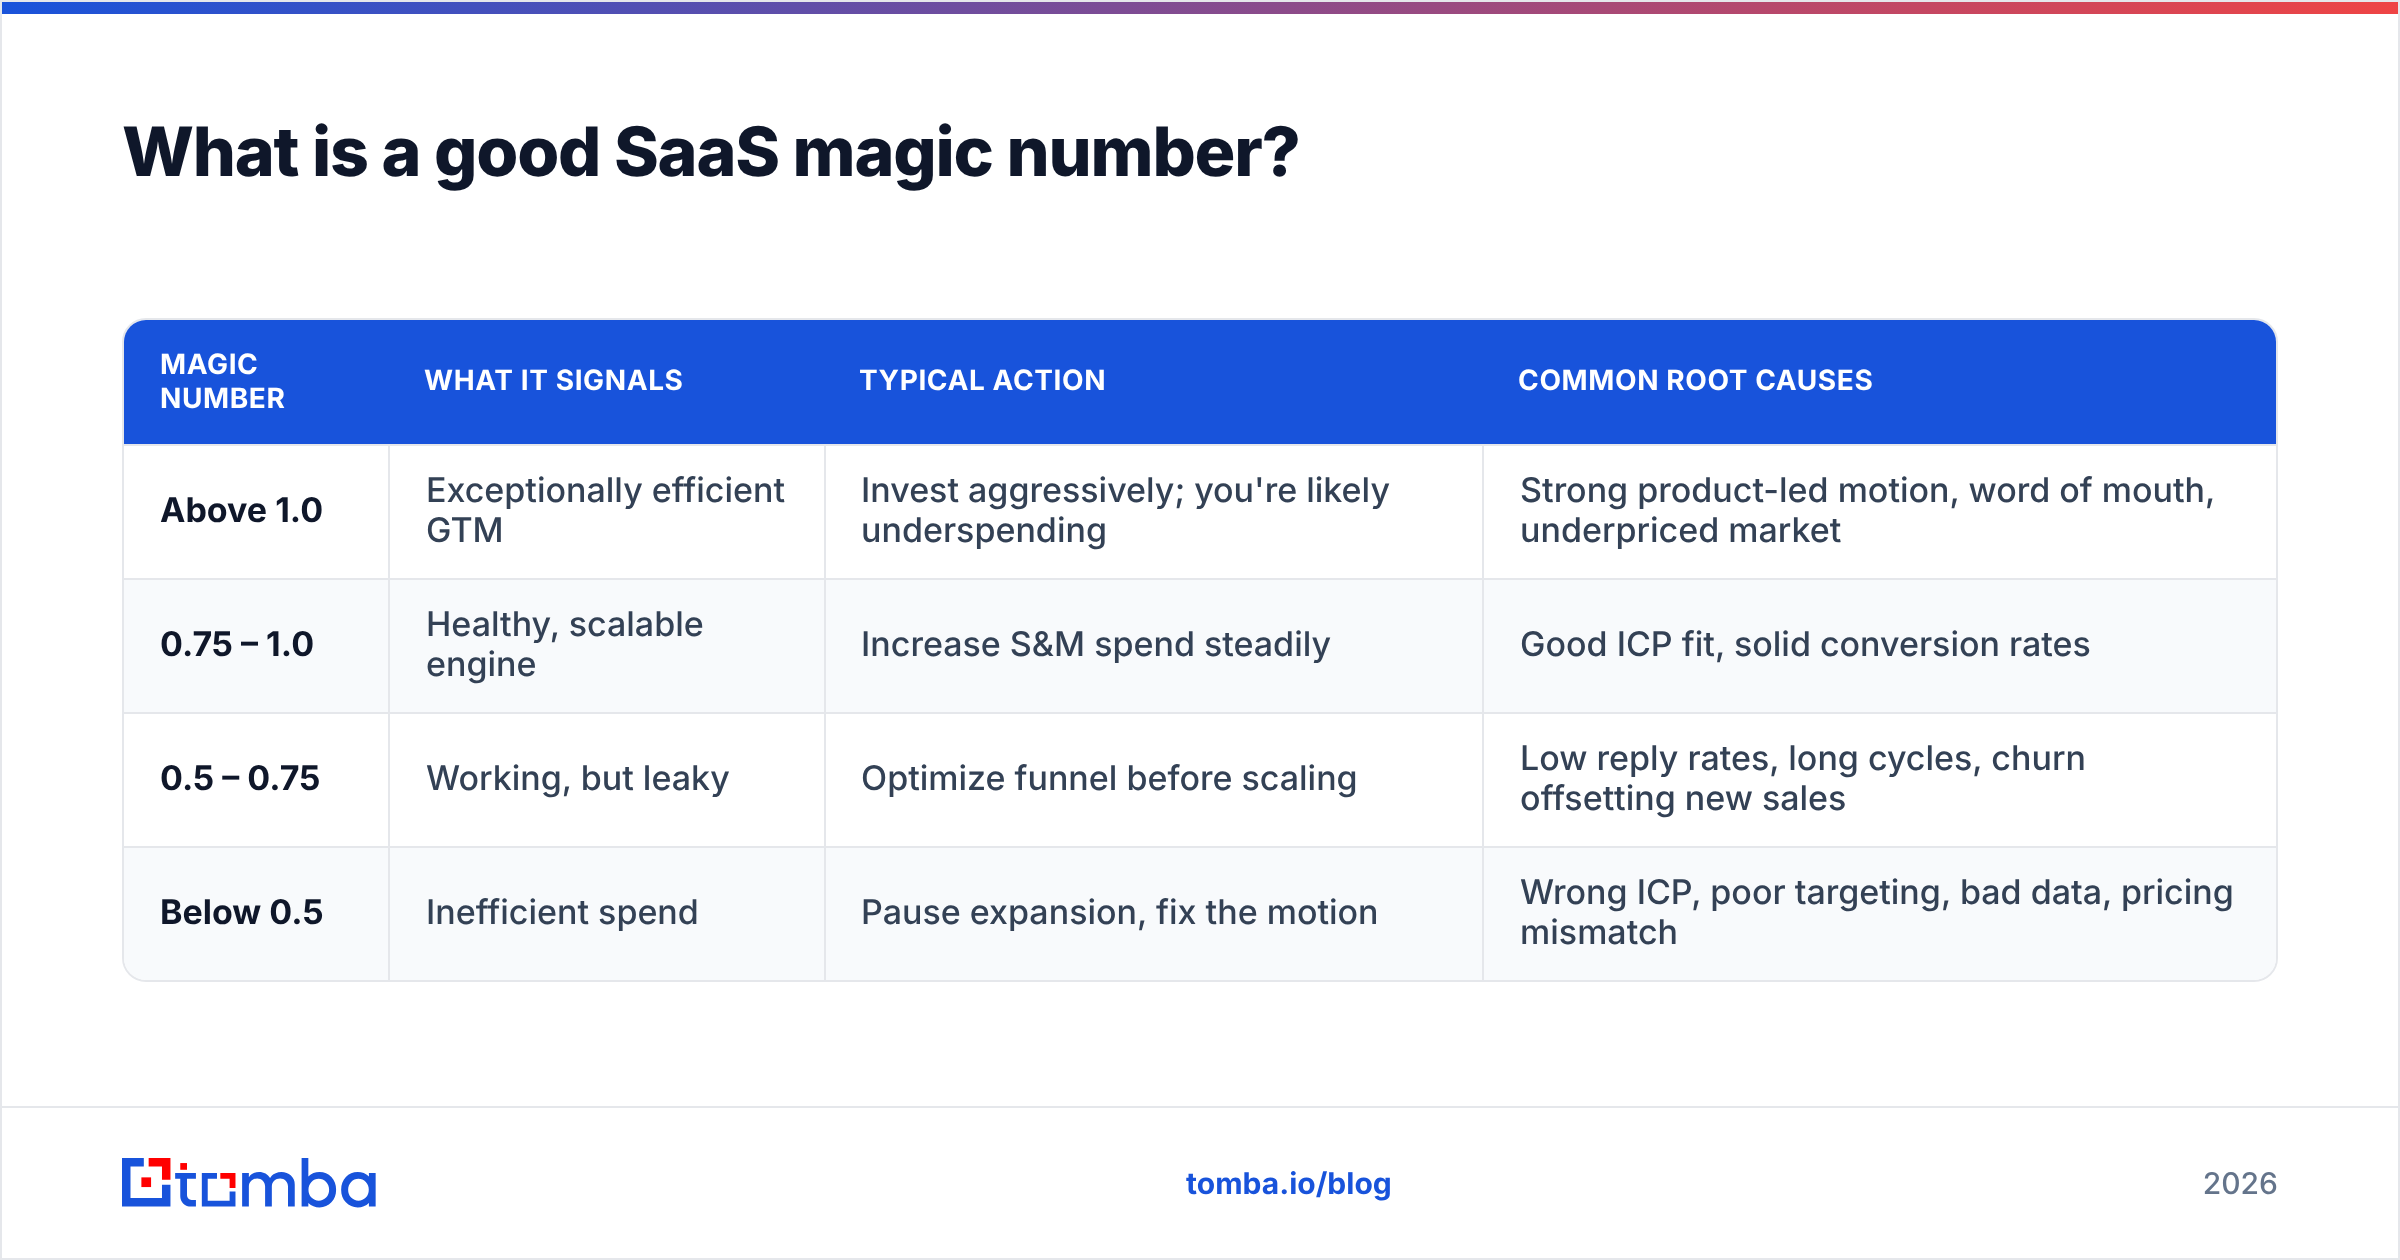
The thresholds below are widely used. Treat them as starting points for discussion, not laws.
| Magic number | What it signals | Typical action | Common root causes |
|---|---|---|---|
| Above 1.0 | Exceptionally efficient GTM | Invest aggressively; you're likely underspending | Strong product-led motion, word of mouth, underpriced market |
| 0.75 – 1.0 | Healthy, scalable engine | Increase S&M spend steadily | Good ICP fit, solid conversion rates |
| 0.5 – 0.75 | Working, but leaky | Optimize funnel before scaling | Low reply rates, long cycles, churn offsetting new sales |
| Below 0.5 | Inefficient spend | Pause expansion, fix the motion | Wrong ICP, poor targeting, bad data, pricing mismatch |
Stage changes the picture. A seed-stage company with three reps and a founder who sells will often post a spiky magic number above 1.0, then watch it fall once professional sales hiring starts. A late-stage company in a crowded category may sit at 0.6 and still have a fine business if net revenue retention is high.
In 2026, benchmark surveys of private SaaS companies keep putting the median somewhere between 0.5 and 0.8. Efficiency standards got stricter after the 2022–2023 funding reset. Growth at any cost stopped being fundable, and the magic number went back to the top of board decks.

Is the magic number better than CAC payback or the burn multiple?#
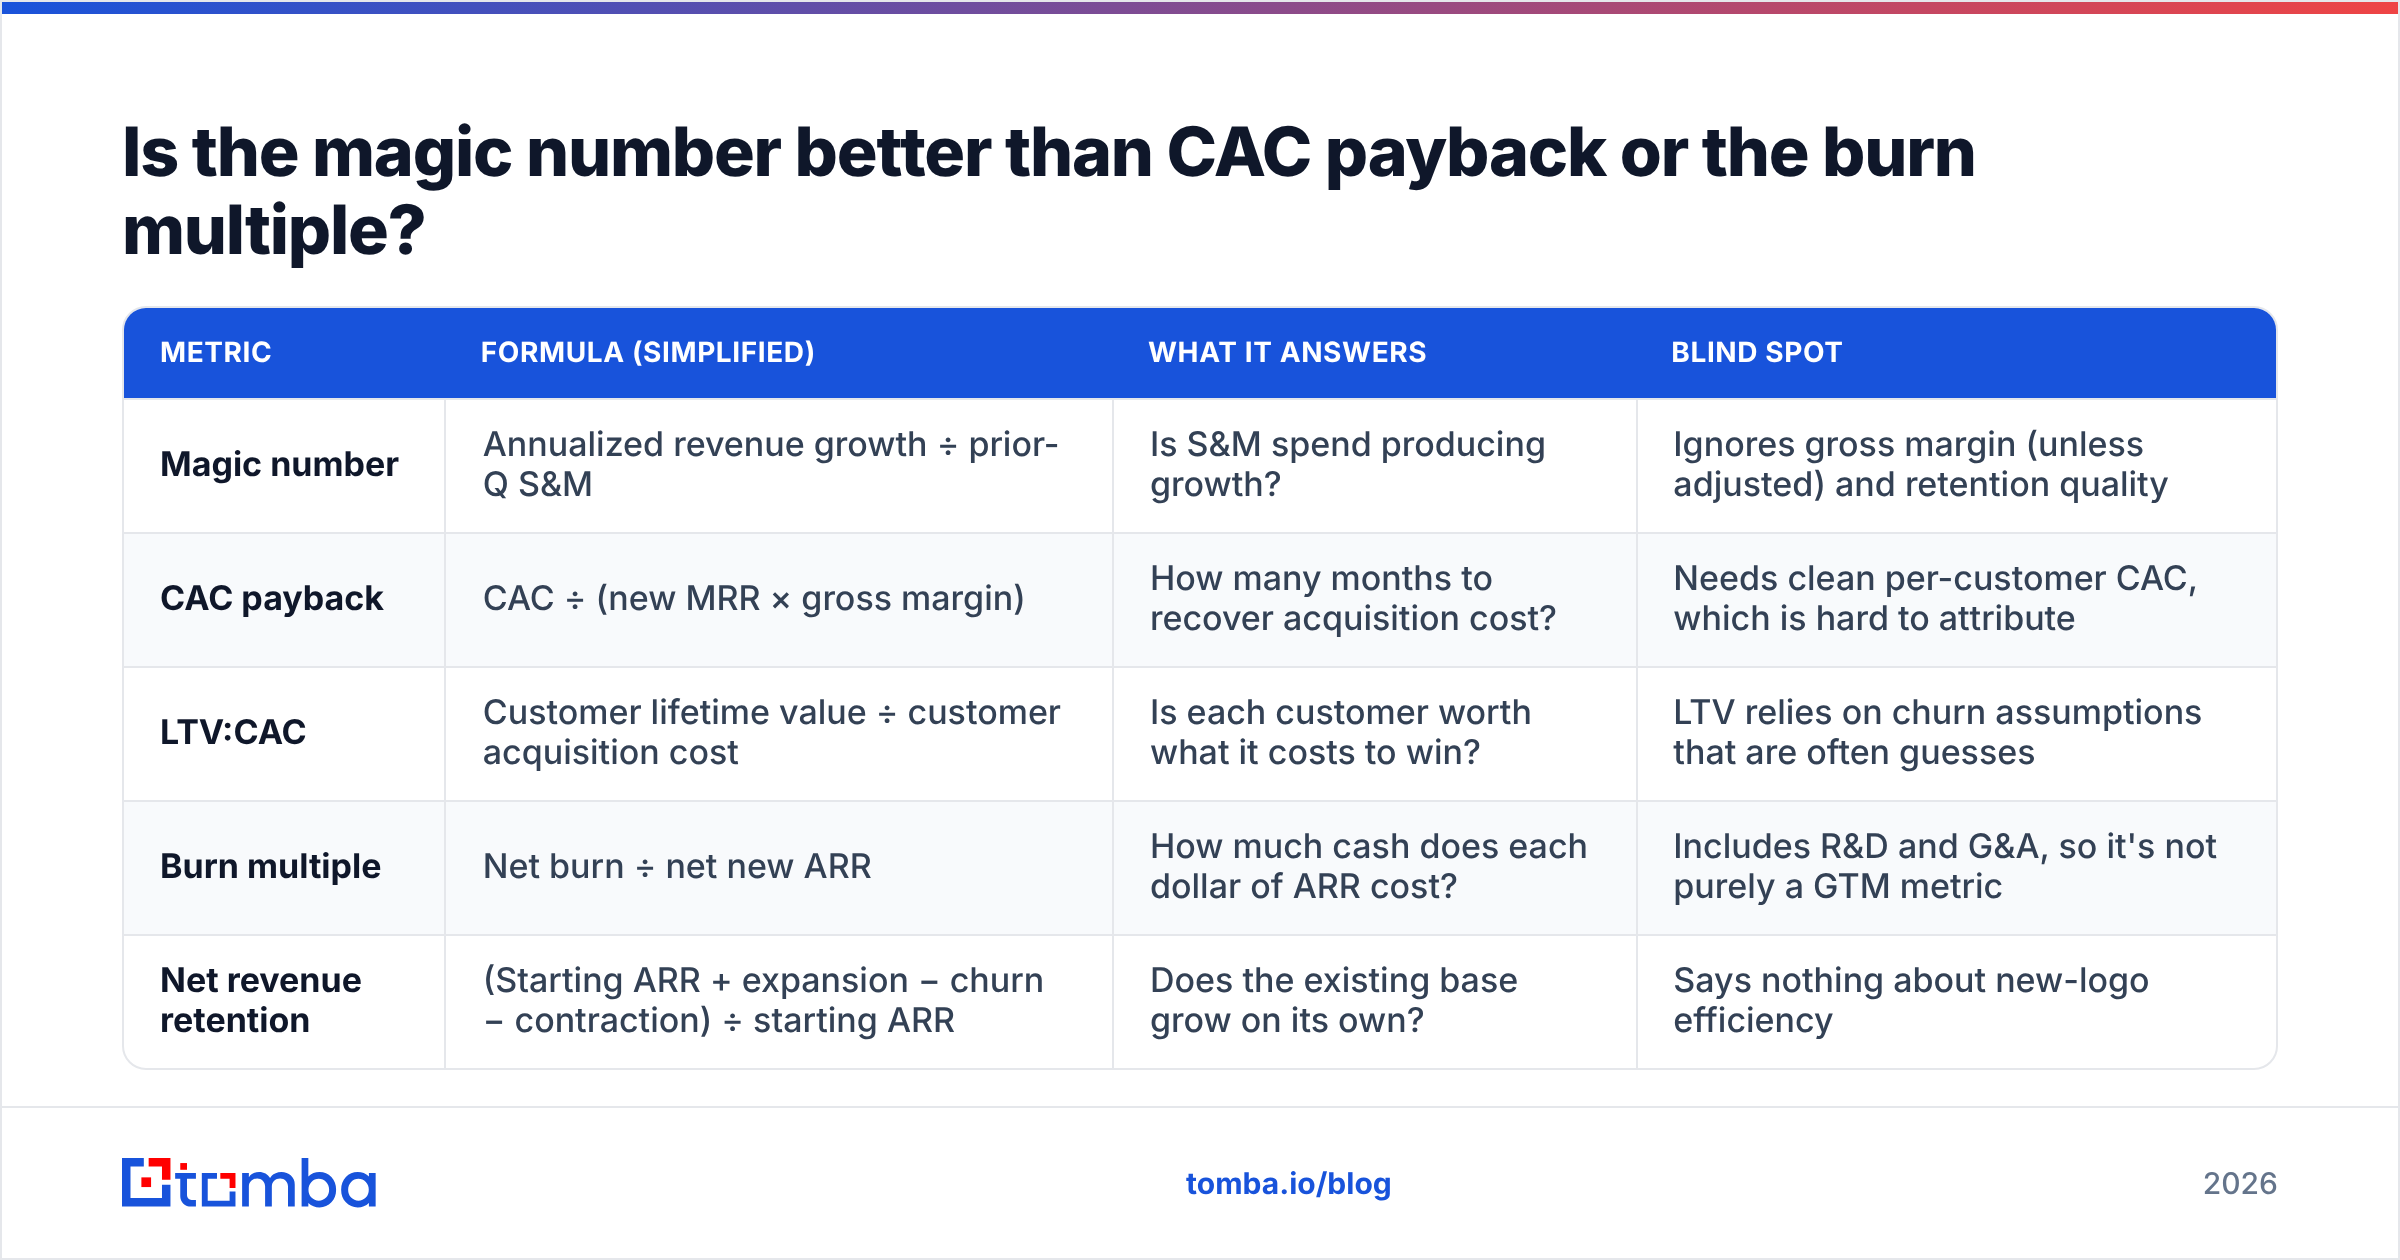
None of them is better on its own. They answer different questions, and a strong RevOps team tracks all of them together.
| Metric | Formula (simplified) | What it answers | Blind spot |
|---|---|---|---|
| Magic number | Annualized revenue growth ÷ prior-Q S&M | Is S&M spend producing growth? | Ignores gross margin (unless adjusted) and retention quality |
| CAC payback | CAC ÷ (new MRR × gross margin) | How many months to recover acquisition cost? | Needs clean per-customer CAC, which is hard to attribute |
| LTV:CAC | Customer lifetime value ÷ customer acquisition cost | Is each customer worth what it costs to win? | LTV relies on churn assumptions that are often guesses |
| Burn multiple | Net burn ÷ net new ARR | How much cash does each dollar of ARR cost? | Includes R&D and G&A, so it's not purely a GTM metric |
| Net revenue retention | (Starting ARR + expansion − churn − contraction) ÷ starting ARR | Does the existing base grow on its own? | Says nothing about new-logo efficiency |
The magic number is basically CAC payback viewed from the top down. CAC payback works from individual customers up. The magic number works from the P&L down. When the two disagree sharply, your cost attribution is usually broken, and that's a revenue operations problem worth fixing before anyone reads the numbers too closely.
Why does the magic number lie sometimes?#
The formula is simple, and that's both its strength and its weakness. Here are the distortions that catch teams most often.
Seasonality#
If Q4 is your big closing quarter, the Q4 magic number will look great and Q1 will look terrible. Use a trailing four-quarter version: total annualized revenue growth over the year divided by total S&M over the matching lagged period. It smooths out the calendar.
Sales cycle length#
The one-quarter lag assumes deals close about 90 days after the money is spent. Enterprise deals with nine-month cycles break that assumption. If you sell six-figure contracts, try a two-quarter lag, or compare the magic number against S&M from two quarters back.
Churn masking#
The revenue increase is net. A team that closes $1M in new ARR and loses $600K to churn shows the same magic number as a team that closes $400K and loses nothing. The second team has a sales problem. The first has a retention problem. Split the number into a gross new-business magic number and a churn drag so you can see which one you have.
Expense classification#
Is your SDR team in S&M? Your customer success team? Your sales engineers? Your share of the CRM bill? Different classification choices can move the number by 0.2 or more. Write the definition down, document it in your board deck, and don't change it quietly.
One-time spikes#
A single large deal, a pricing change, or an acquisition can push one quarter's number into nonsense territory. Read the trend, not the single data point.
What actually moves the magic number up?#
You have two levers: grow the numerator (revenue added) or shrink the denominator (S&M spend), without hurting the other. In practice, the biggest gains come from cutting waste inside the S&M budget, not from cutting the budget.
- Tighten your ICP. Every rep-hour spent on accounts that will never buy goes straight into the denominator and adds nothing to the numerator. Firmographic and technographic filters pay for themselves fast.
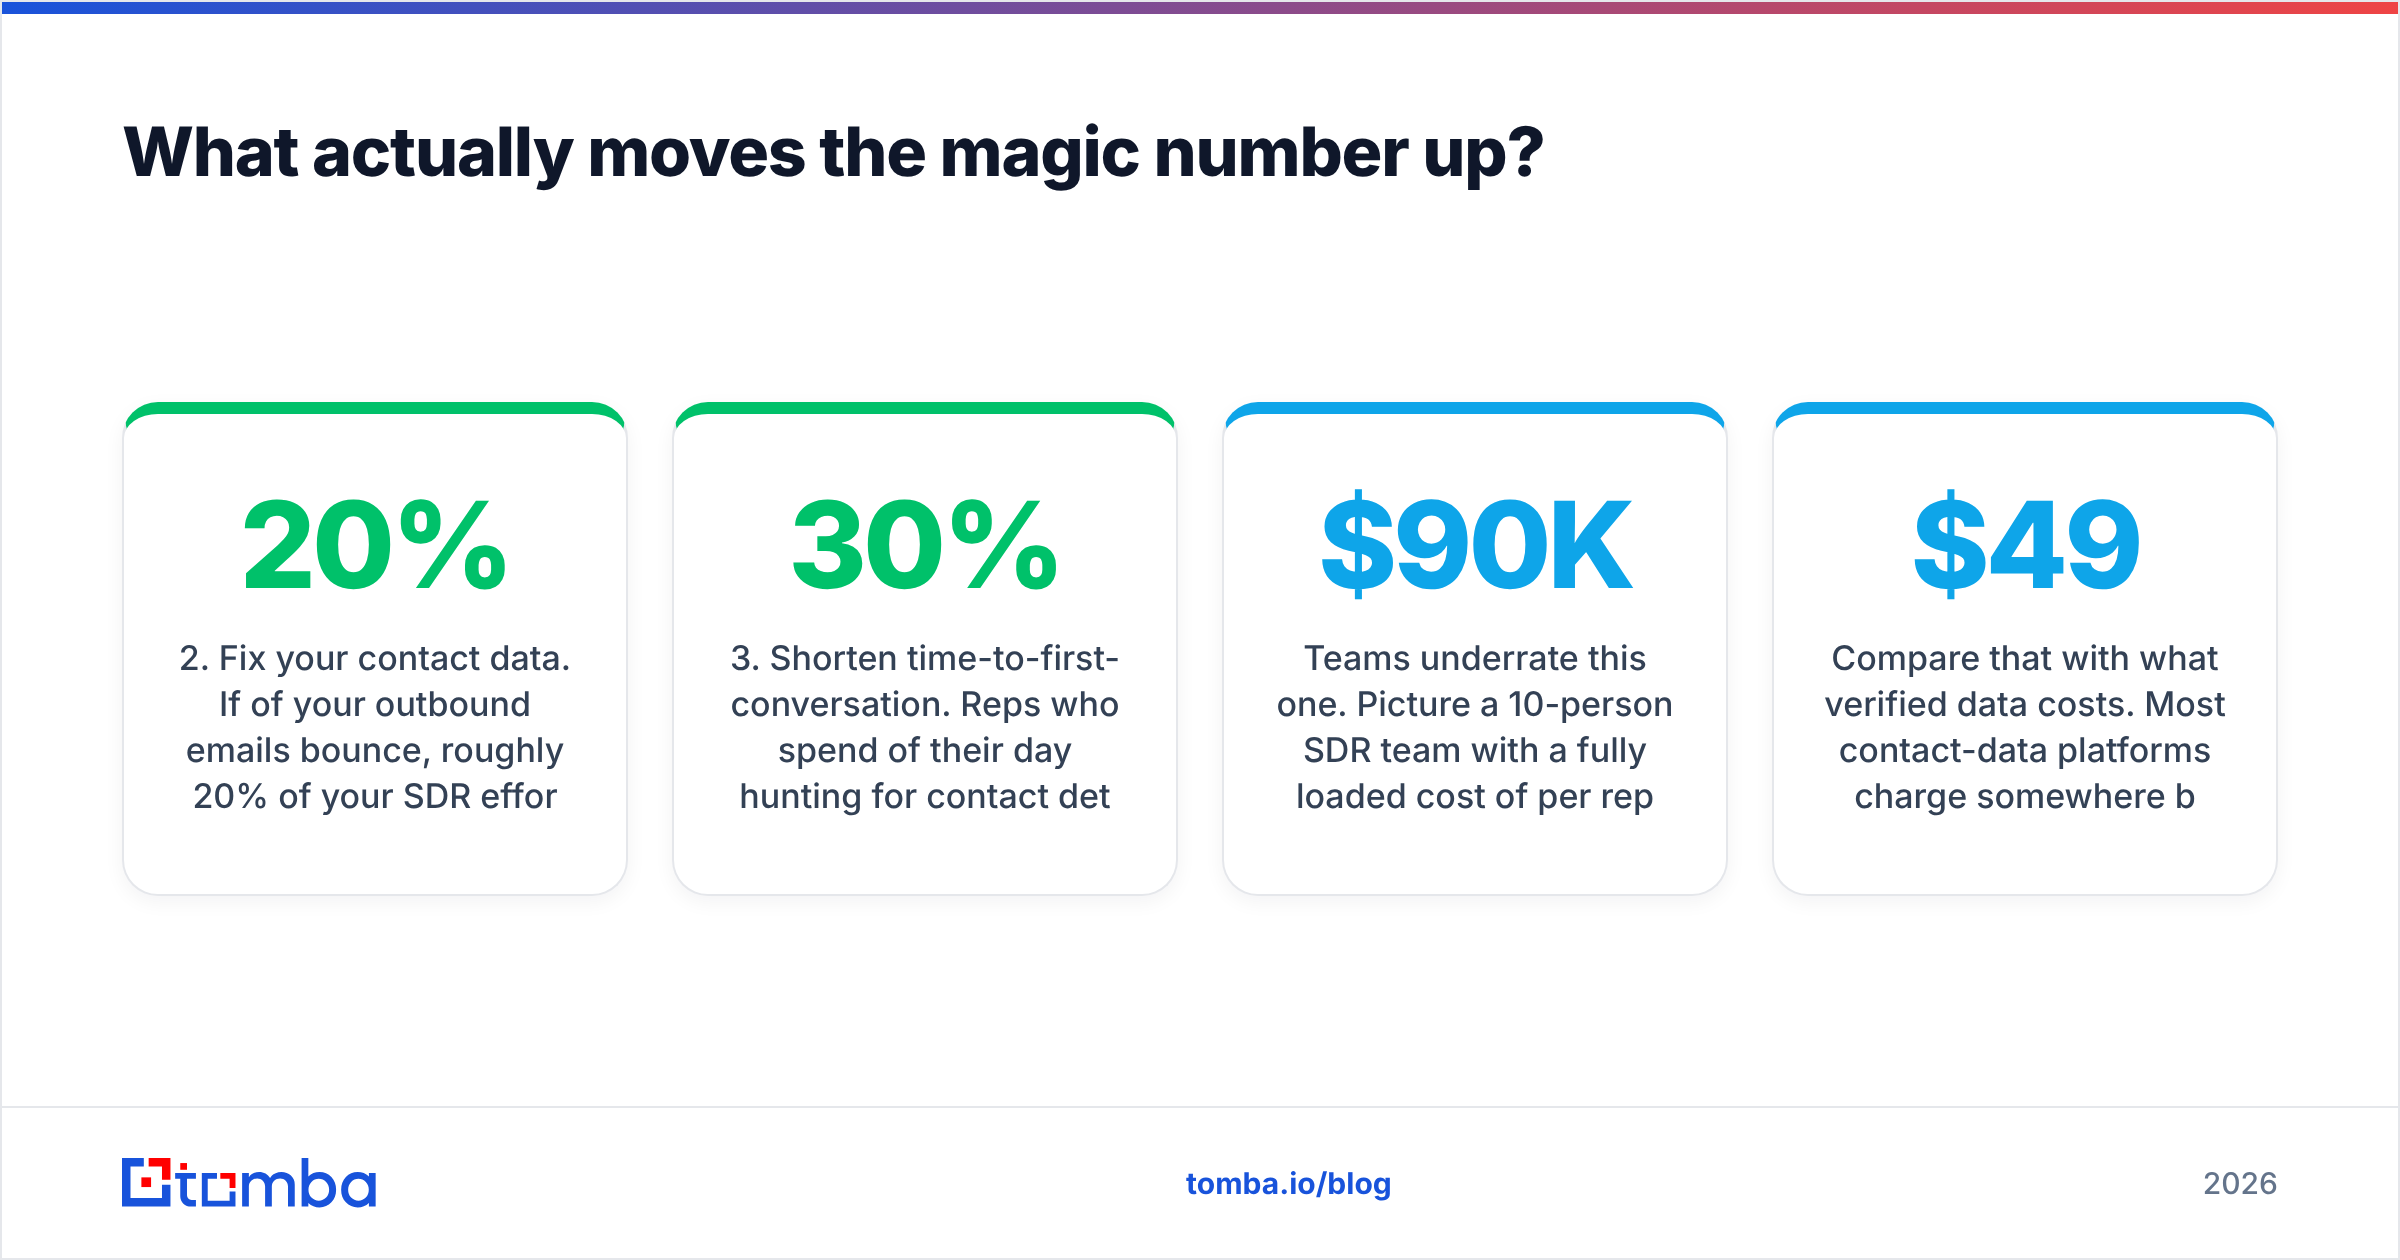
- Fix your contact data. If 20% of your outbound emails bounce, roughly 20% of your SDR effort is producing nothing, and the bounces damage your sender reputation for the other 80%. Running lists through an email verifier before sequences go live is one of the cheapest efficiency gains available.
- Shorten time-to-first-conversation. Reps who spend 30% of their day hunting for contact details are expensive researchers. An email finder or enrichment tool that returns verified addresses in seconds turns that time back into selling time.
- Improve conversion between stages. A 5-point lift in demo-to-close moves the magic number more than almost any budget change. Look at the stage where most deals stall and fix that one first.
- Lean into expansion revenue. Upsells and cross-sells usually cost a fraction of new-logo acquisition. Because the magic number uses net revenue change, strong expansion lifts it directly.
- Cut channels that don't convert. Paid channels with high CAC and low intent can stay in the budget for years because nobody reviews them. Audit each channel's contribution quarterly.
The data-quality multiplier#
Teams underrate this one. Picture a 10-person SDR team with a fully loaded cost of $90K per rep. That's $900K a year in the denominator. If bad data wastes 15% of their outreach through bounces, wrong-person contacts, and dead numbers, about $135K a year of S&M spend buys nothing.
Compare that with what verified data costs. Most contact-data platforms charge somewhere between $49 and a few hundred dollars per month per seat for credit-based plans. For reference, Tomba pricing starts with a free tier of 25 searches per month and paid plans from $49/mo. Apollo, Hunter, BookYourData, and other providers sit in similar bands with different trade-offs in coverage and credit limits. Peer review sites like G2 are a reasonable place to compare accuracy reports from real users before you pick one.
The point isn't which vendor you choose. The point is that data spend is a tiny line item that changes how efficient the other 95% of your S&M budget is.
How should you report the magic number to your board?#
Boards have seen every kind of manipulated SaaS metric. Earn their trust with consistency and context.
- Show the trailing four quarters, not just the latest one. One quarter is noise. Four quarters is a trend.
- State your definition on the slide. GAAP or ARR-based? Gross-margin adjusted? Which teams count as S&M?
- Pair it with CAC payback and NRR. The magic number alone invites the question "but what about churn?" Answer it before anyone asks.
- Segment it. Report separate magic numbers for SMB versus enterprise, or inbound versus outbound, if the motions are different. A blended 0.7 might be a 1.2 inbound engine carrying a 0.3 outbound team.
- Tie it to a decision. "Magic number is 0.85 for three straight quarters, so we're proposing a 25% increase in AE headcount" is a far stronger slide than a number on its own.
When should you ignore the magic number?#
There are a few situations where the magic number gives you very little useful information:
- Pre-product-market fit. With a handful of customers and founder-led sales, the ratio swings wildly and means little. Focus on retention and qualitative signals first.
- Pure product-led growth with minimal S&M. If almost all growth comes from self-serve signups and your S&M line is tiny, the magic number can hit 3.0 or higher and still tell you nothing useful about scaling. Look at activation and conversion rates instead.
- Right after a major pricing change. Revenue jumps from repricing the existing base inflate the numerator without any GTM improvement behind them.
- During an acquisition. Acquired revenue makes the quarter-over-quarter change meaningless until the acquired base is fully lapped.
In these cases, keep calculating it so the history stays continuous. Just don't make spending decisions based on it.
How do you build a magic number dashboard in your CRM?#
Most teams start in a spreadsheet and move into their BI or CRM reporting once the definitions settle. A working setup needs:
- A revenue source of truth: your billing system or finance-approved ARR snapshot, pulled at quarter close.
- An S&M expense feed: payroll for GTM teams, tooling, paid media, events, and agency fees, mapped to quarters. Your finance team's GL export usually has this.
- Segment tags: deal-level tags for segment, region, and source, so you can calculate segmented magic numbers.
- A lag parameter: a configurable one- or two-quarter lag, so you can test sensitivity for longer sales cycles.
- Supporting metrics on the same view: CAC payback, NRR, and pipeline coverage next to the magic number, so nobody reads it in isolation.
Platforms like HubSpot and Salesforce can produce most of this natively once revenue and expense data are synced. The harder part is organizational: getting finance and sales ops to agree on one definition and keep it.
The bottom line on the SaaS magic number#
The magic number is the quickest health check you can run on a go-to-market engine. Above 0.75, you've earned the right to spend more. Below 0.5, more spend will burn cash faster. Between those two, the gains are in fixing the funnel, not in adding to the budget.
Read it as a trend. Segment it by motion. Pair it with CAC payback and retention. And when it disappoints, start with the cheapest fixes: sharper targeting and cleaner data, before you cut headcount or rethink the whole strategy.
If wasted outreach is dragging your magic number down, Tomba Email Finder gives your reps verified professional email addresses by name, domain, or company in seconds. That means more selling hours, fewer bounces, and more of every S&M dollar going toward pipeline. Start on the free tier, check the hit rate against your own target accounts, and see whether it moves your next quarter's number.
Related guides#
// start free
See who Tomba finds at any company
Type a company's domain to see its people, their roles and verified work emails, each with the pages it was found on. Free account, no card.
Free plan · No credit card required · GDPR & CCPA
// about the author